

Harmonic motion imaging of human breast masses: an in vivo clinical feasibility
- PMID: 32943648
- PMCID: PMC7498461
- DOI: 10.1038/s41598-020-71960-5
Harmonic motion imaging of human breast masses: an in vivo clinical feasibility
Abstract
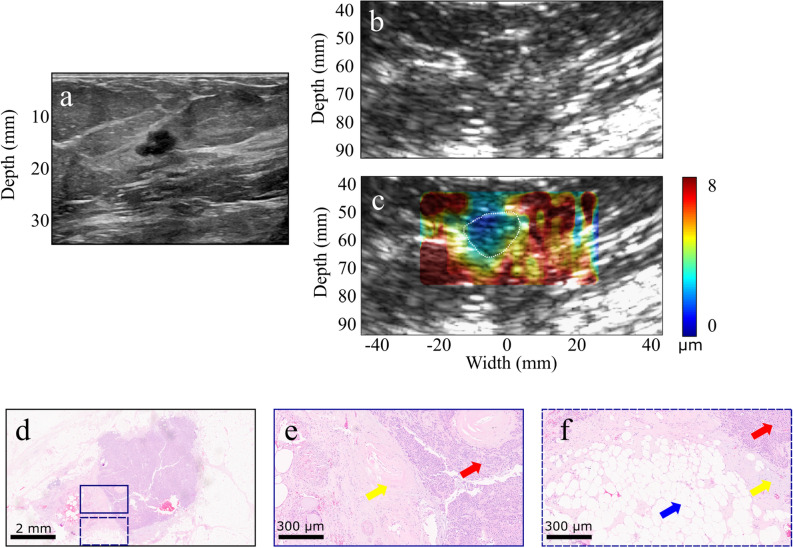
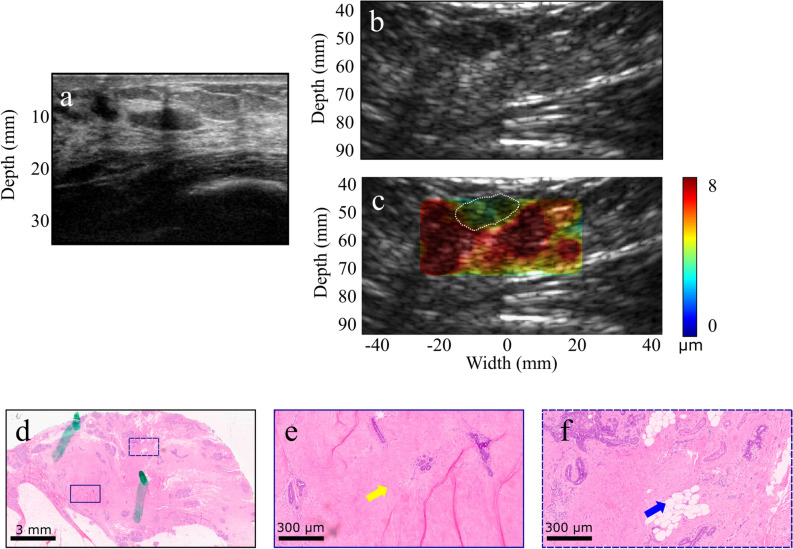
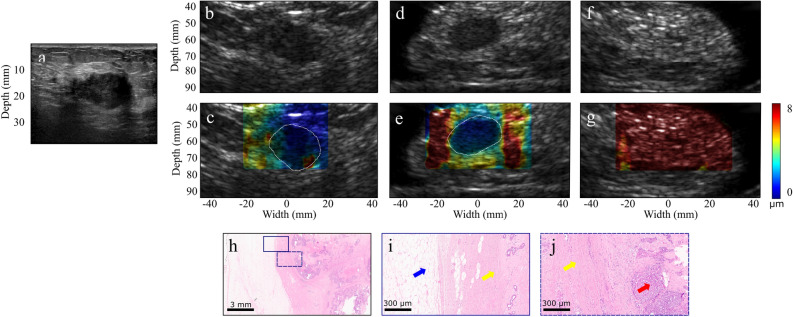
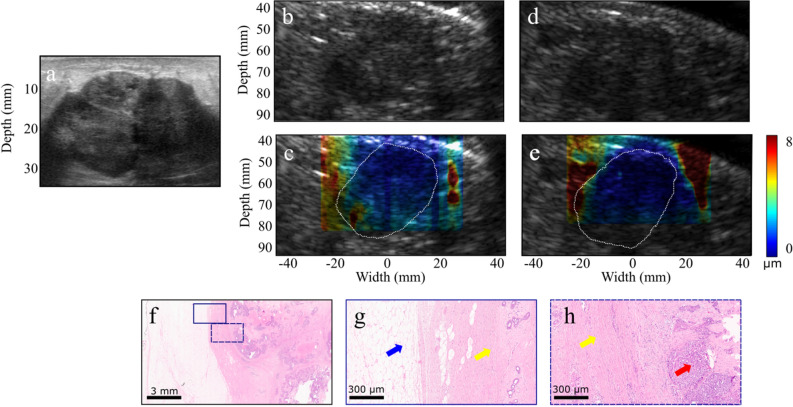
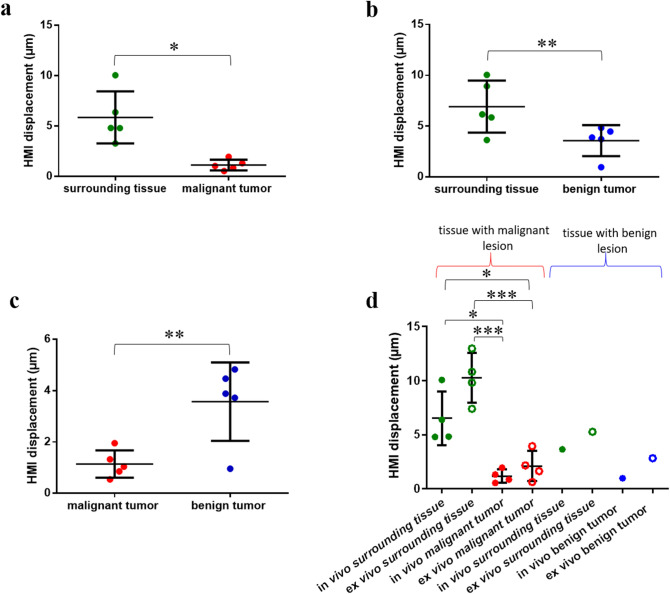
Non-invasive diagnosis of breast cancer is still challenging due to the low specificity of the imaging modalities that calls for unnecessary biopsies. The diagnostic accuracy can be improved by assessing the breast tissue mechanical properties associated with pathological changes. Harmonic motion imaging (HMI) is an elasticity imaging technique that uses acoustic radiation force to evaluate the localized mechanical properties of the underlying tissue. Herein, we studied the in vivo feasibility of a clinical HMI system to differentiate breast tumors based on their relative HMI displacements, in human subjects. We performed HMI scans in 10 female subjects with breast masses: five benign and five malignant masses. Results revealed that both benign and malignant masses were stiffer than the surrounding tissues. However, malignant tumors underwent lower mean HMI displacement (1.1 ± 0.5 µm) compared to benign tumors (3.6 ± 1.5 µm) and the adjacent non-cancerous tissue (6.4 ± 2.5 µm), which allowed to differentiate between tumor types. Additionally, the excised breast specimens of the same patients (n = 5) were imaged post-surgically, where there was an excellent agreement between the in vivo and ex vivo findings, confirmed with histology. Higher displacement contrast between cancerous and non-cancerous tissue was found ex vivo, potentially due to the lower nonlinearity in the elastic properties of ex vivo tissue. This preliminary study lays the foundation for the potential complementary application of HMI in clinical practice in conjunction with the B-mode to classify suspicious breast masses.
Conflict of interest statement
The authors declare no competing interests.
Figures
Similar articles
-
Feasibility of Harmonic Motion Imaging Using a Single Transducer: In Vivo Imaging of Breast Cancer in a Mouse Model and Human Subjects.IEEE Trans Med Imaging. 2021 May;40(5):1390-1404. doi: 10.1109/TMI.2021.3055779. Epub 2021 Apr 30. IEEE Trans Med Imaging. 2021. PMID: 33523806 Free PMC article.
-
Tumor characterization and treatment monitoring of postsurgical human breast specimens using harmonic motion imaging (HMI).Breast Cancer Res. 2016 May 9;18(1):46. doi: 10.1186/s13058-016-0707-3. Breast Cancer Res. 2016. PMID: 27160778 Free PMC article.
-
Simulation study of amplitude-modulated (AM) harmonic motion imaging (HMI) for stiffness contrast quantification with experimental validation.Ultrason Imaging. 2010 Jul;32(3):154-76. doi: 10.1177/016173461003200304. Ultrason Imaging. 2010. PMID: 20718245
-
Harmonic motion imaging for abdominal tumor detection and high-intensity focused ultrasound ablation monitoring: an in vivo feasibility study in a transgenic mouse model of pancreatic cancer.IEEE Trans Ultrason Ferroelectr Freq Control. 2015 Sep;62(9):1662-73. doi: 10.1109/TUFFC.2015.007113. IEEE Trans Ultrason Ferroelectr Freq Control. 2015. PMID: 26415128 Free PMC article.
-
Breast Elastography: How We Do It.Ultrasound Q. 2015 Dec;31(4):255-61. doi: 10.1097/RUQ.0000000000000180. Ultrasound Q. 2015. PMID: 26327432 Review.
Cited by
-
Feasibility of Harmonic Motion Imaging Using a Single Transducer: In Vivo Imaging of Breast Cancer in a Mouse Model and Human Subjects.IEEE Trans Med Imaging. 2021 May;40(5):1390-1404. doi: 10.1109/TMI.2021.3055779. Epub 2021 Apr 30. IEEE Trans Med Imaging. 2021. PMID: 33523806 Free PMC article.
-
An analytical model of full-field displacement and strain induced by amplitude-modulated focused ultrasound in harmonic motion imaging.Phys Med Biol. 2021 Apr 6;66(7):10.1088/1361-6560/abddd1. doi: 10.1088/1361-6560/abddd1. Phys Med Biol. 2021. PMID: 33472178 Free PMC article.
-
Harmonic Motion Imaging-Guided Focused Ultrasound Ablation: Comparison of Three Focused Ultrasound Interference Filtering Methods.Ultrasound Med Biol. 2024 Jan;50(1):119-127. doi: 10.1016/j.ultrasmedbio.2023.09.012. Epub 2023 Oct 21. Ultrasound Med Biol. 2024. PMID: 37872031 Free PMC article.
-
An Efficient and Multi-Focal Focused Ultrasound Technique for Harmonic Motion Imaging.IEEE Trans Biomed Eng. 2023 Apr;70(4):1150-1161. doi: 10.1109/TBME.2022.3211465. Epub 2023 Mar 21. IEEE Trans Biomed Eng. 2023. PMID: 36191094 Free PMC article.
-
The impact of amplitude modulation frequency in harmonic motion imaging on inclusion characterization.Ultrasound Med Biol. 2023 Aug;49(8):1768-1779. doi: 10.1016/j.ultrasmedbio.2023.03.025. Epub 2023 May 16. Ultrasound Med Biol. 2023. PMID: 37202245 Free PMC article.
References
-
- Shapiro S, Venet W, Strax P, Venet L, Roeser R. Ten- to fourteen-year effect of screening on breast cancer mortality. J. Natl. Cancer Inst. 1982;69:349–355. - PubMed
-
- Tabár L, et al. Reduction in mortality from breast cancer after mass screening with mammography. Randomised trial from the breast cancer screening working group of the Swedish National Board of Health and Welfare. Lancet (London, England) 1985;1:829–832. doi: 10.1016/S0140-6736(85)92204-4. - DOI - PubMed
Publication types
MeSH terms
Grants and funding
LinkOut - more resources
Full Text Sources
Medical
