. 2020 Sep 17;10(1):15235.
doi: 10.1038/s41598-020-72039-x.

Somatostatin 1.1 contributes to the innate exploration of zebrafish larva

Affiliations

Somatostatin 1.1 contributes to the innate exploration of zebrafish larva

Feng B Quan et al. Sci Rep. .

Abstract

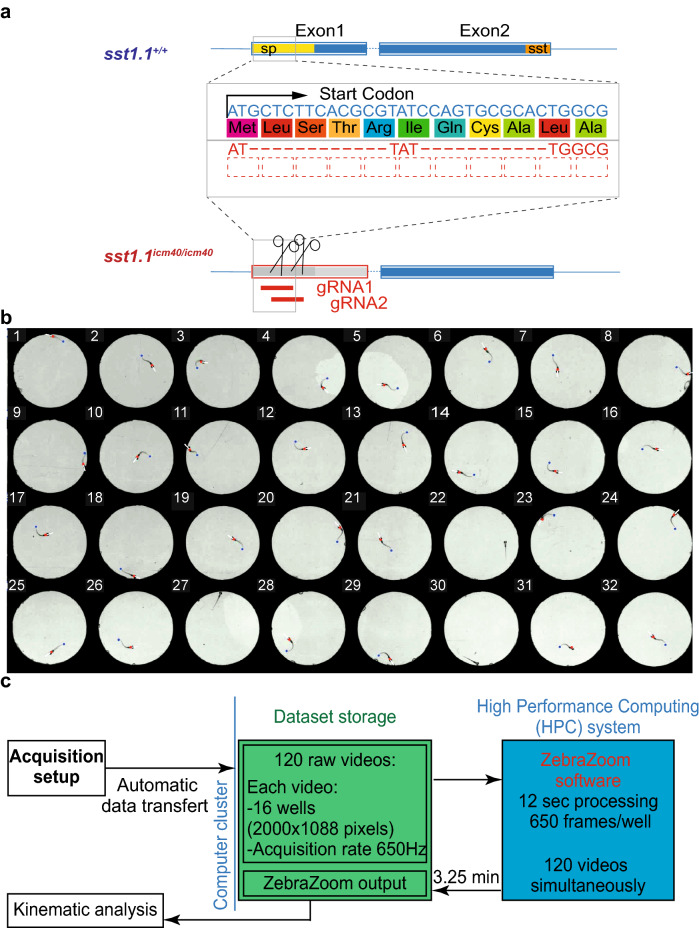
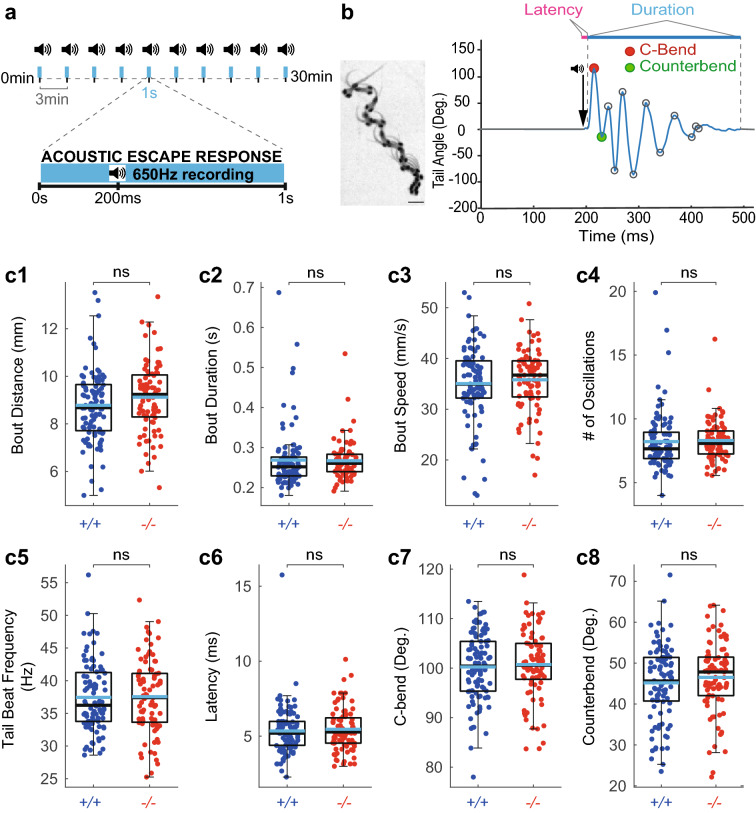
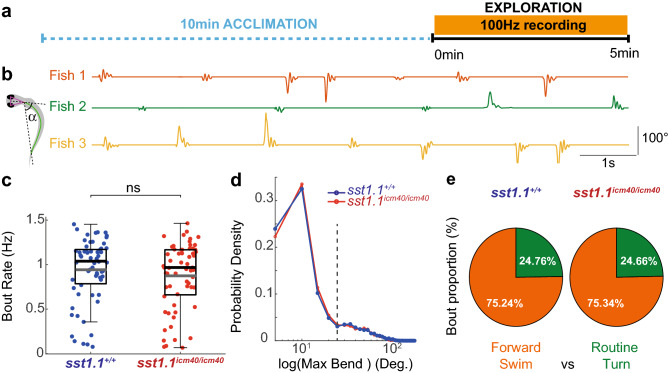
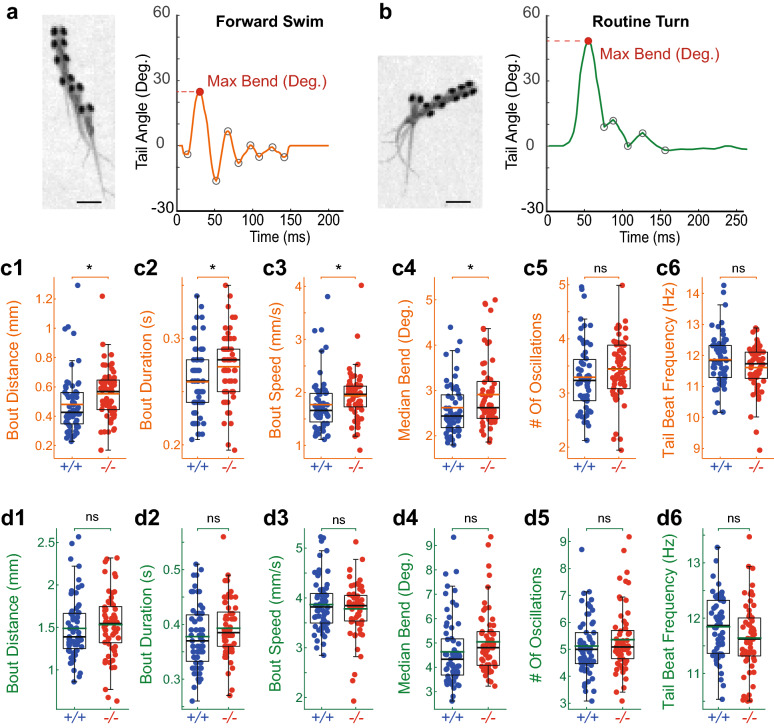
Pharmacological experiments indicate that neuropeptides can effectively tune neuronal activity and modulate locomotor output patterns. However, their functions in shaping innate locomotion often remain elusive. For example, somatostatin has been previously shown to induce locomotion when injected in the brain ventricles but to inhibit fictive locomotion when bath-applied in the spinal cord in vitro. Here, we investigated the role of somatostatin in innate locomotion through a genetic approach by knocking out somatostatin 1.1 (sst1.1) in zebrafish. We automated and carefully analyzed the kinematics of locomotion over a hundred of thousand bouts from hundreds of mutant and control sibling larvae. We found that the deletion of sst1.1 did not impact acousto-vestibular escape responses but led to abnormal exploration. sst1.1 mutant larvae swam over larger distance, at higher speed and performed larger tail bends, indicating that Somatostatin 1.1 inhibits spontaneous locomotion. Altogether our study demonstrates that Somatostatin 1.1 innately contributes to slowing down spontaneous locomotion.


Conflict of interest statement

O.M. work as a free-lance to develop the software ZebraZoom for other scientists in Academia (open-source software available for download, see https://zebrazoom.org). The other authors declare no competing interests.

Figures

Figure 1
Figure 1
Generation of the sst1.1 mutant and a high-throughput assay for kinematic analysis. (a) Generation of the mutated allele icm40 of the somatostatin 1.1 gene (sst1.1icm40) using CRISPR/Cas9-mediated genome editing. Top, genomic organization of the sst1.1 wild type gene with the coding sequence (yellow) of the signal peptide (sp, 24 amino acids) and (orange) mature somatostatin peptide (sst, 26 amino acids). Bottom, the icm40 mutated allele results from 23-bp deletion that impairs the start codon, and induces a frameshift in the sst1.1 coding sequence. (b) We developed a high throughput behavior assay to simultaneously record and at high frequency (350 Hz) 32–88 freely-swimming zebrafish larvae in individual circular swim arenas of 15-mm diameter. Behavioral recordings were tracked using the ZebraZoom algorithm, which detects the head direction (white line), the body position (red dots) and the tail end position (blue dot). See Supplementary Video S1. (c) Illustration of the pipeline for image processing in order to achieve rapid high-throughput analysis of kinematics between mutants and their control siblings. See “Methods”.
Figure 2
Figure 2
Somatostatin 1.1 does not contribute to the kinematic of acousto-vestibular escape responses. (a) Experimental paradigm used to record the escape response of 5 dpf zebrafish larvae to AV stimuli delivered for 5 ms at 500 Hz. Larvae were subjected to 10 trials interspaced by 3 min. Behavioral responses were recorded for 1 s at 650 Hz. (b) Left, Superimposed images illustrating the sequence of movements during a typical AV escape response (scale bar: 1 mm). Right, tail angle trace over time of escape response showing the large C-bend (red circle) followed by the counter bend (green circle) characteristic of the escape response. Latency is defined as the delay between the time of the acoustic stimulus and the onset of the behavioral response; Tail beat frequency (TBF) calculated as the number of oscillations divided by the bout duration. (c1c8) No difference in AV escape responses between sst1.1icm40/icm40 mutants (‘−/−’, 84 larvae from 4 clutches and 761 escapes) and WT siblings (‘+/+’, 96 larvae from 4 clutches and 861 escapes): distance (c1, mean ± SEM 9.12 ± 0.16 mm versus 8.73 ± 0.15 mm in WTs; Wald χ2(1) = 1.047, p = 1), bout duration (c2, mean ±  SEM 0.27 ± 0.01 s versus 0.27 ± 0.01 s in WTs; Wald χ2(1) = 0.996, p = 1), speed (c3, mean ± SEM 35.73 ± 0.67 mm/s versus 34.97 ± 0.78 mm/s in WTs; Wald χ2(1) = 0.457, p = 1), number of oscillations (c4, mean ± SEM 8.27 ± 0.17 versus 8.22 ± 0.23 in WTs; Wald χ2(1) = 0.534, p = 1), tail beat frequency (c5, mean ± SEM 37.56 ± 0.62 Hz versus 37.45 ± 0.54 Hz in WTs; Wald χ2(1) = 0.001, p = 1), latency (c6, mean ± SEM 5.45 ± 0.16 ms versus 5.34 ± 0.17 ms in WTs; Wald χ2(1) = 7.297, p = 0.050), C-bend amplitude (c7, mean ± SEM 100.60 ± 0.76 degrees versus 100.20 ± 0.71 degrees in WTs; Wald χ2(1) = 0.023, p = 1) and counter bend amplitude (c8, mean ± SEM 46.51 ± 0.95 degrees versus 45.15 ± 0.93 degrees in WTs; Wald χ2(1) = 4.167, p = 0.298). Each dot represents the value for one larva averaged over ten trials. Median values are indicated in black, and means in blue; Statistical tests used: Wald chi-square test followed by Meff correction for multiple comparisons. Meff = 7.230.
Figure 3
Figure 3
Somatostatin 1.1 does not contribute to the bout rate nor to the ratio of forward bouts and turns during exploration. (a) Experimental paradigm used to record spontaneous slow swim in 5-dpf zebrafish larvae over 5 min at 100 Hz after 10 min of acclimation. (b) The kinematic analysis relies on the measure of the tail angle α over time as shown for 3 different larvae. (c) Bout rate is similar for sst1.1icm40/icm40 mutant larvae and control WT siblings (Grey line: mean ± SEM. 0.91 ± 0.04 Hz, N = 58 larvae; 0.95 ± 0.04 Hz, N = 62 larvae; Wald χ2(1) = 0.084, p = 0.771). Black lines: medians. (d) Probability density function of the absolute maximal bend amplitude for all bouts of sst1.1icm40/icm40 mutant larvae (red) versus WT siblings (blue). Forward swims and routine turns were sorted with a 25-degree threshold (dashed line). (e) The ratio of forward swims (orange) and routine turns (green) is similar for sst1.1icm40/icm40 mutant larvae and WT siblings.
Figure 4
Figure 4
Somatostatin 1.1 null mutant larvae explore more by deploying longer and faster forward swims. (a) Left, Superimposed images illustrating the sequence of positions observed during a forward swim (scale bar, 1 mm); right, typical forward swim showing the tail angle trace over time with a maximal bend amplitude below 25 degrees. Subsequent peaks (grey circles) correspond to each bend amplitude. (b) Left, superposed images illustrating the sequence of movements during routine turn (scale bar, 1 mm); right, tail angle trace over time of typical routine turn showing the maximal bend amplitude above 25 degrees. (c1c6) Forward swims in sst1.1icm40/icm40 mutant (red, ‘−/−’) had larger distance traveled (c1, mean ± SEM 0.56 ± 0.02 mm versus 0.48 ± 0.03 mm in WTs; Wald χ2(1) = 7.340, p = 0.027), bout duration (c2, mean ± SEM 0.27 ± 0.004 s versus 0.26 ± 0.004 s in WTs; Wald χ2(1) = 7.171, p = 0.030), speed (c3, mean ± SEM 1.96 ± 0.06 mm/s versus 1.78 ± 0.07 mm/s in WTs; Wald χ2(1) = 6.955, p = 0.033) and median bend amplitude (c4, mean ± SEM 2.88 ± 0.10 degrees versus 2.57 ± 0.07 degrees in WTs; Wald χ2(1) = 6.529, p = 0.042) but no difference in number of oscillations (c5, mean ± SEM 3.47 ± 0.07 versus 3.29 ± 0.08 in WTs; Wald χ2(1) = 2.789, p = 0.380), tail beat frequency (c6, mean ± SEM 11.66 ± 0.09 Hz versus 11.84 ± 0.10 Hz in WTs; Wald χ2(1) = 1.785, p = 0.726). Black lines, median; Orange lines, mean. Meff = 4.003. (d1d6) Routine turns were undistinguishable in sst1.1icm40/icm40 mutant larvae compared to WTs siblings: Bout distance (d1, mean ± SEM 1.57 ± 0.04 mm versus 1.49 ± 0.05 mm in WTs; Wald χ2(1) = 1.910, p = 0.755); bout duration (d2, mean ± SEM 0.38 ± 0.01 s versus 0.37 ± 0.01 s in WTs; Wald χ2(1) = 4.025, p = 0.203); speed (d3, mean ± SEM 3.86 ± 0.05 mm/s versus 3.86 ± 0.07 mm/s in WTs; Wald χ2(1) = 0.021, p = 1); median bend amplitude (d4, 4.87 ± 0.14 degrees versus 4.60 ± 0.17 degrees in WTs; Wald χ2(1) = 1.853, p = 0.784); number of oscillations (d5, 5.42 ± 0.16 versus 5.12 ± 0.13 in WTs; Wald χ2(1) = 2.464, p = 0.526); tail beat frequency (d6, 11.68 ± 0.08 Hz versus 11.84 ± 0.07 Hz in WTs; Wald χ2(1) = 2.054, p = 0.686). Black lines, median; Green lines, mean. Each point represents the median for one fish over the 5 min-long recording. Meff = 4.518. Comparison between 62 WT larvae from 4 clutches (17 834 bouts) and 58 sst1.1icm40/icm40 mutant larvae from 4 clutches (16 043 bouts) were tested with Wald χ2.

References

    1. Delcomyn F. Neural basis of rhythmic behavior in animals. Science (80-). 1980;210:492–498. doi: 10.1126/science.7423199. - DOI - PubMed
    1. Grillner S, Wallén P. Central pattern generators for locomotion, with special reference to vertebrates. Annu. Rev. Neurosci. 1985;8:233–261. doi: 10.1146/annurev.ne.08.030185.001313. - DOI - PubMed
    1. Wilson DM, Wyman RJ. Motor output patterns during random and rhythmic stimulation of locust thoracic ganglia. Biophys. J. 1965;5:121–143. doi: 10.1016/S0006-3495(65)86706-6. - DOI - PMC - PubMed
    1. Gabriel JP, et al. Serotonergic modulation of locomotion in zebrafish-endogenous release and synaptic mechanisms. J. Neurosci. 2009;29:10387–10395. doi: 10.1523/JNEUROSCI.1978-09.2009. - DOI - PMC - PubMed
    1. Grillner S, Jessell TM. Measured motion: Searching for simplicity in spinal locomotor networks. Curr. Opin. Neurobiol. 2009;19:572–586. doi: 10.1016/j.conb.2009.10.011. - DOI - PMC - PubMed

Publication types

MeSH terms

LinkOut - more resources