. 2020 Sep 17;3(1):512.
doi: 10.1038/s42003-020-01127-5.

Robust estimation of bacterial cell count from optical density

Collaborators, Affiliations

Robust estimation of bacterial cell count from optical density

Jacob Beal et al. Commun Biol. .

Erratum in

Abstract

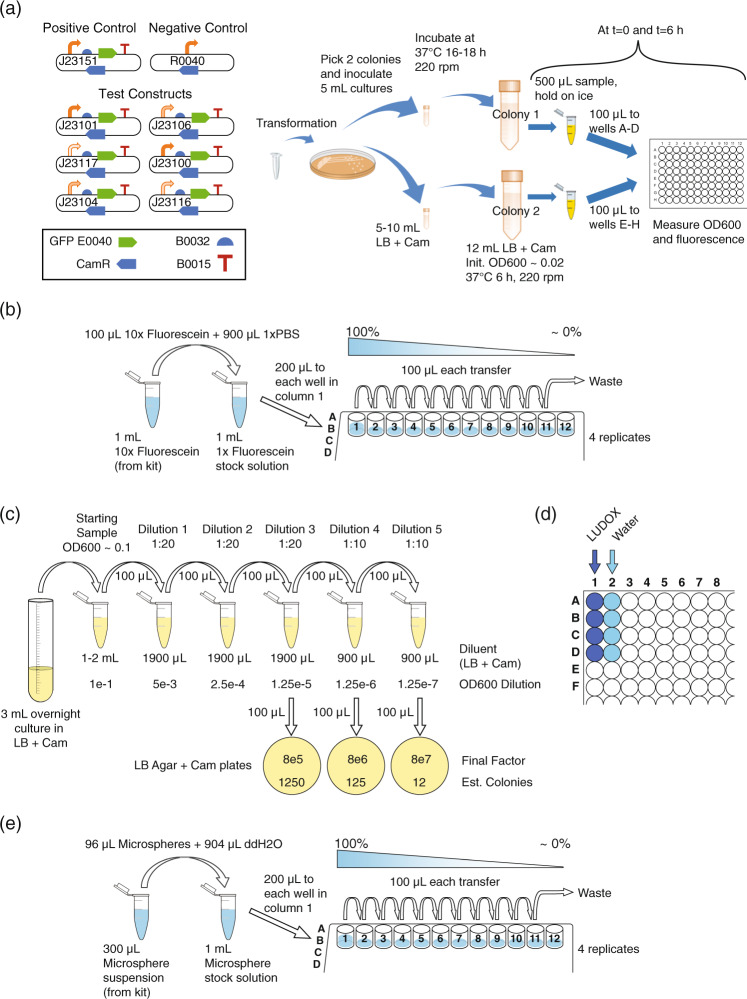
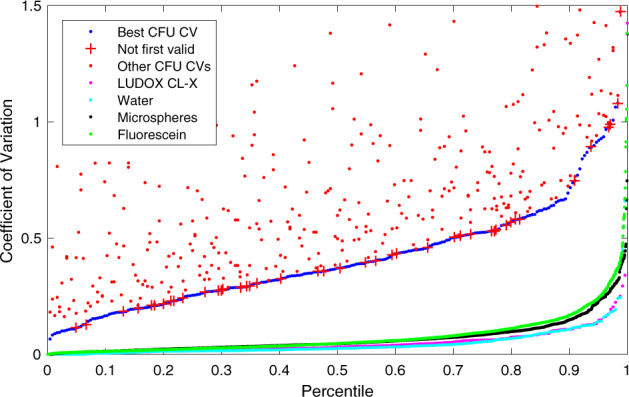
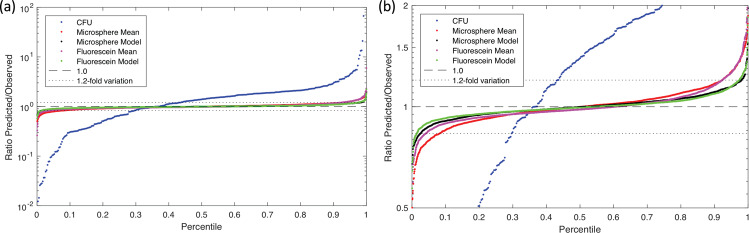
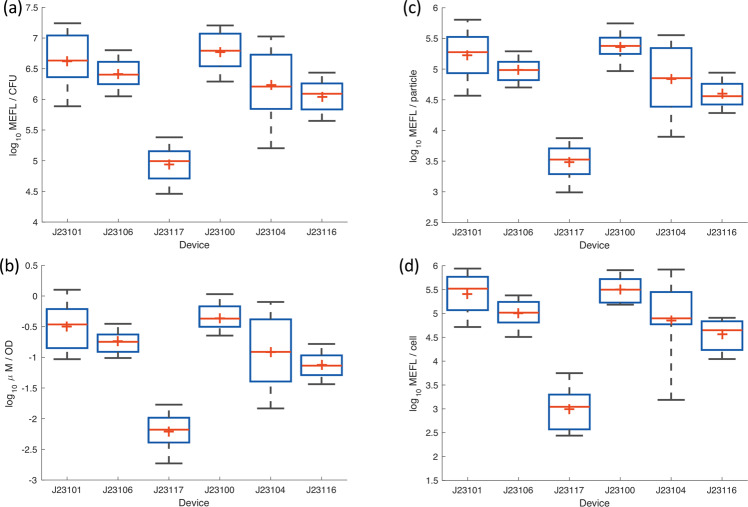
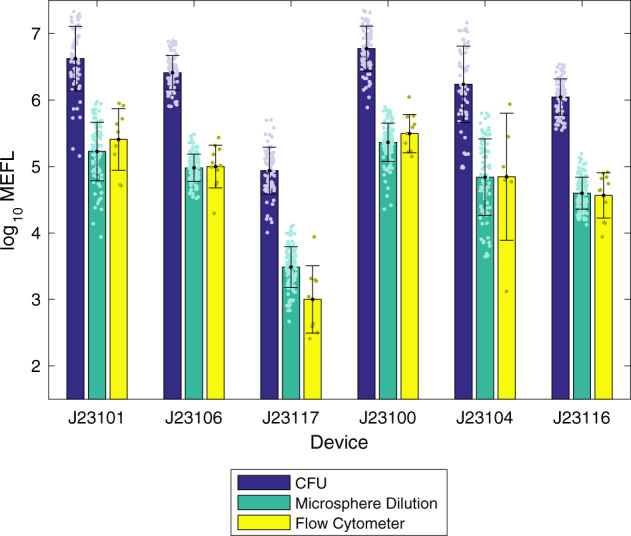
Optical density (OD) is widely used to estimate the density of cells in liquid culture, but cannot be compared between instruments without a standardized calibration protocol and is challenging to relate to actual cell count. We address this with an interlaboratory study comparing three simple, low-cost, and highly accessible OD calibration protocols across 244 laboratories, applied to eight strains of constitutive GFP-expressing E. coli. Based on our results, we recommend calibrating OD to estimated cell count using serial dilution of silica microspheres, which produces highly precise calibration (95.5% of residuals <1.2-fold), is easily assessed for quality control, also assesses instrument effective linear range, and can be combined with fluorescence calibration to obtain units of Molecules of Equivalent Fluorescein (MEFL) per cell, allowing direct comparison and data fusion with flow cytometry measurements: in our study, fluorescence per cell measurements showed only a 1.07-fold mean difference between plate reader and flow cytometry data.


Conflict of interest statement

The authors declare no competing interests.

Figures

Fig. 1
Fig. 1. Study design.
a Each team cultured eight strains of engineered E. coli expressing GFP at various levels: positive and negative controls plus a library of six test constructs with promoters selected to give a range of levels of expression. Each team also collected four sets of calibration measurements, b fluorescein titration for calibration of GFP fluorescence, plus three alternative protocols for calibration of absorbance at 600 nm: c dilution and growth for colony-forming units (CFU), d LUDOX and water, and e serial dilution of 0.961 μm-diameter monodisperse silica microspheres.
Fig. 2
Fig. 2. Distribution of the coefficient of variation for valid replicate sets in CFU, LUDOX/water, microspheres, and fluorescein (all teams included).
CFU models are generated from only the best CV dilution (blue); other dilutions are shown separately above. Even the best CV CFU dilutions, however, have a distribution far worse than the other four methods, and are surprisingly often not the lowest dilution (red crosses). Of the others, LUDOX (magenta) and water (light blue) have the best and near-identical distributions, while microspheres (black) and fluorescein (green) are only slightly higher.
Fig. 3
Fig. 3. Distribution of residuals.
a Model fit residual distribution for each replica set in the CFU (blue), microsphere, and fluorescein calibration protocols (all teams included). b Expanding the Y axis to focus on the microsphere and fluorescein distributions shows that incorporating a model parameter for systematic pipetting error (black, green) produces a notably better fit (and thus likely more accurate unit calibration) than a simple geometric mean over scaling factors (red, magenta).
Fig. 4
Fig. 4. Measured fluorescence of test devices.
Measured fluorescence of test devices after 6 h of growth using a CFU calibration, b LUDOX/water calibration, c microsphere dilution calibration, and d flow cytometry. In each box, red plus indicates geometric mean, red line indicates median, top and bottom edges indicate 25th and 75th percentiles, and whiskers extend from 9 to 91%. Team count per condition provided in Supplementary Data 3.
Fig. 5
Fig. 5. Fluorescence per cell after 6 h of growth, comparing calibrated flow cytometry to estimates using cell count from CFU and microsphere dilution protocols (LUDOX/water is not shown as the units it produces are not comparable).
Microsphere dilution produces values extremely close to the ground truth provided by calibrated flow cytometry, whereas the CFU protocol produces values more than an order of magnitude different, suggesting that CFU calibration greatly underestimates the number of cells in the sample. Bars show geometric mean and standard deviation. Team count per condition provided in Supplementary Data 3.

References

    1. Myers JA, Curtis BS, Curtis WR. Improving accuracy of cell and chromophore concentration measurements using optical density. BMC Biophys. 2013;6:4. doi: 10.1186/2046-1682-6-4. - DOI - PMC - PubMed
    1. DeBlois R, Bean C. Counting and sizing of submicron particles by the resistive pulse technique. Rev. Sci. Instrum. 1970;41:909–916. doi: 10.1063/1.1684724. - DOI
    1. Bapat P, Nandy SK, Wangikar P, Venkatesh K. Quantification of metabolically active biomass using methylene blue dye reduction test (MBRT): measurement of CFU in about 200 s. J. Microbiol. Methods. 2006;65:107–116. doi: 10.1016/j.mimet.2005.06.010. - DOI - PubMed
    1. Hazan R, Que YA, Maura D, Rahme LG. A method for high throughput determination of viable bacteria cell counts in 96-well plates. BMC Microbiol. 2012;12:259. doi: 10.1186/1471-2180-12-259. - DOI - PMC - PubMed
    1. Cadena-Herrera D, et al. Validation of three viable-cell counting methods: manual, semi-automated, and automated. Biotechnol. Rep. 2015;7:9–16. doi: 10.1016/j.btre.2015.04.004. - DOI - PMC - PubMed

Publication types