. 2020 Sep 17;10(1):15295.
doi: 10.1038/s41598-020-72247-5.

Elevated acute phase proteins reflect peripheral inflammation and disease severity in patients with amyotrophic lateral sclerosis

Affiliations

Elevated acute phase proteins reflect peripheral inflammation and disease severity in patients with amyotrophic lateral sclerosis

David R Beers et al. Sci Rep. .

Abstract

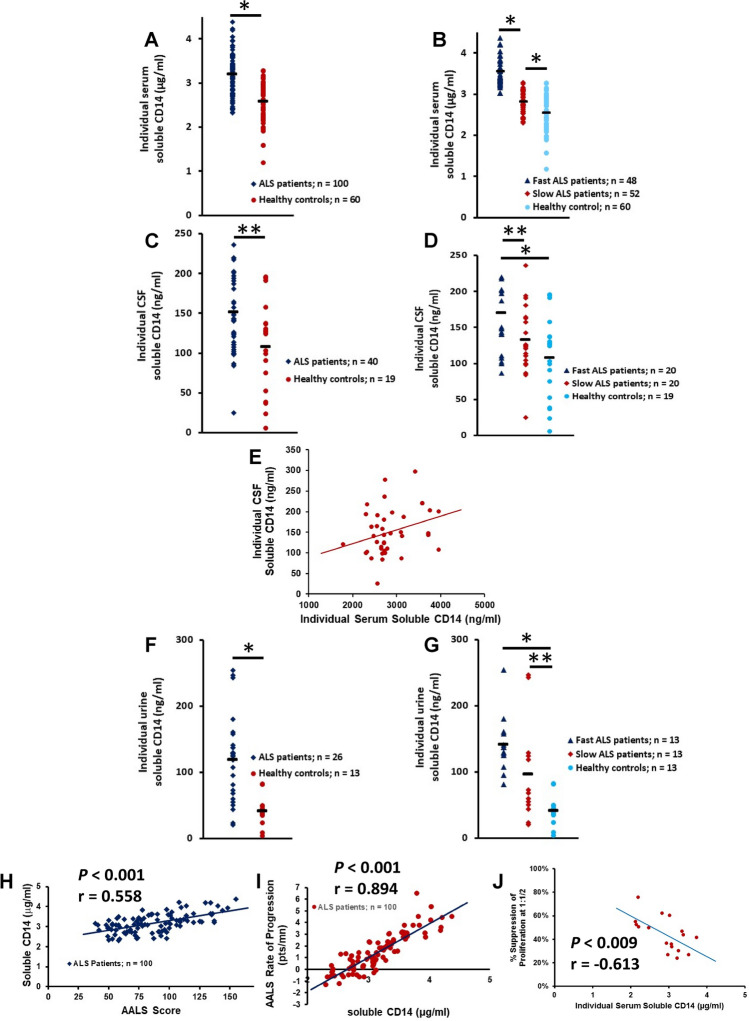
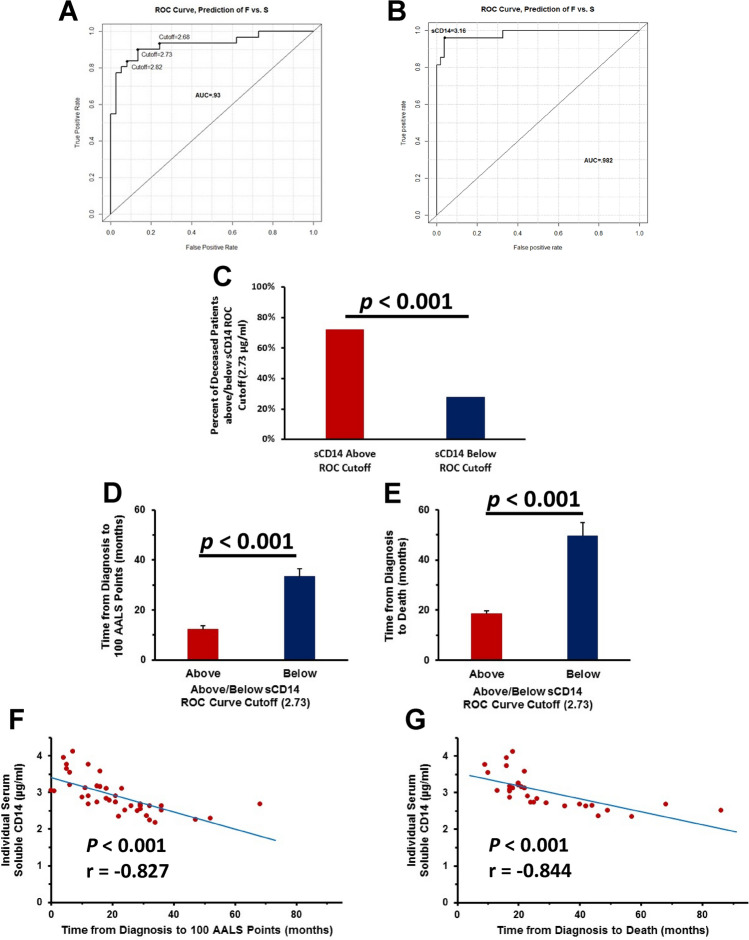
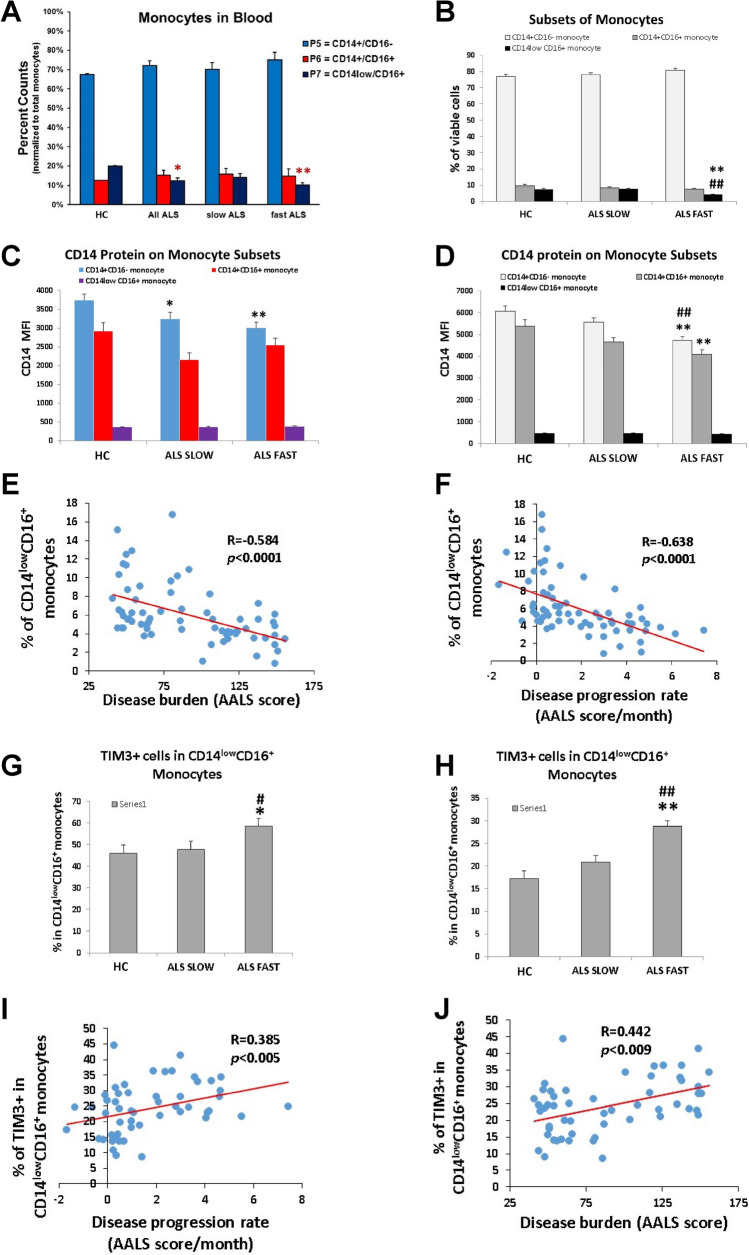
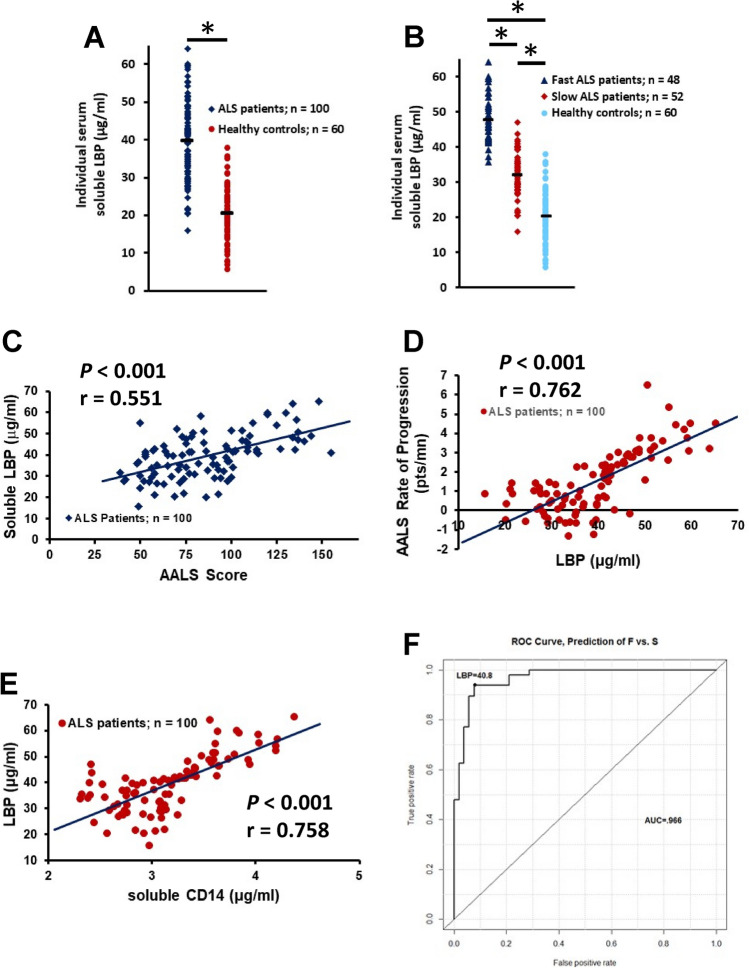
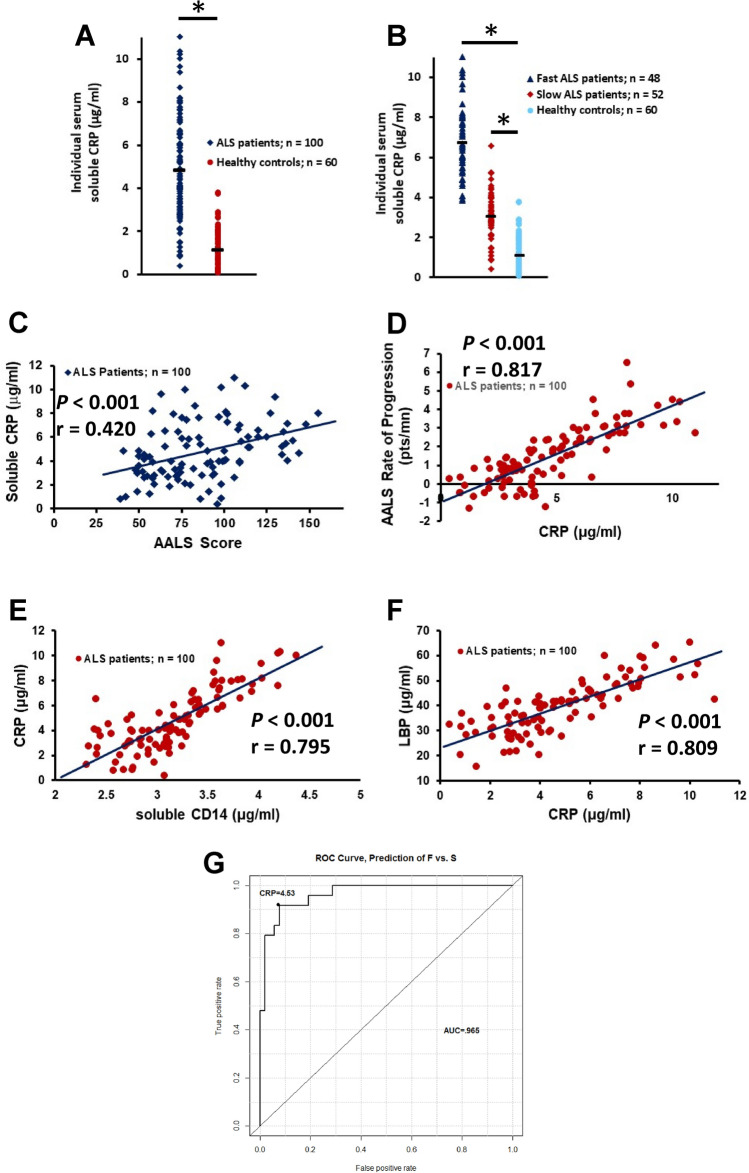
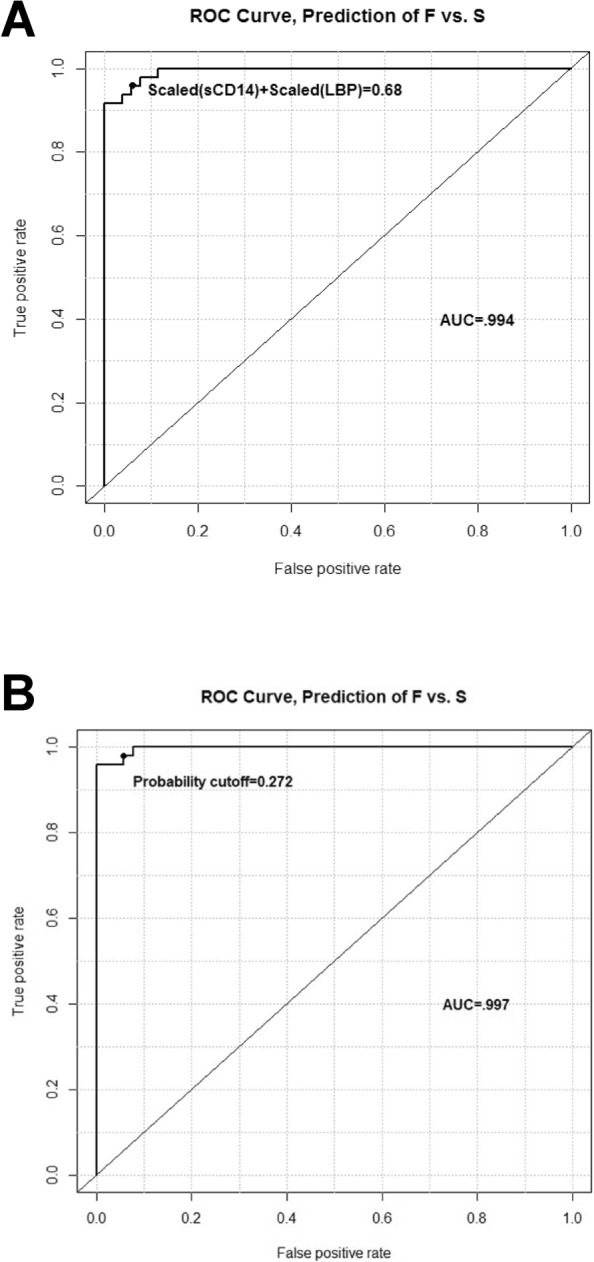
Amyotrophic lateral sclerosis (ALS) is a multifactorial, multisystem pro-inflammatory neuromuscular disorder compromising muscle function resulting in death. Neuroinflammation is known to accelerate disease progression and accentuate disease severity, but peripheral inflammatory processes are not well documented. Acute phase proteins (APPs), plasma proteins synthesized in the liver, are increased in response to inflammation. The objective of this study was to provide evidence for peripheral inflammation by examining levels of APPs, and their contribution to disease burden and progression rates. Levels of APPs, including soluble CD14 (sCD14), lipopolysaccharide binding protein (LBP), and C-reactive protein (CRP), were elevated in sera, and correlated positively with increased disease burden and faster progression. sCD14 was also elevated in patients' CSF and urine. After a 3 year follow-up, 72% of the patients with sCD14 levels above the receiver operating characteristics cutoff were deceased whereas only 28% below the cutoff were deceased. Furthermore, disease onset sites were associated with disease progression rates and APP levels. These APPs were not elevated in sera of patients with Alzheimer's Disease, frontotemporal dementia, or Parkinson's Disease. These collective APPs accurately reflect disease burden, progression rates, and survival times, reinforcing the concept of ALS as a disorder with extensive systemic pro-inflammatory responses.


Conflict of interest statement

DRB and SHA declare a conflict of interest with Implicit Bioscience. The other authors declare no competing interests.

Figures

Figure 1
Figure 1
sCD14 is increased in patients with ALS and correlates with disease burden and disease progression. (A) In a cohort of patients with ALS (n = 100), serum sCD14 levels were elevated compared with HC (*p < 0.001). (B) When this cohort of patients was further separated into fast and slowly progressing patients, sCD14 was elevated in serum from fast (*p < 0.001) and slowly (*p < 0.001) progressing patients compared with HC. (C) sCD14 was elevated in the CSF of patients with ALS compared with CSF obtained from HC (**p = 0.020). (D) CSF samples from fast progressing patients had increased levels of sCD14 compared with slowly progressing patients (**p = 0.033) and with HC (*p = 0.002); there were no differences between slowly progressing patients and HC (p = 0.154). (E) sCD14 CSF levels positively correlated with serum levels of sCD14 (r = 0.315, p = 0.048). (F) sCD14 was elevated in the urine of patients with ALS compared with urine obtained from HC (*p < 0.001). (G) Fast and slowly progressing patients had increased urine sCD14 levels compared with urine sCD14 from HC (*p < 0.001 and **p = 0.022, respectively). (H) sCD14 levels were positively correlated with the patient’s burden of disease at the time of blood draw. (I) sCD14 levels positively correlated with the patient’s progression rate. (J) In a subset of patients with ALS, the patient’s sCD14 levels negatively correlated with their impaired Tregs suppressive function.
Figure 2
Figure 2
sCD14 levels accurately predict disease progression rates and survival times. (A) Serum sCD14 levels were an indicator of disease progression rates. (B) In a larger cohort of patients, serum sCD14 levels were an indicator of disease progression rates. (C) Seventy-two percent of patients who had sCD14 values above the cutoff were deceased while 28% of patients with sCD14 values below the cutoff were deceased. (D) Patients with a ROC score above the cutoff reached 100 AALS points faster than those patients with a score below the cutoff. (E) Patients with ROC scores above the cutoff lived a shorter period of time from diagnosis than those patients with scores below the cutoff. (G) The greater the amounts of serum sCD14, the faster the patients reached 100 AALS points. (J) The greater the amounts of serum sCD14 the faster the patients’ time from diagnosis to death.
Figure 3
Figure 3
mCD14 is decreased on monocytes from patients with ALS and correlates with disease burden and disease progression rate. (A) CD14−/low/CD16+ monocytes were decreased in the total PBMC samples of all patients with ALS compared with HC (*p = 0.04). Fast progressing patients had reduced numbers of CD14−/low/CD16+ monocytes in their PBMC (**p = 0.016). (B) CD14−/low/CD16+ monocytes were decreased in fast progressing patients compared with slowly progressing patients (**p < 0.001) and HC (##p < 0.001). (C) Fast (**p < 0.01) and slowly (*p < 0.01) progressing ALS had reduced CD14 protein signal on surface of their CD14+/CD16˗ monocytes than HC. (D) CD14 MFI was decreased on CD14+/CD16 and CD14+/CD16+ monocytes from patients with fast progressing ALS (**p < 0.01) compared with slowly progressing patients with ALS and HC (*p < 0.01). (E) CD14−/low/CD16+ monocytes were negatively correlated with disease burden. (F) CD14−/low/CD16+ monocytes were negatively correlated with rates of disease progression. (G) CD14−/low/CD16+/TIM-3+ monocytes were increased in PBMC of fast progressing patients compared with CD14−/low/CD16+/TIM-3+ monocytes from slowly progressing patients (#p < 0.001) and HC (*p < 0.001). (H) CD14−/low/CD16+/TIM-3+ monocytes were increased in fast progressing patients compared with slowly progressing patients (##p < 0.001) and HC (**p < 0.001). (I) CD14−/low/CD16+/TIM-3+ monocytes positively correlated with disease progression rates. (J) CD14−/low/CD16+/TIM-3+ monocytes positively correlated with burden of disease.
Figure 4
Figure 4
Serum LBP is increased in patients with ALS and correlates with disease burden and disease progression rate. (A) LBP was increased in the serum of all patients compared with HC (*p < 0.001). (B) LBP was elevated in fast (*p < 0.001) and slowly (*p < 0.001) progressing patients compared with HC. LBP was elevated in the fast progressing patients compared with slowly progressing patients (p < 0.001). (C) Serum LBP positively correlated with the patient’s burden of disease. (D) Serum LBP positively correlated with the patient’s disease progression rate. (E) There was a positive correlation between LBP and sCD14. (F) Serum LBP levels were an accurate indicator of disease progression rates.
Figure 5
Figure 5
Serum CRP is increased in patients with ALS. (A) CRP was elevated in sera of patients compared with HC (*p < 0.001). (B) CRP was elevated in fast (*p < 0.001) and slowly progressing patients compared with HC. (C) Serum CRP was positively correlated with the patient’s burden of disease. (D) Serum CRP was positively correlated with the patient’s disease progression rate). (E) There was a positive correlation between CRP and sCD14 in patients. (F) There was a positive correlation between CRP and LBP in patients. (G) Serum CRP levels were an accurate indicator of disease progression rates.
Figure 6
Figure 6
The addition of disease onset sites improves the predictive abilities of three APPs. (A) Serum sCD14 and LBP levels distinguish fast progressing patients from slowly progressing patients. The “probability cutoff” referenced in the graphic is the predicted probability of being in the fast progression group, according to the model equation, which is as follows: Probability of F vs. S = exp(− 4.618 + 5.622*[scaled(LBP) + scaled(sCD14)] + 0 (if site = A) − 1.934 (if site = L) + 1.747 (if site = B))/(1 + exp(− 0.618 + 5.622*[scaled(LBP) + scaled (sCD14)] + 0 (if site = A) − 1.934 (if site = L) + 1.747 (if site = B))). Note “Other” from this model was excluded because the data were too sparse to permit a reliable model. (B) Serum sCD14 levels, serum LBP levels, and disease onset sites distinguished fast progressing patients from slowly progressing patients.

References

    1. Brown RH, Al-Chalabi A. Amyotrophic lateral sclerosis. N. Engl. J. Med. 2017;377:162–172. - PubMed
    1. Beers DR, Appel SH. Immune dysregulation in amyotrophic lateral sclerosis: Mechanisms and emerging therapies. Lancet Neurol. 2019;18:211–220. - PubMed
    1. Henkel JS, et al. Regulatory T-lymphocytes mediate amyotrophic lateral sclerosis progression and survival. EMBO Mol. Med. 2013;5:64–79. - PMC - PubMed
    1. Lu CH, et al. Systemic inflammatory response and neuromuscular involvement in amyotrophic lateral sclerosis. Neurol. Neuroimmunol. Neuroinflamm. 2016;3:e244. - PMC - PubMed
    1. Beers DR, et al. ALS patients' regulatory T lymphocytes are dysfunctional, and correlate with disease progression rate and severity. JCI Insight. 2017;2:e89530. - PMC - PubMed

Publication types