. 2020 Sep;2(9):974-988.
doi: 10.1038/s42255-020-00273-8. Epub 2020 Sep 17.

Fgr kinase is required for proinflammatory macrophage activation during diet-induced obesity

Affiliations

Fgr kinase is required for proinflammatory macrophage activation during diet-induced obesity

Rebeca Acín-Pérez et al. Nat Metab. 2020 Sep.

Abstract

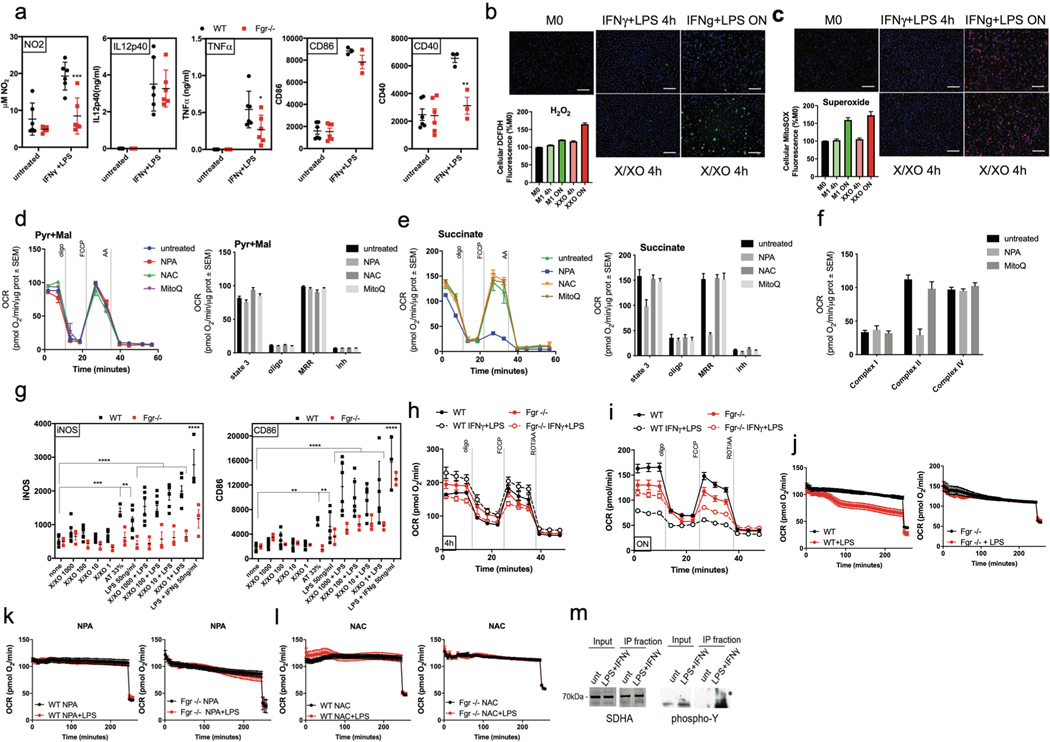
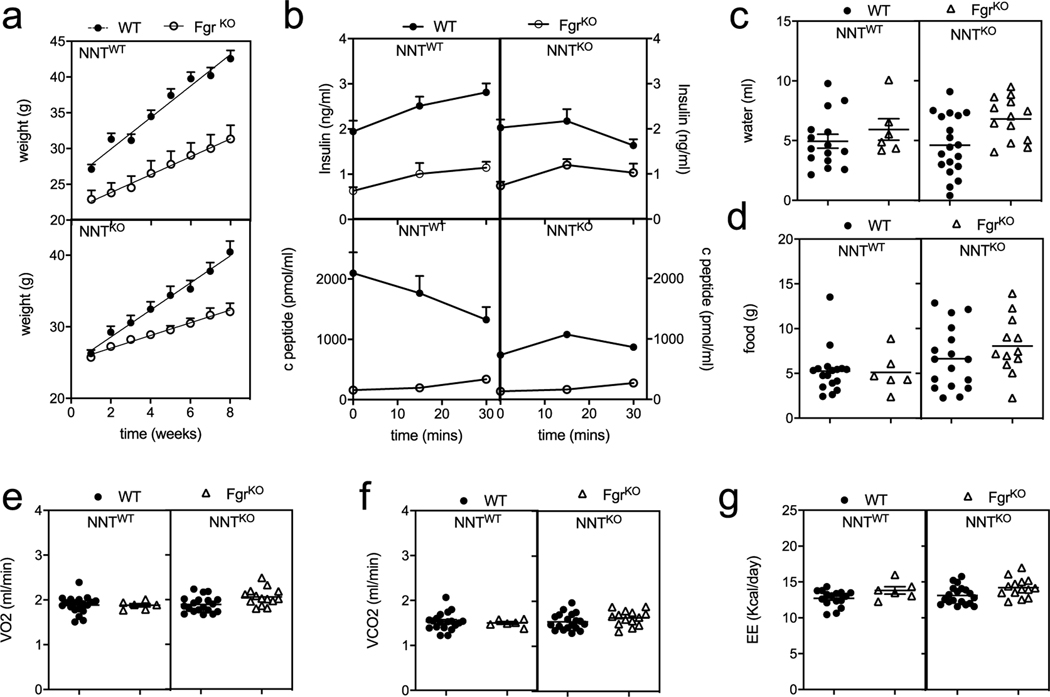
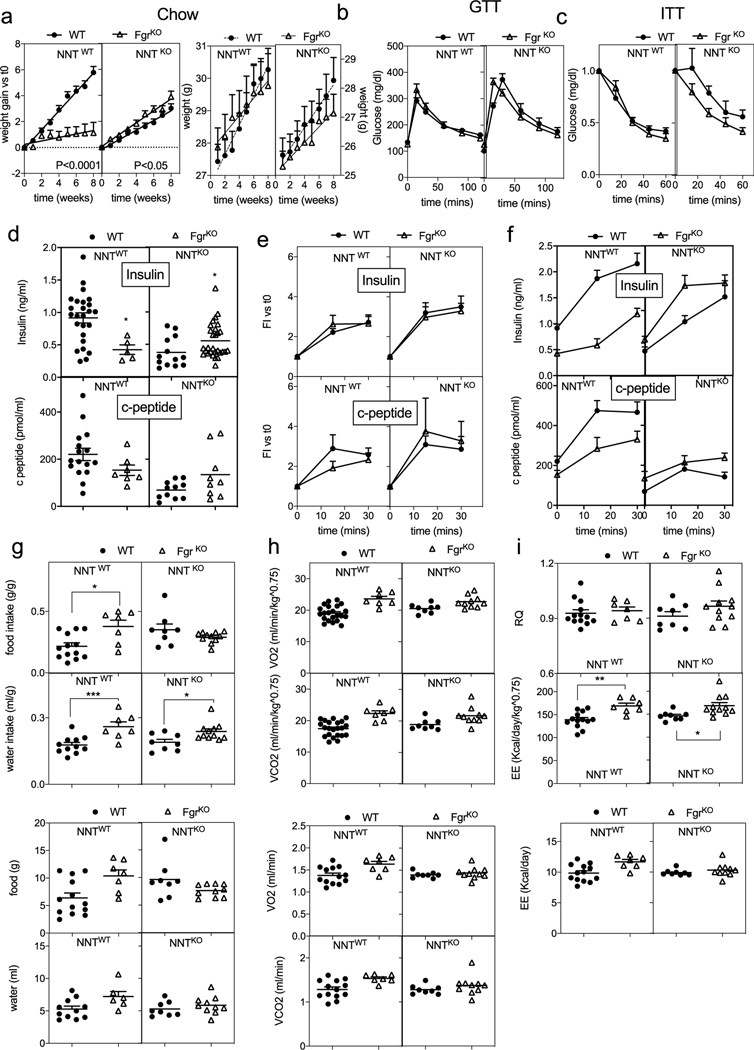
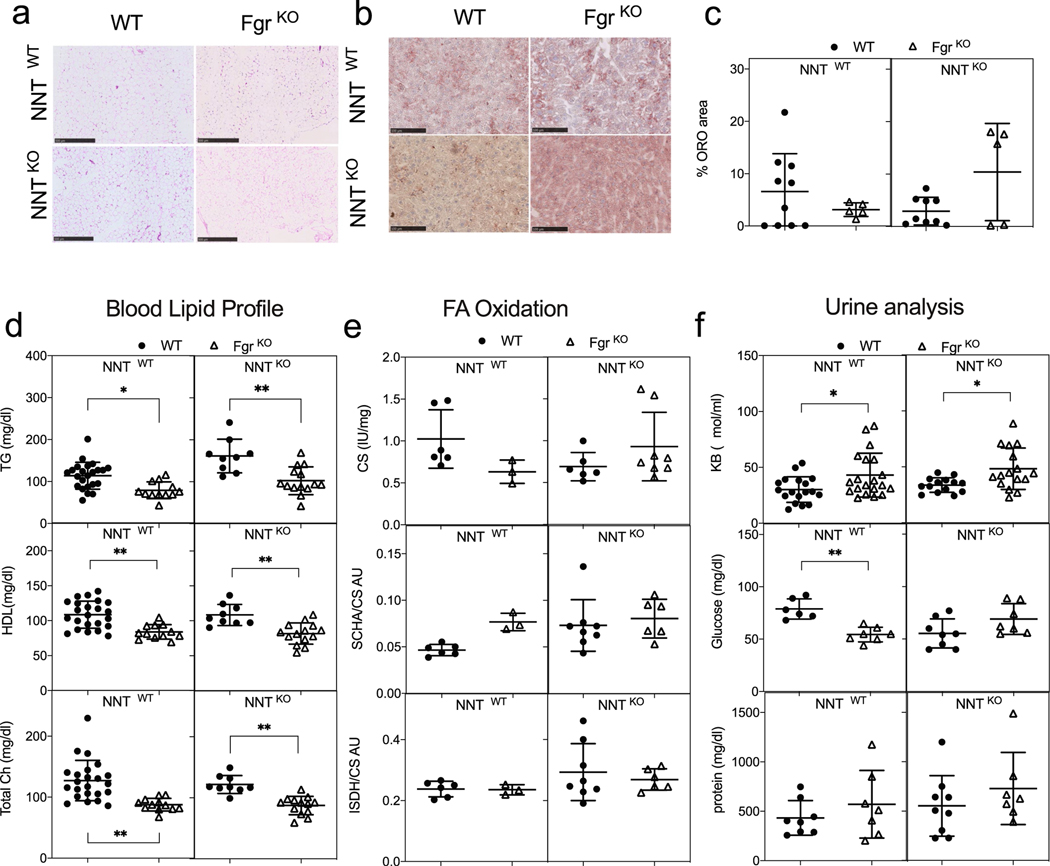
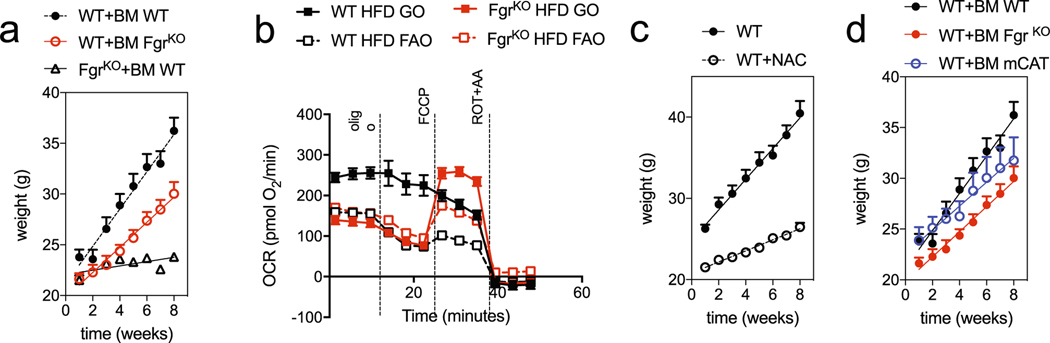
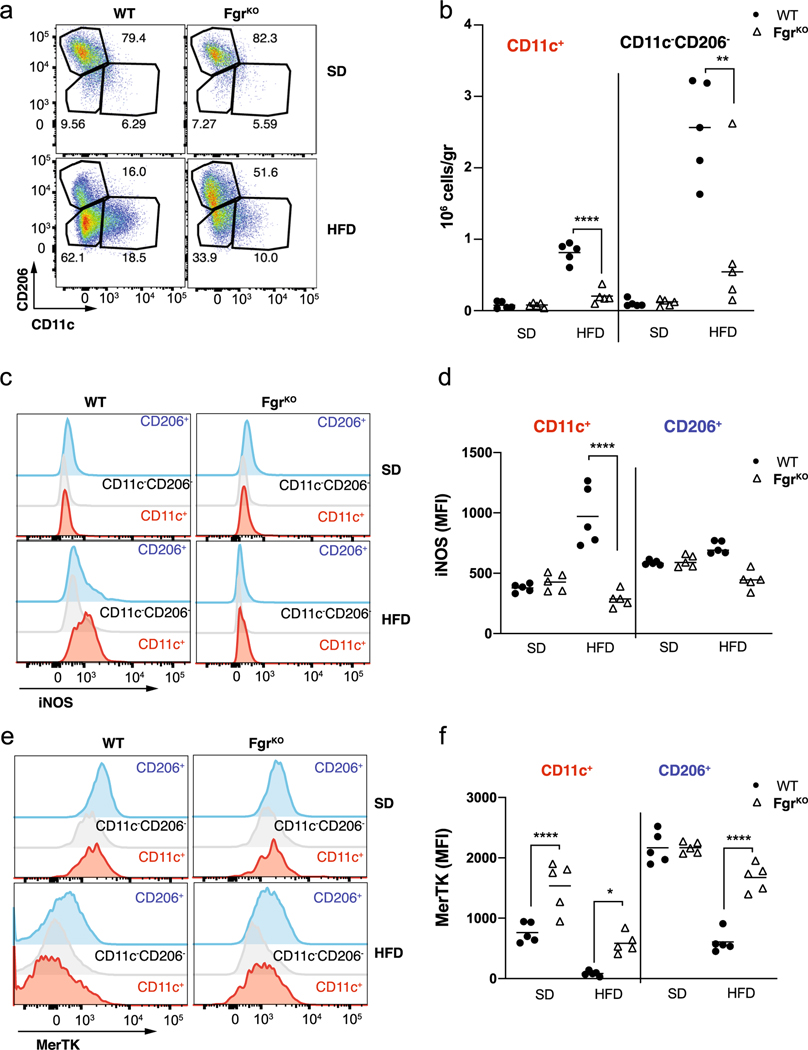
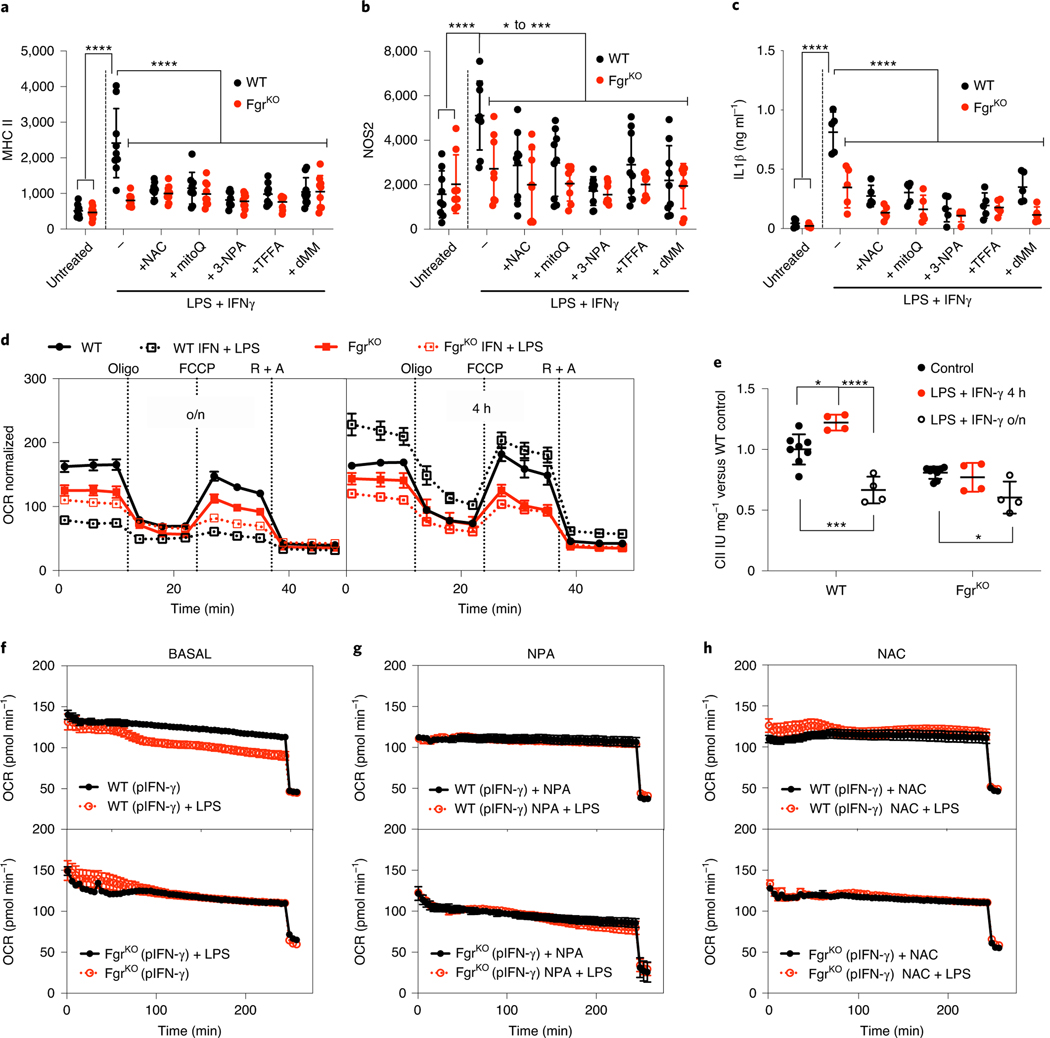
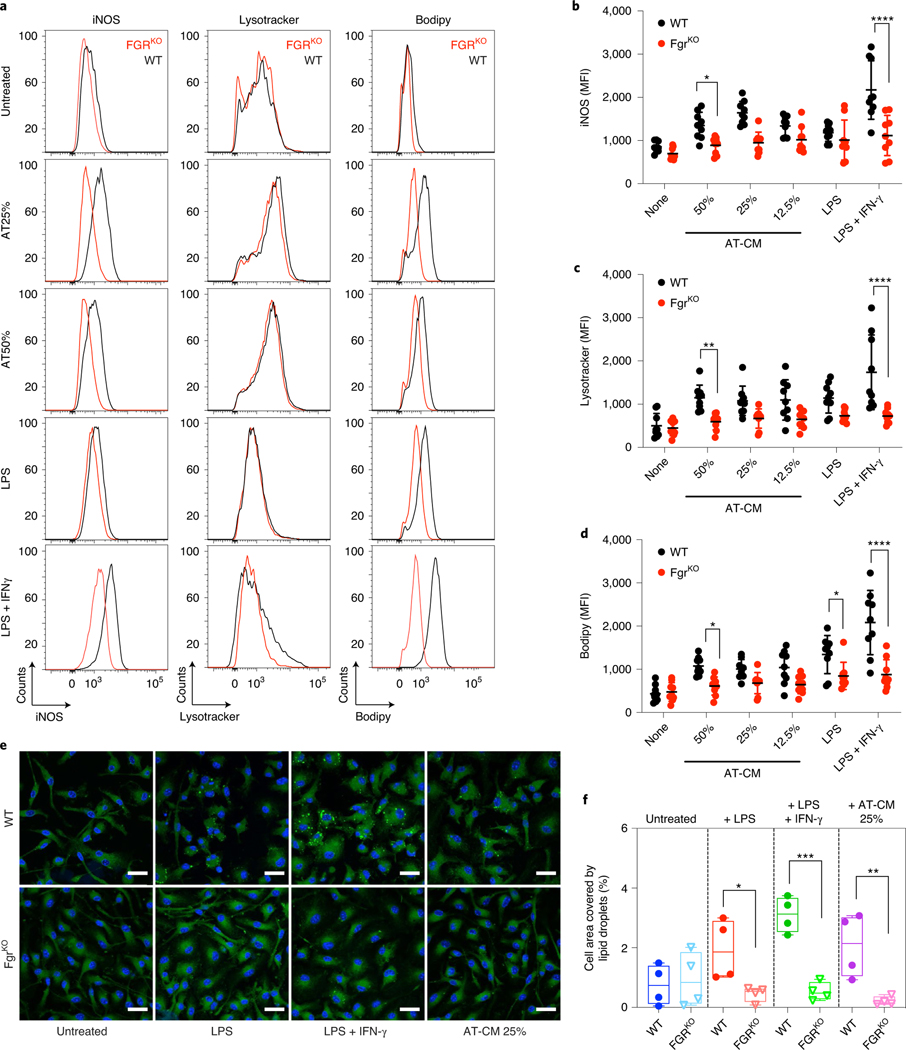
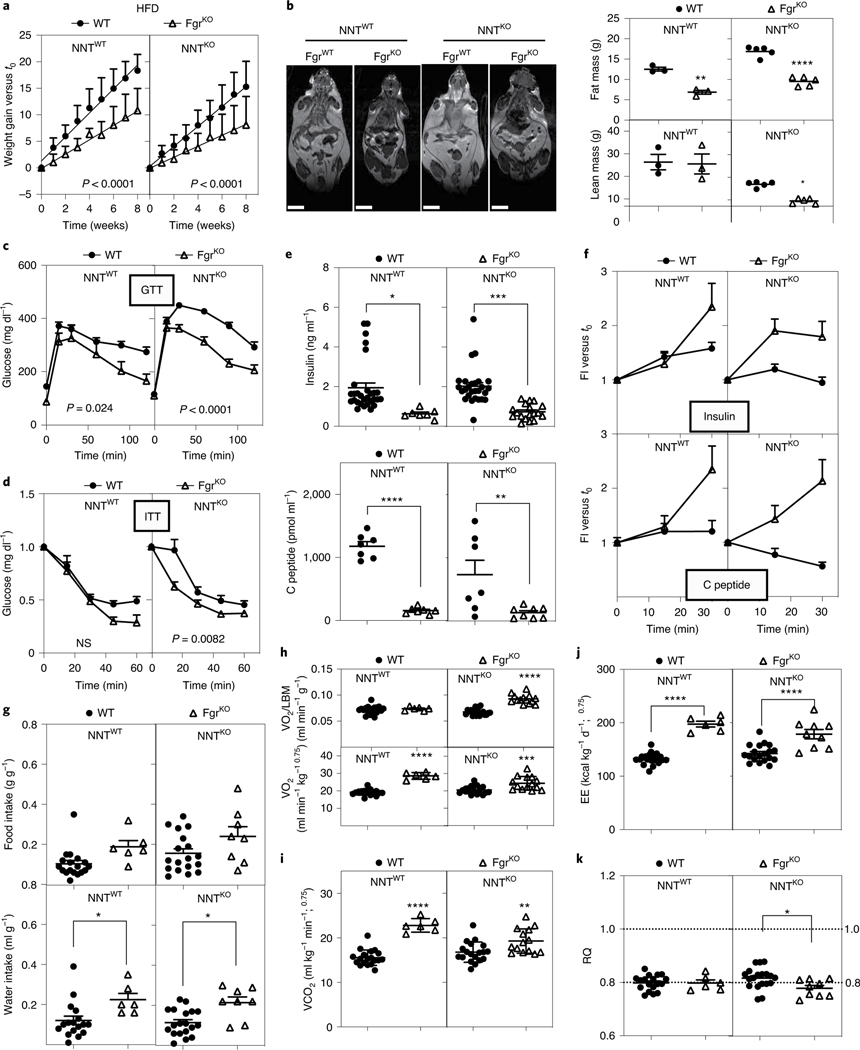
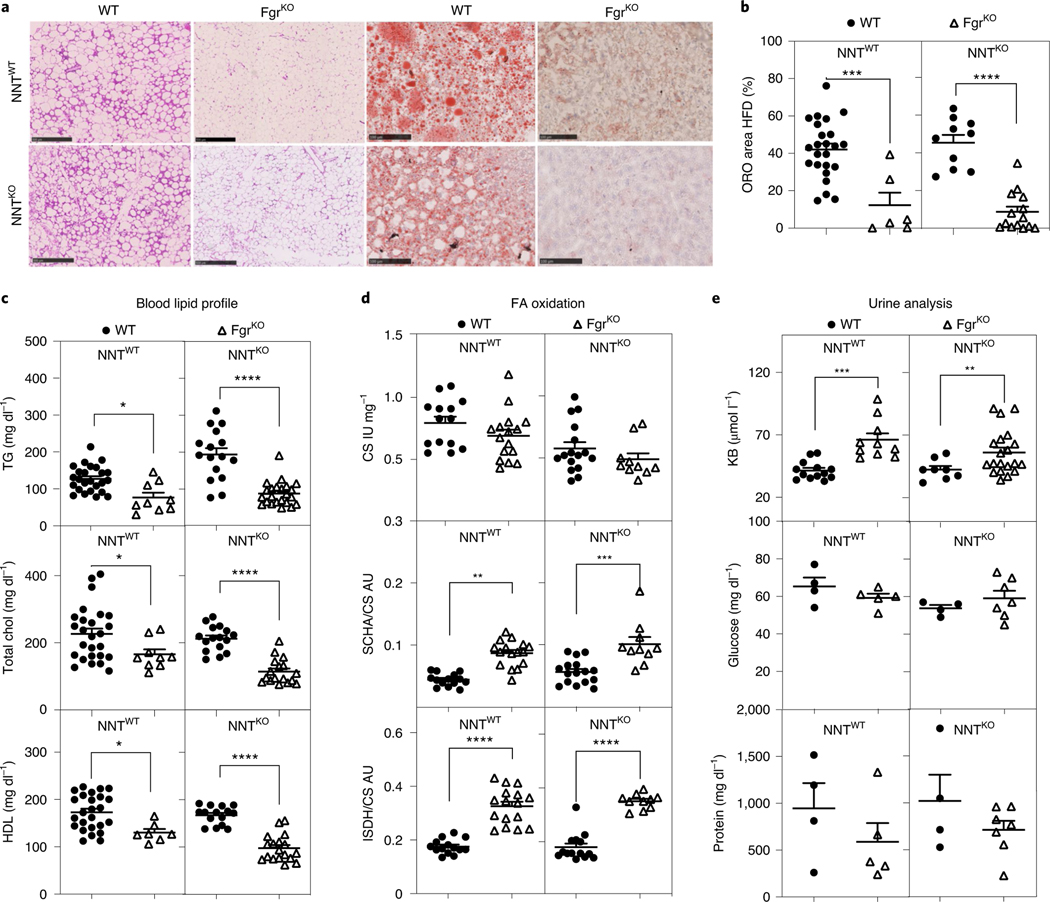
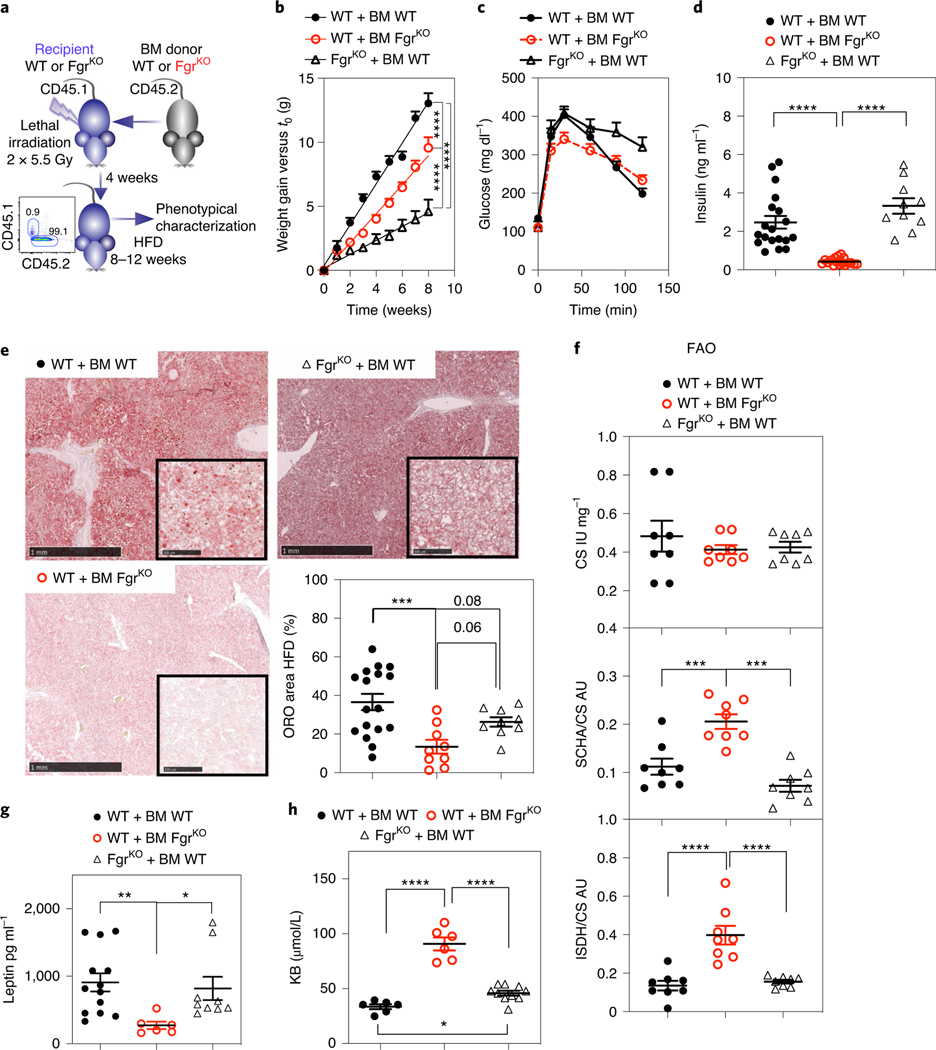
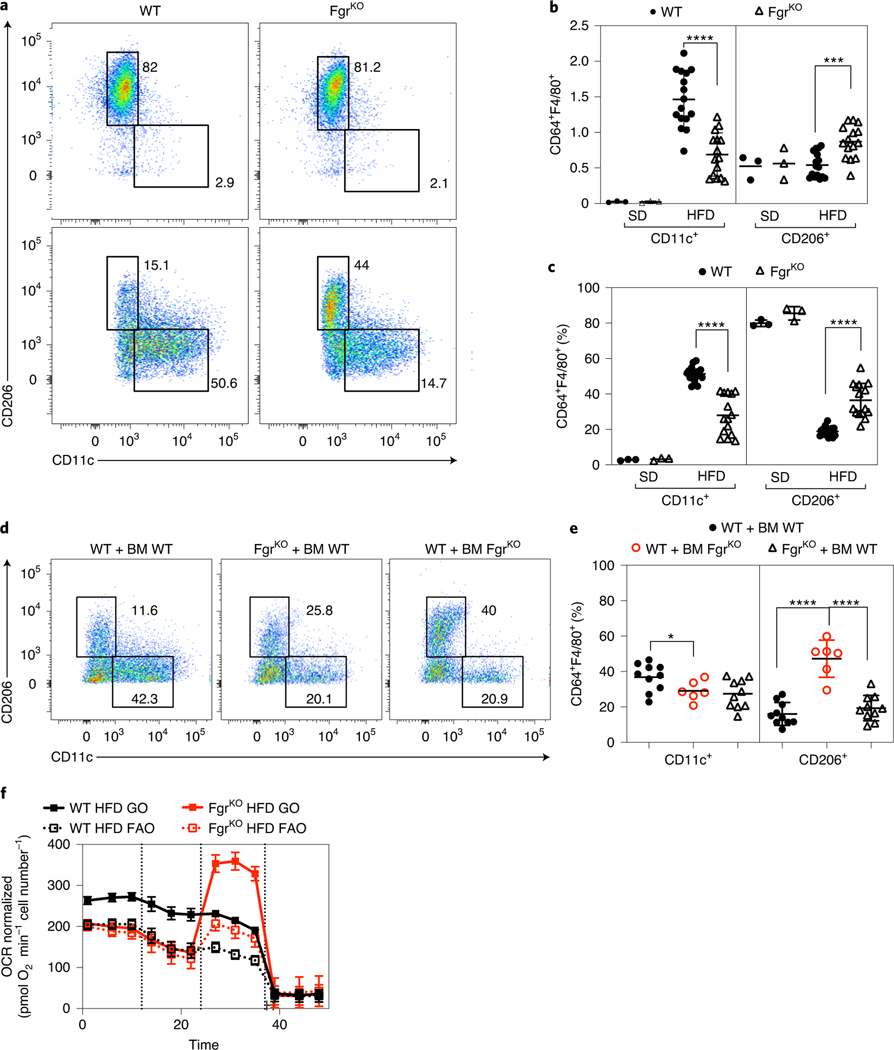
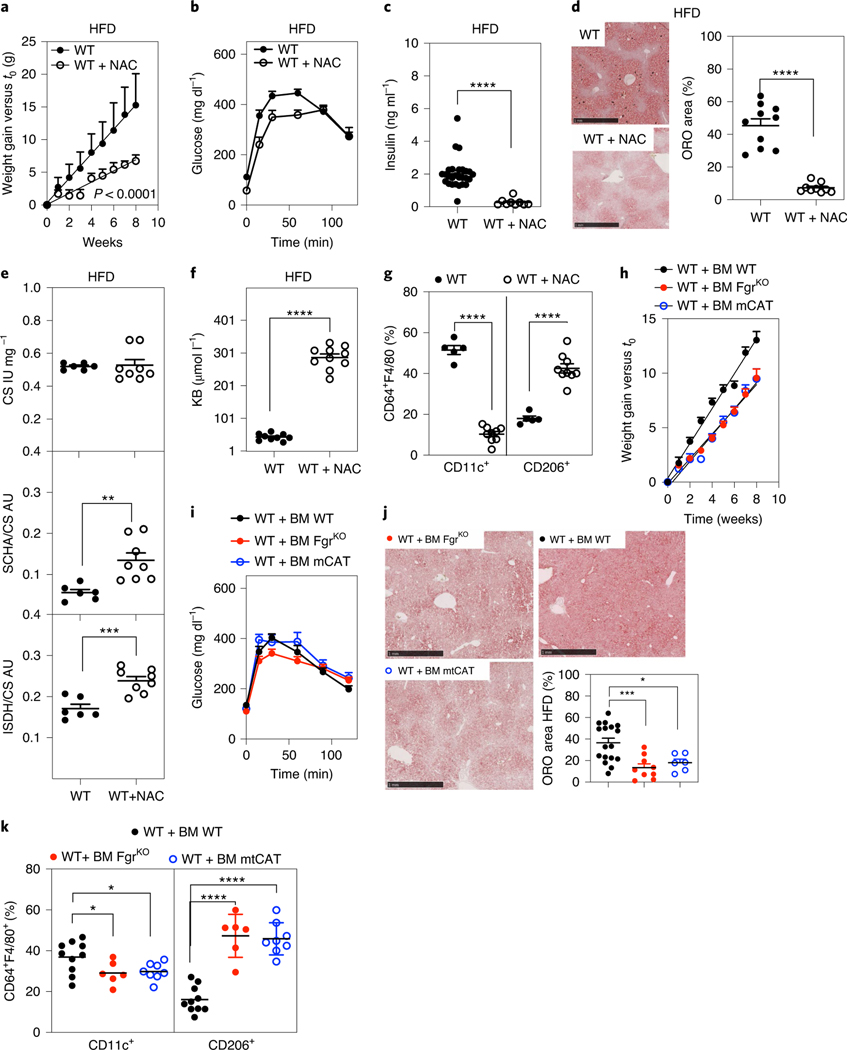
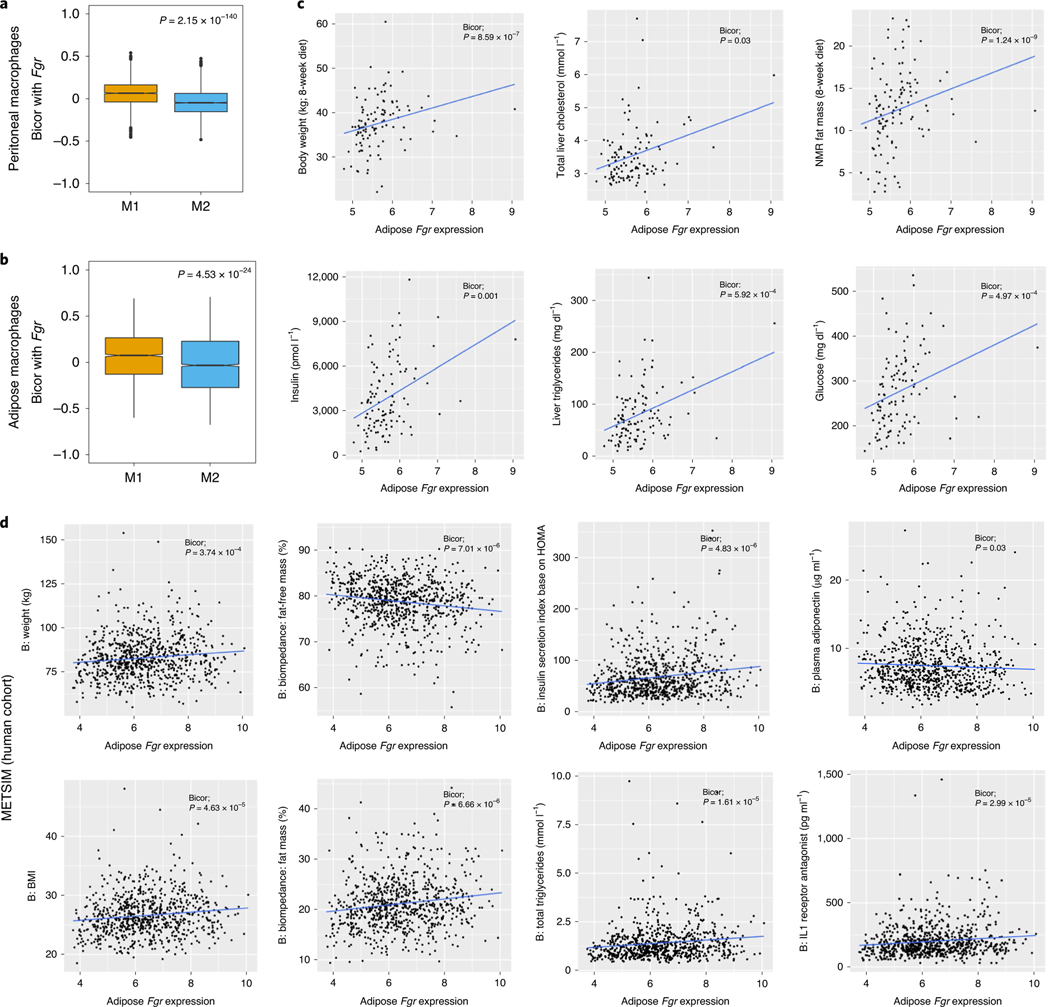
Proinflammatory macrophages are key in the development of obesity. In addition, reactive oxygen species (ROS), which activate the Fgr tyrosine kinase, also contribute to obesity. Here we show that ablation of Fgr impairs proinflammatory macrophage polarization while preventing high-fat diet (HFD)-induced obesity in mice. Systemic ablation of Fgr increases lipolysis and liver fatty acid oxidation, thereby avoiding steatosis. Knockout of Fgr in bone marrow (BM)-derived cells is sufficient to protect against insulin resistance and liver steatosis following HFD feeding, while the transfer of Fgr-expressing BM-derived cells reverts protection from HFD feeding in Fgr-deficient hosts. Scavenging of mitochondrial peroxides is sufficient to prevent Fgr activation in BM-derived cells and HFD-induced obesity. Moreover, Fgr expression is higher in proinflammatory macrophages and correlates with obesity traits in both mice and humans. Thus, our findings reveal the mitochondrial ROS-Fgr kinase as a key regulatory axis in proinflammatory adipose tissue macrophage activation, diet-induced obesity, insulin resistance and liver steatosis.


Conflict of interest statement

Competing interests

The authors declare no competing interests.

Figures

Extended Data Fig. 1 |
Extended Data Fig. 1 |. Activation of Fgr is necessary for M1-like macrophage polarization.
a, BMDM from WT and FgrKO mice untreated or treated with LPS + IFNγ were analyzed by flow cytometry for NO2, IL12p40, TNFα, CD86 and CD40 (n = 6). b-c, Measure of H2O2 (b) and superoxide (c) in WT BMDM treated under the conditions indicated (n = 11). d, Pyruvate-malate and (e) succinate driven respiration in isolated liver mitochondria in the indicated treatments (n = 6). f, Maximal respiratory capacity of mitochondrial complex I, II and IV in isolated liver mitochondria in the indicated treatments (n = 6). g, BMDM from WT and FgrKO mice untreated or treated with xanthine/xanthine oxidase (X/XO), LPS, the combination of both or adipose conditioned media (AT) were analyzed by flow cytometry for NOS2, MHC-II, NOS2 and CD86. WT, n = 6 for all conditions but 33% AT where n = 3, FgrKO, n = 3. Representative unnormalized seahorse profile of oxygen consumption of BMDM from WT and FgrKO mice treated with LPS+ IFNγ for 16 h (overnight, o/n, h) or 4 h (i) (n = 7 for untreated or n = 4 for treated). Representative unnormalized oxygen consumption analysis of IFNγ primed (pIFNγ) BMDM from WT (left panels) and FgrKO (right panels) treated with (j) LPS, (k) LPS plus NPA and (l) LPS plus NAC at the start of the SeaHorse assay (n = 3). m, Complex II immunocapture and phosphorylation analysis by western blot of SDHA in WT BMDM untreated or treated with LPS+ IFNγ for 4hrs. (a,g) *, P <0.05; **, P <0.01; ***, P <0.001; ****, P <0.0001. 2-way ANOVA and Tukey post-hoc test was used. Each point represents a biological replicate. Data are the mean ± SEM.
Extended Data Fig. 2 |
Extended Data Fig. 2 |. Fgr-deficient mice are protected against high fat diet induced obesity.
a, Absolute weight of WT and Fgr KO mice in NNT WT or KO background fed in high fat diet (HFD) for 8 weeks (in NNTWT background, n = 11; in NNTKO background n = 26). b, Insulin (upper panel) and c-peptide (bottom panel) levels after glucose injection (insulin release assay) in WT (solid circles) and FgrKO (open triangles) mice in NNTWT or NNTKO background fed high fat diet. (In b for insulin levels: in NNT WT background, n = 7; in NNTKO background n≥18: for c-peptide levels, n = 7). c-d, Water (c) and food (d) intake by mice assessed in metabolic cages for 48 hours. e, O2 consumption (VO2), (f) CO2 production (VCO2), and (g) energy expenditure (EE) measured in mice in metabolic cages for 48 hours (n = 6). Each point represents a biological replicate. Data are the mean ± SEM.
Extended Data Fig. 3 |
Extended Data Fig. 3 |. Fgr-deficient mice have normal glucose metabolism in standard diet.
a, Weight gain (left panel) and absolute weight (right panel) of WT and Fgr KO mice in NNT WT or KO background fed in standard diet (SD) for 8 weeks (in NNT WT background, n≥12; in NNT KO background n≥8). b-c, Glucose (GTT, b) and insulin tolerance test (ITT, c) in mice fed in SD for 10 weeks (in NNT WT background, n≥14; in NNT KO background n≥8). d, Basal insulin (upper panel) and c-peptide (bottom panel) levels in WT and FgrKO mice in NNTWT or NNTKO background fed HFD for 8–10 weeks. e-f, Fold induction (e) and absolute levels (f) of insulin (upper panel) and c-peptide (bottom panel) amount compared to basal level after glucose injection (insulin release assay) in WT (solid circles) and FgrKO (open triangles) mice in NNTWT or NNTKO background fed high fat diet. (In e-f for insulin levels: in NNT WT background, n≥12; in NNT KO background n≥13: for c-peptide levels, n≥7). g-i, Food and water intake (g), O2 consumption (VO2) and CO2 production (VCO2) (h), and respiratory quotient (RQ) and energy expenditure (EE) (i) measured in mice in SD after being in metabolic cage analysis for 48 hours. g-i, Top panels represent values normalized by body weight. Bottom panels represent values unnormalized (n≥7). Signification assessed by unpaired t-test. *, P <0.05; **, P <0.01; ***, P <0.001; ****, P <0.0001. Each point represents a biological replicate. Data are the mean ± SEM.
Extended Data Fig. 4 |
Extended Data Fig. 4 |. Lipid profile and liver fatty acid oxidation is normal in mice lacking Fgr.
a, Representative H&E staining of WAT paraffin sections of the indicated genotypes in SD. Scale bars corresponds to 500 μm. b, Representative ORO staining of OCT liver sections of the indicated genotypes in SD. Scale bars corresponds to 100 μm. c, Quantification of ORO staining performed as in b). d, Serum lipid profile for triglycerides (upper panel), HDL (middle panel) and total cholesterol (bottom panel) in WT and Fgr KO mice in NNT WT or KO background fed in SD for 8 weeks (in NNT WT background, n≥12; in NNT KO background n≥9). e, Enzymatic activities of citrate synthase (CS, upper panel), short chain 3-hydroxyacyl CoA dehydrogenase (SCHA) versus CS (middle panel) and isocitrate dehydrogenase (ISDH) versus CS (bottom panel) in the different mouse genotypes in SD measured by spectrophotometry (n≥10). f, Ketone bodies (KB, upper panel), Glucose (middle panel), and protein (bottom panel) concentration in urine in the indicated mouse genotypes in SD (for glucose and protein, n≥8, for KB, n≥14). Signification assessed by t-test *, P <0.05; **, P <0.01; ***; P <0.001. Each point represents a biological replicate. Data are the mean ± SEM.
Extended Data Fig. 5 |
Extended Data Fig. 5 |. BM transplantation weight under high fat diet.
a, Weight over time in mice under high fat diet after BM transplantation of the indicated genotypes (n = 16). b, Analysis of OCR non normalized by cell counts in WAT infiltrated macrophages isolated from mice fed high fat diet, using glucose oxidation (GO: glucose plus pyruvate plus glutamine) or fatty acid oxidation or (FAO: palmitoyl-CoA + carnitine) as substrates in the assay media (n = 3). c, Weight over time in WT mice under high fat diet with and without NAC supplementation in the drinking water (n = 10). d, Weight over time in mito-catalase (mCAT) BM grafted mice under high fat diet (n = 9). One-way ANOVA with Sidak correction for multiple comparisons. *, P <0.05; **, P <0.01; ***, P <0.001; ****, P <0.0001. Each point represents a biological replicate. Data are the mean ± SEM.
Extended Data Fig. 6 |
Extended Data Fig. 6 |. Loss of Fgr prevents proinflammatory WAt macrophage infiltration induced by HFD.
a, Representative flow cytometry dot plots of WAT-infiltrated CD11c+ (M1-like, left panel), CD206+ (M2-like) and inflammatory double negative (right panel) macrophages form WT and Fgr-deficient (NNTKO in both cases) mice fed with standard diet (SD) or high-fat diet (HFD). b, Analysis of total amount of WAT-infiltrated inflammatory CD11c+ and double negative macrophages on HFD fed mice in WT and FgrKO mice. c, d, Representative flow cytometry histograms (c) and quantification (d) of iNOS expression in the indicated ATM populations. e, f, Representative flow cytometry histograms (c) and quantification (d) of MerTK expression in the indicated ATM populations. One-way ANOVA with Sidak correction for multiple comparisons. **, P <0.01; ****, P <0.0001. Each point represents a biological replicate. Data are the mean ± SEM.
Fig. 1 |
Fig. 1 |. Lack of Fgr prevents proinflammatory M1-like polarization of BMDMs.
a–c, BMDMs from WT and Fgr-deficient (FgrKO) mice untreated or treated with LPS + IFN-γ in the presence, where indicated, of antioxidants NAC, MitoQ, and complex II inhibitors NPA, thenoyltrifluoroacetone (TTFA) and dimethylmalonate (dMM) were analysed by flow cytometry for MHC class II (a; data are from n = 8 independent experiments) and NOS2 (b; n = 8 experiments) and by ELISA for IL-1β (c; n = 5). d, Representative Seahorse profile of the oxygen consumption rate (OCR) of BMDMs from WT and FgrKO mice treated with LPS + IFN-γ for 16 h (overnight, o/n; left) or 4 h (right) normalized by cell number (n = 7 for untreated or n = 4 for treated). e, Complex II activity measured by spectrophotometry in lysates from BMDMs treated as in d (n = 4); IU, international units. fh, Representative oxygen consumption analysis of IFN-γ-primed (pIFN-γ) BMDMs from WT (upper) and FgrKO (lower) mice treated with LPS (f), LPS + NPA (g) and LPS + NAC (h) at the start of the Seahorse assay (n = 3). *, P < 0.05; **, P < 0.01; ***, P < 0.001; ****, P < 0.0001. Statistical analyses were performed using one-way ANOVA and Tukey’s post hoc test (ac and e). Each point represents a biological replicate. Data are shown as the mean ± s.e.m.
Fig. 2 |
Fig. 2 |. Lack of Fgr prevents At-CM polarization of BMDMs.
a–c, BMDMs from WT and FgrKO mice were cultured o/n in the presence of AT-CM, LPS or LPS + IFN-γ; iNOS, Lysotracker and BODIPY were determined by flow cytometry. Representative histograms of iNOS, Lysotracker and BODIPY (a). Red, FgrKO; black, control. Mean fluorescence intensity (MFI) quantifications (bd). e, Representative images of BMDMs treated as indicated o/n and subsequently stained with DAPI (blue) and BODIPY 493 (green). Scale bars: 20 μm. f, Lipid droplet quantification in BMDMs after polarization in the indicated conditions. a–d, Data are from n = 8 independent experiments; e and f, n = 5 experiments. For image analysis, more than 100 cells were analysed per experiment and averaged for quantification purposes. *, P < 0.05; **, P < 0.01; ***, P < 0.001; ****, P < 0.0001. Statistical analyses were performed using two-way ANOVA and Tukey’s post hoc test. Each point represents a biological replicate and data are shown as the mean ± s.e.m.
Fig. 3 |
Fig. 3 |. Fgr-deficient mice are protected against HFD-induced obesity.
a, Weight gain of WT and FgrKO mice in the NNTWT or NNTKO background fed a HFD for 8 weeks (NNTWT background, n = 11; NNTKO background; n = 26); significance was assessed by linear regression. b, Magnetic resonance imaging showing body composition and quantification of lean and fat mass among the indicated genotypes (n = 3–5). Scale bars: 1 cm. c,d, Glucose levels in serum samples following a glucose tolerance test (GTT) (c) and an insulin tolerance test (ITT) (d) in mice fed a HFD for 10 weeks (NNTWT background, n = 8; NNTKO background, n = 20). Significance was assessed by two-way ANOVA and Tukey’s post hoc test; NS, not significant. e, Basal insulin (upper) and C-peptide (bottom) levels in WT and FgrKO mice in the NNTWT or NNTKO background that were fed a HFD for 8–10 weeks; significance was assessed by one-way ANOVA and Tukey’s post hoc test. f, Fold induction of insulin (upper) and C-peptide (bottom) compared to basal level after glucose injection (insulin release assay) in WT (solid circles) and FgrKO (open triangles) mice in the NNTWT or NNTKO background that were fed a HFD (insulin levels in d and e: NNTWT background, n = 7; NNTKO background, n ≥ 18; C-peptide levels, n = 7). g, Food (upper) and water (bottom) intake by mice assessed in metabolic cages for 48 h; significance was assessed by one-way ANOVA and Tukey’s post hoc test. h,i, Consumed O2 volume (VO2) normalized either by lean body mass (LBM; upper) or total body weight (lower; n = 6; h) and expired CO2 volume (VCO2) of mice in metabolic cages for 48 h (n = 6; i); significance was assessed by one-way ANOVA and Tukey’s post hoc test. j,k, Respiratory quotient (RQ) (j) and energy expenditure (EE) (k) measured in mice in metabolic cages for 48 h (n = 6); significance was assessed by one-way ANOVA and Tukey’s post hoc test; *, P < 0.05; **, P < 0.01; ***, P < 0.001; and ****, P < 0.0001. Each point represents a biological replicate. Data are shown as the mean ± s.e.m.
Fig. 4 |
Fig. 4 |. Lack of Fgr prevents liver steatosis through increased FAO in a HFD.
a, Representative haematoxylin and eosin (H&E) staining of WAT paraffin sections of the indicated genotypes in a HFD (left); scale bars: 500 μm. Representative Oil red O (ORO) staining of OCT-embedded liver sections of the indicated genotypes in a HFD (right); scale bars: 100 μm. b, Quantification of ORO-positive stained area versus total liver area in OCT liver sections of the indicated genotypes in the HFD group (n = 6). c, Serum lipid profile for triglycerides (TG; upper), total cholesterol (Chol; middle) and HDL (bottom) in WT and FgrKO mice in the NNTWT or NNTKO background fed a HFD for 8 weeks (NNTWT background, n = 9; NNTKO background, n = 16). d, Enzymatic activities of citrate CS (upper), short chain 3-hydroxyacyl CoA dehydrogenase (SCHA) versus CS (middle) and isocitrate dehydrogenase (ISDH) versus CS (bottom) measured by spectrophotometry in the different mouse genotypes in HFD (n = 10); AU, arbitrary units. e, Ketone bodies (KB, upper), glucose (middle) and protein (bottom) concentration in urine in the indicated mouse genotypes in the HFD group (glucose and protein, n = 4; KB, n = 8). *, P < 0.05; **, P < 0.01; ***, P < 0.001; and ****, P < 0.0001; significance was assessed by one-way ANOVA test and Tukey’s post hoc test. Each point represents a biological replicate. Data are shown as the mean ± s.e.m.
Fig. 5 |
Fig. 5 |. Lack of Fgr in BM-derived cells protects from HFD-induced liver steatosis.
a, Schematic indicating the strategy for BM transplantation and HFD treatment, and representative histogram showing full reconstitution of CD45.1 host with CD45.2 donor BM. b, Weight gain over time in HFD-fed mice after BM transplantation of the indicated genotypes (n = 16). c, GTT of BM-transplanted mice as indicated in HFD (n = 9). d, Basal insulin levels in BM-transplanted mice as indicated for the HFD group (n = 10). e, Representative ORO staining of OCT liver sections of the indicated genotypes in HFD. Scale bars: 1 mm (low magnification view) and 100 μm (insets). Quantification of ORO-positive stained area versus total liver area in OCT liver sections of the indicated genotypes in the HFD group (n = 8, right bottom). f, Spectrophotometric enzymatic activities of CS (upper), SCHA versus CS (middle) and ISDH versus CS (bottom) in the different mouse genotypes in the HFD group (n = 8). g, Analysis of leptin levels in the serum of BM-transplanted mice as indicated in the HFD group (n ≥ 6). h, Analysis of ketone bodies (KB) in the urine of BM-transplanted mice as indicated in the HFD group (n ≥ 7). Significance was assessed by linear regression in b and one-way ANOVA with Sidak’s correction for multiple comparisons in dh. *, P < 0.05; ***, P < 0.001; and ****, P < 0.0001. Each point represents a biological replicate. Data are shown as the mean ± s.e.m.
Fig. 6 |
Fig. 6 |. Loss of Fgr in immune cells prevents proinflammatory WAt macrophage infiltration.
a, Flow cytometry dot plots are representative of WAT-infiltrated CD11c+ (M1-like, left) and CD206+ (M2-like, right) macrophages (CD64+F4/80+) fed a SD or a HFD in WT and FgrKO mice. b,c, Analysis of the total amount (b) and percentage (c) of WAT-infiltrated CD11c+ and CD206+ macrophages in SD- and HFD-fed WT and FgrKO mice. d,e, Representative flow cytometry dot plots (d) and quantification (e) of WAT-infiltrated CD11c+ and CD206+ macrophages in BM-transplanted mice on a HFD. f, Analysis of OCR in WAT-infiltrated macrophages isolated from mice fed a HFD, using glucose oxidation (GO: glucose + pyruvate + glutamine) or FAO (FAO: palmitoyl-CoA + carnitine) as substrates in the assay medium (n = 3). OCR was normalized by cell number. Port injections are indicated. In c: SD, n = 3; HFD, n = 16. In e and f: n = 6. Significance was assessed using one-way ANOVA with Sidak’s correction for multiple comparisons (b, c and e). *, P < 0.05; **, P < 0.01; ***, P < 0.001; ****, P < 0.0001. Each point represents a biological replicate. Data are shown as the mean ± s.e.m.
Fig. 7 |
Fig. 7 |. ROS scavenging in the immune cells recapitulates Fgr KO phenotype.
a, Weight gain over time in WT mice fed a HFD with and without NAC supplementation in the drinking water (n = 10). b,c, In vivo glucose metabolism measured by GTT (b) and basal insulin levels (c) in WT HFD-fed mice untreated or treated with NAC as indicated (n = 9). d, Representative ORO staining (left) and quantification of ORO-positive area versus total liver area (right) in OCT liver sections of the indicated treatments in the HFD group (n = 9). Scale bars: 1 mm. e, Enzymatic activities of CS (upper), SCHA versus CS (middle) and ISDH versus CS (bottom) of WT HFD-fed mice untreated or treated with NAC as indicated (n = 6). f, Ketone body analysis in the urine of WT mice in the indicated conditions (n = 9). g, Analysis of WAT-infiltrated CD11c+ and CD206+ macrophages (CD64+F4/80+) in WT mice under different conditions (n = 5). h–k, mCAT BM-grafted mice were analysed on a HFD. h, Weight gain (n = 9). i, Glucose levels in serum after GTT (n = 13). j, Representative ORO staining (scale bars: 1 mm) and quantification of positive-stained area versus total liver area in OCT liver sections (n = 6). Since mCAT BM-grafted mice were analysed on a HFD in the same experiment along with the indicated BM-grafted mice described above, the data in Fig. 5 are displayed for reference. k, Analysis of WAT-infiltrated CD11c+ and CD206+ in HFD treatment in the indicated BM-transplanted mice (n = 6). Significance was assessed using linear regression in a and h and a t-test in cg. One-way ANOVA with Sidak’s correction for multiple comparisons was used in j and k. *, P < 0.05; ***, P < 0.001; and ****, P < 0.0001. Each point represents a biological replicate. Data are shown as the mean ± s.e.m.
Fig. 8 |
Fig. 8 |. Fgr expression in obese mice and humans.
a,b, Biweight midcorrelation (bicor) comparing the expression of Fgr between peritoneal (a) or adipose (b) M1 and M2 macrophages. c, Analysis of Fgr expression evolution in the HMDP with respect to the indicated parameters. NMR, nuclear magnetic resonance. d, Analysis of Fgr expression evolution in the METSIM cohort with respect to the indicated obesity-related traits (BMI, percentage fat mass and body weight). HOMA, homeostasis model assessment.

References

    1. Xu H. et al. Chronic inflammation in fat plays a crucial role in the development of obesity-related insulin resistance. J. Clin. Invest 112, 1821–1830 (2003). - PMC - PubMed
    1. Weisberg SP et al. Obesity is associated with macrophage accumulation in adipose tissue. J. Clin. Invest 112, 1796–1808 (2003). - PMC - PubMed
    1. Osborn O. & Olefsky JM The cellular and signaling networks linking the immune system and metabolism in disease. Nat. Med 18, 363–374 (2012). - PubMed
    1. Virtue S. & Vidal-Puig A. It’s not how fat you are, it’s what you do with it that counts. PLoS Biol. 6, e237 (2008). - PMC - PubMed
    1. Curat CA et al. From blood monocytes to adipose tissue-resident macrophages: induction of diapedesis by human mature adipocytes. Diabetes 53, 1285–1292 (2004). - PubMed

Publication types

MeSH terms