

GlaucoMap - Distribution of Glaucoma Surgical Procedures in the United States
- PMID: 32943836
- PMCID: PMC7473985
- DOI: 10.2147/OPTH.S257361
GlaucoMap - Distribution of Glaucoma Surgical Procedures in the United States
Abstract
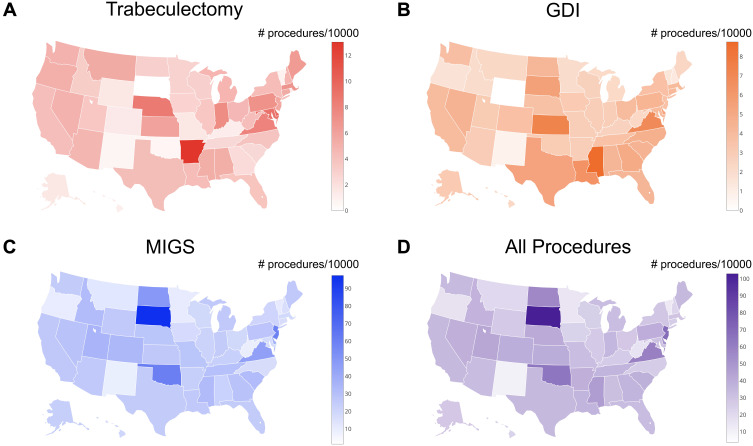
Purpose: To understand the distribution of trabeculectomies, glaucoma drainage implants (GDI) and micro-invasive glaucoma surgeries (MIGS) performed in the United States through geospatial mapping.
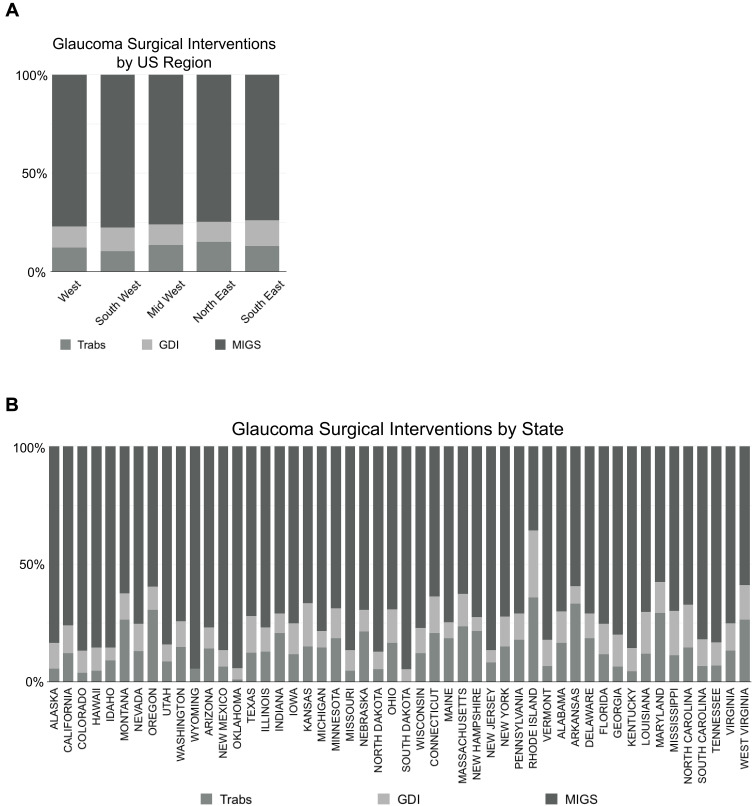
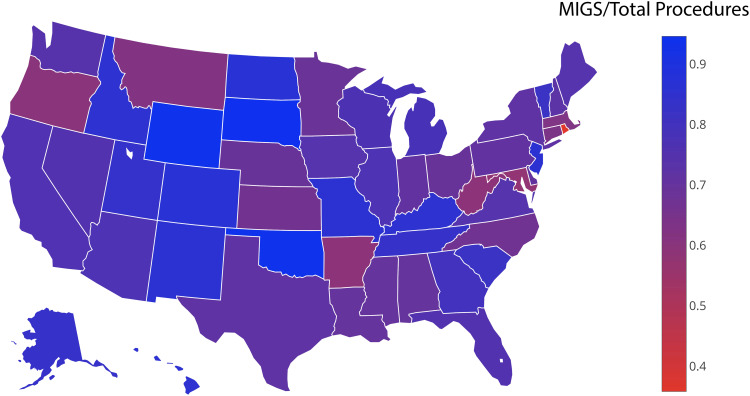
Methods: We performed an observational cohort study to evaluate glaucoma surgeries in patients age ≥65. The most recently released data from Centers for Medicare Part B Carrier Summary Files were queried to determine the number of glaucoma surgeries performed per state during the year of 2017. We created choropleth maps, titled "GlaucoMap", to characterize the rates of various surgeries performed across the United States, defined as the number of procedures performed per 10,000 individuals. A chi-squared analysis was further used to evaluate differences in surgical preferences across geographic region. Standardized residuals (SR) were calculated to determine regional influences on surgical distribution.
Results: There were 174,788 glaucoma surgeries performed: 22,862 trabeculectomies (13.1%), 19,991 GDI (11.4%) and 131,935 (75.5%) MIGS. The Northeast had the highest trabeculectomy rate, GDI was highest in the Southeast and MIGS were highest in the Southwest. There was a statistically significant difference in proportional use of conventional surgeries versus MIGS across various regions in the United States (p < 0.0001). Given the high trabeculectomy and GDI rates and relatively low MIGS adoption in the Southeast, we observed a +7.03 SR for conventional surgeries and -4.01 SR for MIGS. The Southwest and Western states had the highest MIGS rate and contributed +3.29 and +3.24 SR toward disproportional MIGS preference, respectively. The preference for conventional surgeries in the Northeast (SR = +2.93) and MIGS in the Midwest (SR = +0.99) also contribute to the overall differences in glaucoma surgeries across the United States.
Conclusion: GlaucoMap is useful for visualizing the distribution of glaucoma surgeries in the United States. The heterogeneity in surgical preferences points to regional differences in glaucoma management.
Keywords: GDI; MIGS; glaucoma; heatmaps; trabeculectomies.
© 2020 Ma et al.
Conflict of interest statement
Christopher Teng reports consulting fees from Neomedix and New World Medical, outside the submitted work. The authors have no other potential conflicts of interest to disclose.
Figures
References
Grants and funding
LinkOut - more resources
Full Text Sources
Research Materials
