

Greater mortality variability in the United States in comparison with peer countries
- PMID: 32943979
- PMCID: PMC7494211
- DOI: 10.4054/demres.2020.42.36
Greater mortality variability in the United States in comparison with peer countries
Abstract
Background: Over the past several decades, US mortality declines have lagged behind other high-income countries. However, scant attention has been devoted to how US mortality variability compares with other countries.
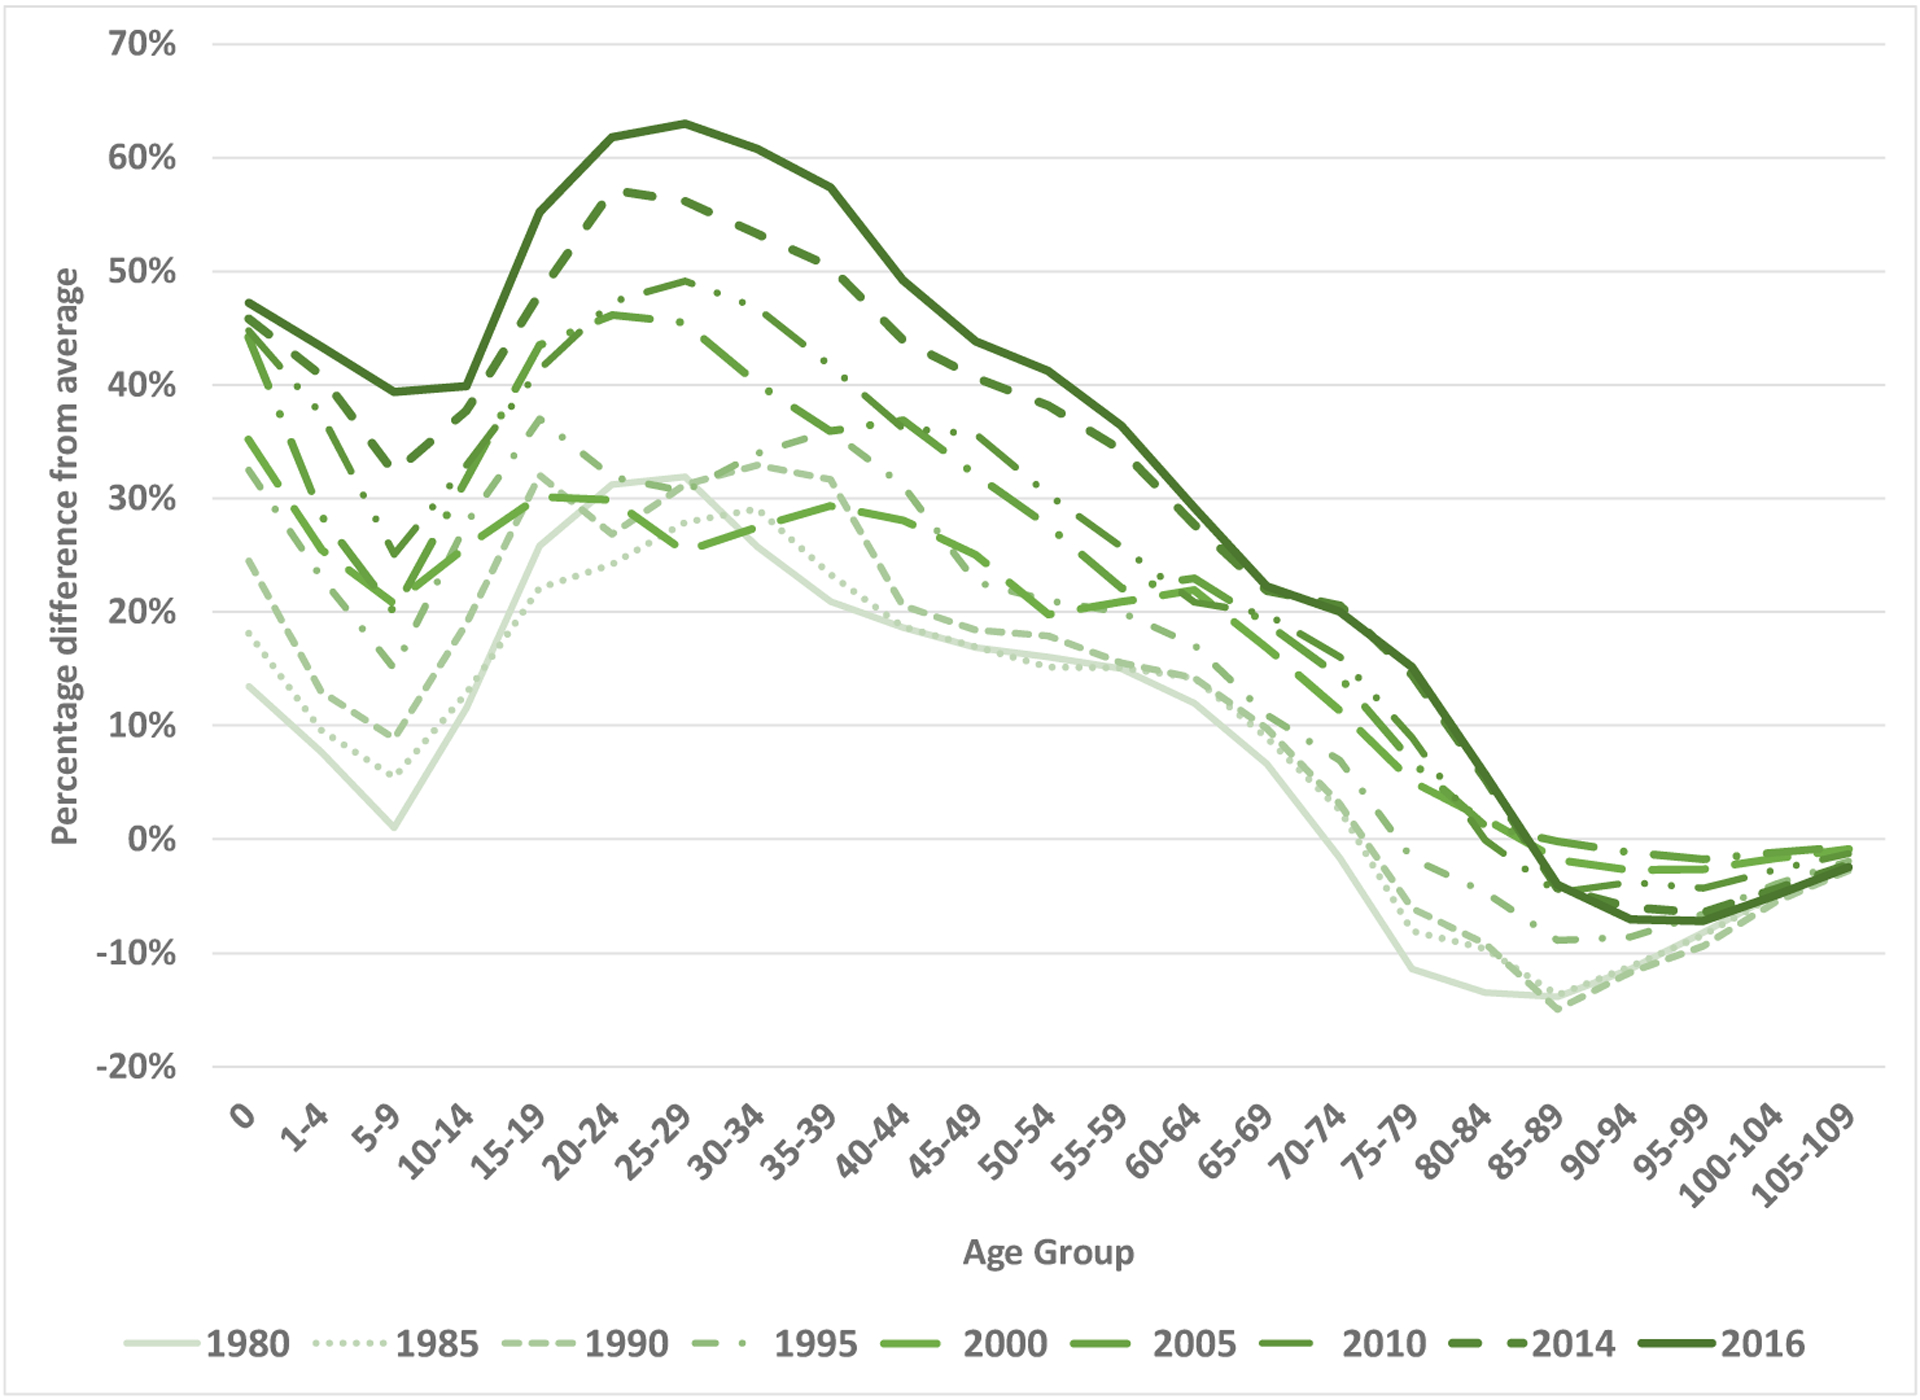
Objective: We examine trends in mortality and mortality variability in the US and 16 peer countries from 1980 through 2016.
Methods: We employ the Human Mortality Database and demographic techniques - with a focus on patterns in the interquartile (IQR), interdecile (IDR), and intercentile (ICR) ranges of survivorship - to better understand US mortality and mortality variability trends in comparative perspective.
Results: Compared to other high-income countries, the US: (1) mortality ranking has slipped for nearly all age groups; (2) is losing its old age mortality advantage; (3) has seen growth in relative age-specific mortality gaps from infancy through midlife; and (4) exhibits greater concentrations of deaths from infancy through adulthood, resulting in much greater mortality variability.
Conclusions: We contribute to calls for renewed attention to the relatively low and lagging US life expectancy. The ICR draws particular attention to the comparatively high US early and midlife mortality.
Contribution: We find comparatively high variability in US mortality. Further reductions in early and midlife mortality could diminish variability, reduce years of potential life lost, and increase life expectancy. Consistent with previous research, we encourage policymakers to focus on reducing the unacceptably high early and midlife mortality in the US. And we urge researchers to more frequently monitor and track mortality variation in conjunction with mortality rates and life expectancy estimates.
Figures


References
-
- Edwards HS (2020). The Trump administration fumbled its initial response to coronavirus. Is there enough time to fix it? Time March 19, 2020. https://time.com/5805683/trump-administration-coronavirus/.
Grants and funding
LinkOut - more resources
Full Text Sources
Miscellaneous