. 2020 Aug 26;9(1):1807674.
doi: 10.1080/20013078.2020.1807674.

Experimental artefacts can lead to misattribution of bioactivity from soluble mesenchymal stem cell paracrine factors to extracellular vesicles

Affiliations

Experimental artefacts can lead to misattribution of bioactivity from soluble mesenchymal stem cell paracrine factors to extracellular vesicles

Thomas E Whittaker et al. J Extracell Vesicles. .

Abstract

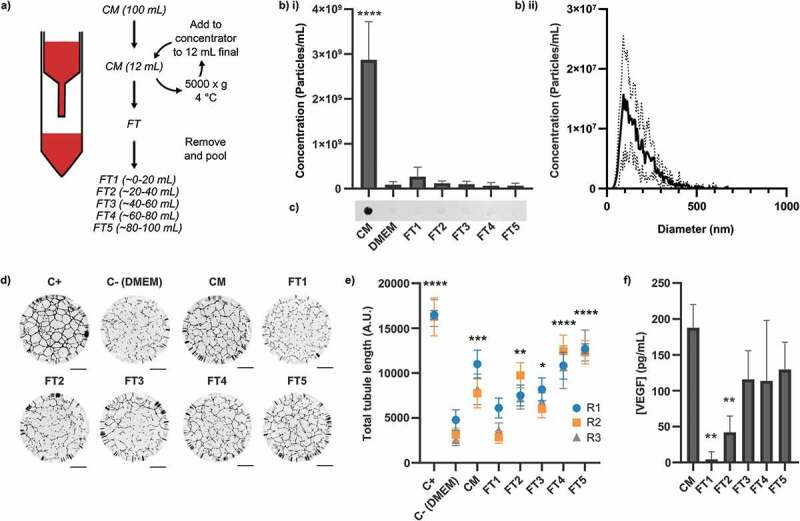
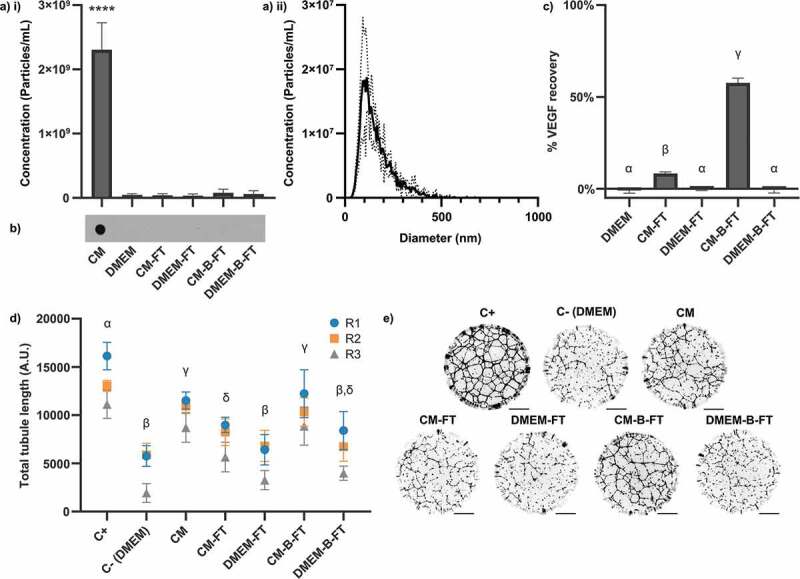
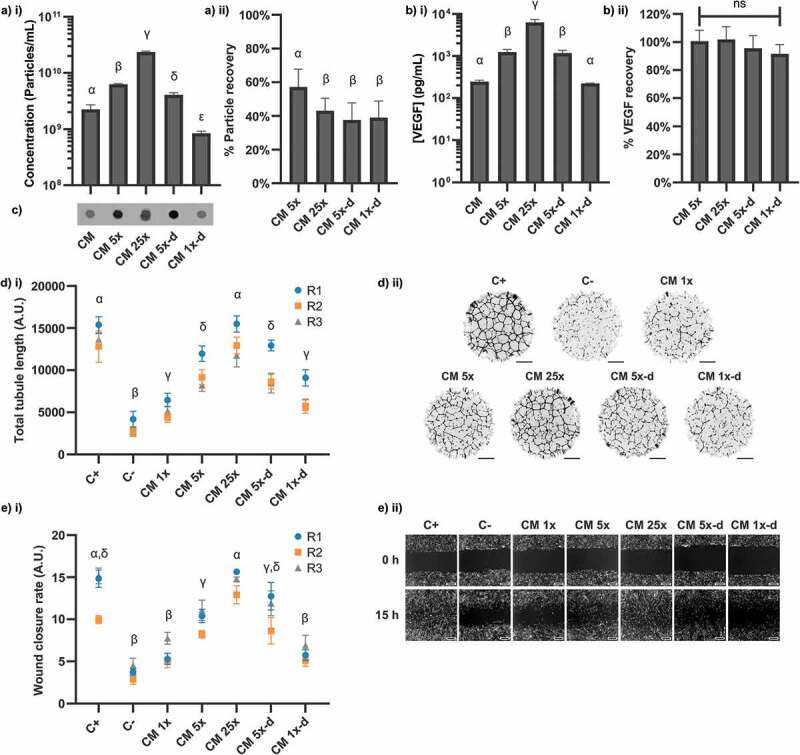
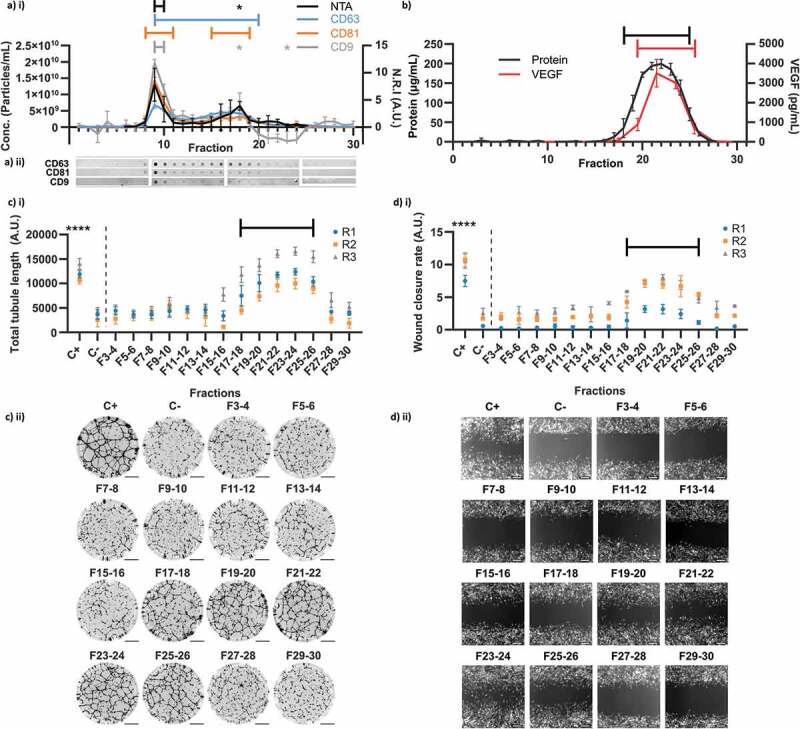
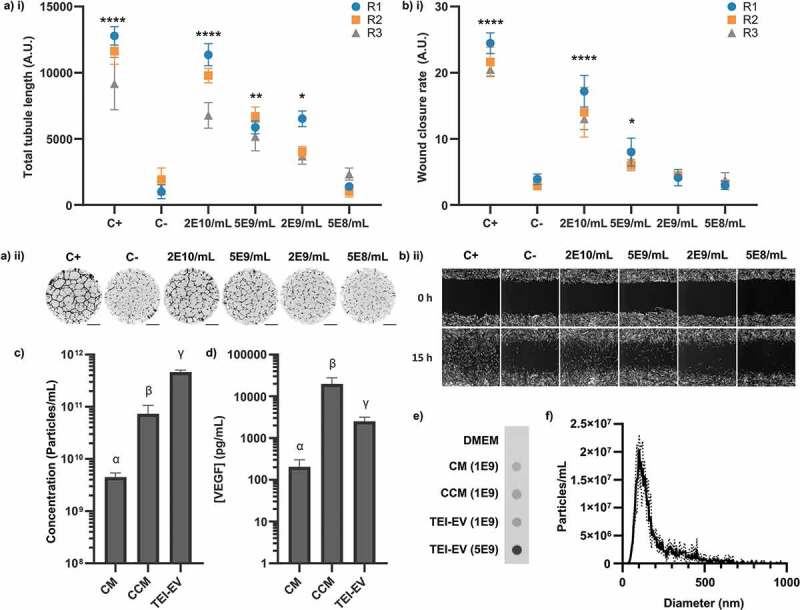
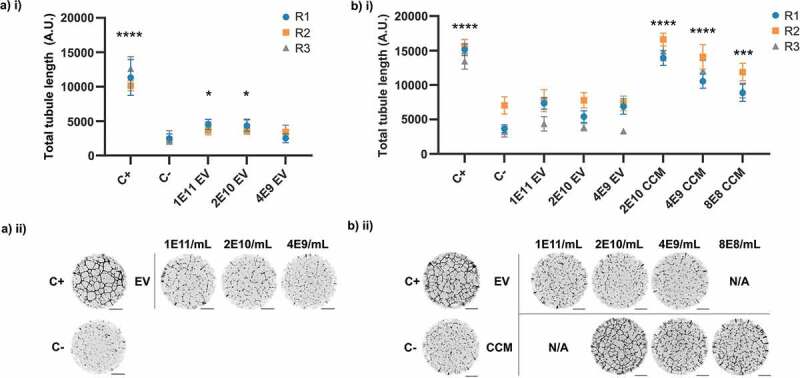
It has been demonstrated that some commonly used Extracellular Vesicle (EV) isolation techniques can lead to substantial contamination with non-EV factors. Whilst it has been established that this impacts the identification of biomarkers, the impact on apparent EV bioactivity has not been explored. Extracellular vesicles have been implicated as critical mediators of therapeutic human mesenchymal stem cell (hMSC) paracrine signalling. Isolated hMSC-EVs have been used to treat multiple in vitro and in vivo models of tissue damage. However, the relative contributions of EVs and non-EV factors have not been directly compared. The dependence of hMSC paracrine signalling on EVs was first established by ultrafiltration of hMSC-conditioned medium to deplete EVs, which led to a loss of signalling activity. Here, we show that this method also causes depletion of non-EV factors, and that when this is prevented proangiogenic signalling activity is fully restored in vitro. Subsequently, we used size-exclusion chromatography (SEC) to separate EVs and soluble proteins to directly and quantitatively compare their relative contributions to signalling. Non-EV factors were found to be necessary and sufficient for the stimulation of angiogenesis and wound healing in vitro. EVs in isolation were found to be capable of potentiating signalling only when isolated by a low-purity method, or when used at comparatively high concentrations. These results indicate a potential for contaminating soluble factors to artefactually increase the apparent bioactivity of EV isolates and could have implications for future studies on the biological roles of EVs.

Keywords: Extracellular vesicles; angiogenesis; contamination; exosomes; mesenchymal stem cell; microvesicles; paracrine effect; polymer precipitation; purification; size exclusion.


Conflict of interest statement

No funding agency was involved in the study design, data collection, data management, analysis, interpretation or preparation of the manuscript. No conflicts of interest are declared.

Figures

Figure 1.
Figure 1.
Contents and signalling properties of hMSC-conditioned medium after 100 kDa ultrafiltration. Media (CM) was passed through a 100 kDa membrane and collected in sequential ~20 mL batches (FT1-5), as described in the main text. (a) Schematic of experimental workflow. CM = Conditioned medium, FT = Flowthrough. (b) NTA measurements of i) concentration and ii) size distribution (of CM sample), N = 3, n = 3 x 60s videos, mean ± SD shown. Particles were only detected in CM (1-way within-subjects ANOVA and post-hoc Dunnett’s test vs DMEM control). (c) Dot blots against CD63. CD63 was only detected in CM. Independently prepared replicate samples were blotted onto the same membrane and analysed simultaneously (N = 3, representative blot shown). (d) Representative whole-well images of tubule structures. Images inverted for clarity. Scale bar = 1 mm. (e) Quantification of total tubule length in tubule formation assay. All samples besides FT1 had a greater proangiogenic activity than DMEM (N = 3, n = 12, mean ± SD of n shown for each N (replicates 1–3, R1-3), 1-way within-subjects ANOVA and post-hoc Dunnett’s test vs DMEM control). (f) ELISA against VEGF. VEGF was reduced relative to the level in CM in FT1 and FT2 only (N = 3, n = 2, mean ± SD shown, 1-way within-subjects ANOVA and post-hoc Dunnett’s test vs CM). *: p < 0.05, **: p < 0.01, ***: p < 0.001, ****: p < 0.0001.
Figure 2.
Figure 2.
Effects of membrane surface BSA-blocking on 100 kDa ultrafiltration of hMSC-CM. Membranes were either BSA-blocked (-B-FT) or left unblocked (-FT) prior to filtration of 10 mL of CM or DMEM. (a) NTA measurements (3 x 60 s videos/sample, N = 3, mean ± SD shown) of i) particle concentration and ii) size distribution (of CM sample). Particles were only detected in CM (1-way within-subjects ANOVA and post-hoc Dunnett’s test vs DMEM control). (b) Dot blots against CD63. CD63 was only detected in CM. Independently prepared replicate samples were blotted onto the same membrane and analysed simultaneously (N = 3, representative blot shown). (c) ELISA against VEGF. % recovery of VEGF in CM for each sample is shown (N = 3, n = 2, mean ± SD shown). (d) Quantification of total tubule length in tubule formation assay (N = 3, n = 12, mean ± SD of n shown for each N (replicates 1–3, R1-3)). (e) Representative whole-well images of tubule structures formed in (d). Images inverted for clarity. Scale bar = 1 mm. Samples are significantly different unless they share a letter (p < 0.05, one-way within-subjects ANOVA and post-hoc Tukey’s HSD test).
Figure 3.
Figure 3.
Effects of concentration on contents and signalling properties of hMSC-CM. CM was concentrated 5x against a 3 kDa membrane, then 25x, before subsequent dilution to 5x (5x-d) and 1x (1x-d) concentrations. (a) NTA concentration measurements of samples, expressed as i) absolute concentration values and ii) % recovered from input CM. (N = 3, n = 3 x 60s videos, mean ± SD shown). (b) ELISA against VEGF, expressed as i) absolute concentration values and ii) % recovered from input CM. (N = 3, n = 2, mean ± SD shown). (c) Anti-CD63 dot blots. Independently prepared replicate samples were blotted onto the same membrane and analysed simultaneously. (d) i) Quantification of total tubule length in tubule formation assay (N = 3, n = 12, mean ± SD of n shown for each N (replicates 1–3, R1-3)). (d) ii) Representative whole-well images of tubule structures formed in i). Images inverted for clarity. Scale bar = 1 mm. (e) i) Quantification of wound closure rate for each condition (N = 3, n = 3, mean ± SD shown for each N (replicates 1–3, R1-3)). (e) ii) Representative images of scratch wounds for each condition are shown for t = 0 h and t = 15 h. Scale bar = 100 μm. Samples are significantly different unless they share a letter (p < 0.05, one-way within-subjects ANOVA and post-hoc Tukey’s HSD test). Where plotted on a logarithmic axis, data were log10-transformed prior to statistical analysis.
Figure 4.
Figure 4.
Analytical Size Exclusion Chromatography of hMSC-CM. (a) EV content of fractions evaluated by particle concentration measured by NTA i) (n = 3 x 60s videos, N = 3) and dot blots against CD63, CD81 and CD9 (N = 3, quantified by Normalised Relative Intensity, N.R.I, as in methods). (a) ii) Representative dot blot images as used for quantification in a) i) (images re-cut to align with graph). (b) Total protein and VEGF concentrations of each fraction (VEGF measured on pooled adjacent pairs and plotted at mid-point). (c) i) Quantification of total tubule length in tubule formation assay for pooled adjacent fraction pairs (N = 3, n = 6, mean ± SD of n shown for each N (replicates 1–3, R1-3)). (c) ii) Representative whole-well images of tubule structures formed in C i). Images inverted for clarity. Scale bar = 1 mm. (d) i) Quantification of wound closure rate for pooled adjacent fraction pairs (N = 3, n = 3, mean ± SD shown for each N (replicates 1–3, R1-3)). (d) ii) Representative images of scratch wounds for each fraction pair are shown for t = 15 h (endpoint). Scale bar = 100 μm. * and brackets: p < 0.05, **: p < 0.01, ***: p < 0.001, ****: p < 0.0001, (one-way within-subjects ANOVA and post-hoc Dunnett’s test vs earliest measured fraction/s or negative control (NTA: F6, DB: F1, Total protein: F1, VEGF: F7-8, Tubule length: C-, Wound Closure Rate: C-)).
Figure 5.
Figure 5.
Biological activity of TEI-isolated hMSC-EVs. (a) i) Quantification of total tubule length in tubule formation assay stimulated by different TEI-EV concentrations. (N = 3, n = 12, mean ± SD of n shown for each N (replicates 1–3, R1-3). (a) ii) Representative whole-well images of tubule structures formed in (a) i). Images inverted for clarity. Scale bar = 1 mm. (b) i) Quantification of wound closure rate stimulated by different TEI-EV concentrations. (N = 3, n = 3, mean ± SD shown for each N (replicates 1–3, R1-3)). (b) ii) Representative images of scratch wounds are shown for t = 0 and t = 15 h. Scale bar = 100 μm. *: p < 0.05, **: p < 0.01, ***: p < 0.001, ****: p < 0.0001, (one-way within-subjects ANOVA and post-hoc Dunnett’s test vs C-). (c) Particle concentrations (as measured by NTA) in each sample (N = 3, n = 3 x 60s videos, mean ± SD shown). (d) VEGF concentrations (as measured by ELISA) in each sample (N = 3, n = 2, mean ± SD shown). Samples in (c) and (d) are significantly different unless they share a letter (p < 0.05, one-way within-subjects ANOVA and post-hoc Tukey’s HSD test). Where plotted on a logarithmic axis, data were log10-transformed prior to statistical analysis. (e) Dot blot against CD63 for CM, concentrated CM (CCM) and TEI-EV samples Number denotes NTA-quantified particles loaded. (N = 3, one representative image shown). CD63 is present in all samples. (f) Size distribution of TEI-EV as measured by NTA (N = 3, n = 3 x 60s videos, mean ± SD shown) (same dataset as (c)).
Figure 6.
Figure 6.
Pro-angiogenic activity of SEC-isolated EVs. (a) Assay with EVs in PBS. (a) i) Quantification of total tubule length. (N = 3, n = 8–10, mean ± SD of individual replicates shown (replicates 1–3, R1-3)). (a) ii) Representative whole-well images of tubule structures formed in Ai. (b) Assay with EVs in DMEM and CCM. (b) i) Quantification of total tubule length. (N = 3, n = 10, mean ± SD of individual replicates shown (replicates 1–3, R1-3)). (b) ii) Representative whole-well images of tubule structures formed in b) i). *: p < 0.05, **: p < 0.01, ***: p < 0.001, ****: p < 0.0001 (one-way within-subjects ANOVA and post-hoc Dunnett’s test against C-). Scale bar = 1 mm.

References

    1. Thygesen K, Alpert JS, Jaffe AS, et al. Fourth universal definition of myocardial infarction (2018). Eur Heart J. 2018;39(42):3757–3758. - PubMed
    1. George PM, Steinberg GK.. Novel stroke therapeutics: unraveling stroke pathophysiology and its impact on clinical treatments. Neuron. 2015;87(2):297–15. - PMC - PubMed
    1. Hopkins C, Li J, Rae F, et al. Stem cell options for kidney disease. J Pathol. 2009;217(2):265–281. - PubMed
    1. Morigi M. Mesenchymal stem cells are renotropic, helping to repair the kidney and improve function in acute renal failure. J Am Soc Nephrol. 2004;15(7):1794–1804. - PubMed
    1. Choi YH, Kurtz A, Stamm C. Mesenchymal stem cells for cardiac cell therapy. Hum Gene Ther. 2011;22(1):3–17. - PubMed

LinkOut - more resources