. 2020 Nov;61(11):2521-2533.
doi: 10.1111/epi.16680. Epub 2020 Sep 18.

Preictal variability of high-frequency oscillation rates in refractory epilepsy

Affiliations

Preictal variability of high-frequency oscillation rates in refractory epilepsy

Jared M Scott et al. Epilepsia. 2020 Nov.

Abstract

Objective: High-frequency oscillations (HFOs) have shown promising utility in the spatial localization of the seizure onset zone for patients with focal refractory epilepsy. Comparatively few studies have addressed potential temporal variations in HFOs, or their role in the preictal period. Here, we introduce a novel evaluation of the instantaneous HFO rate through interictal and peri-ictal epochs to assess their usefulness in identifying imminent seizure onset.

Methods: Utilizing an automated HFO detector, we analyzed intracranial electroencephalographic data from 30 patients with refractory epilepsy undergoing long-term presurgical evaluation. We evaluated HFO rates both as a 30-minute average and as a continuous function of time and used nonparametric statistical methods to compare individual and population-level differences in rate during peri-ictal and interictal periods.

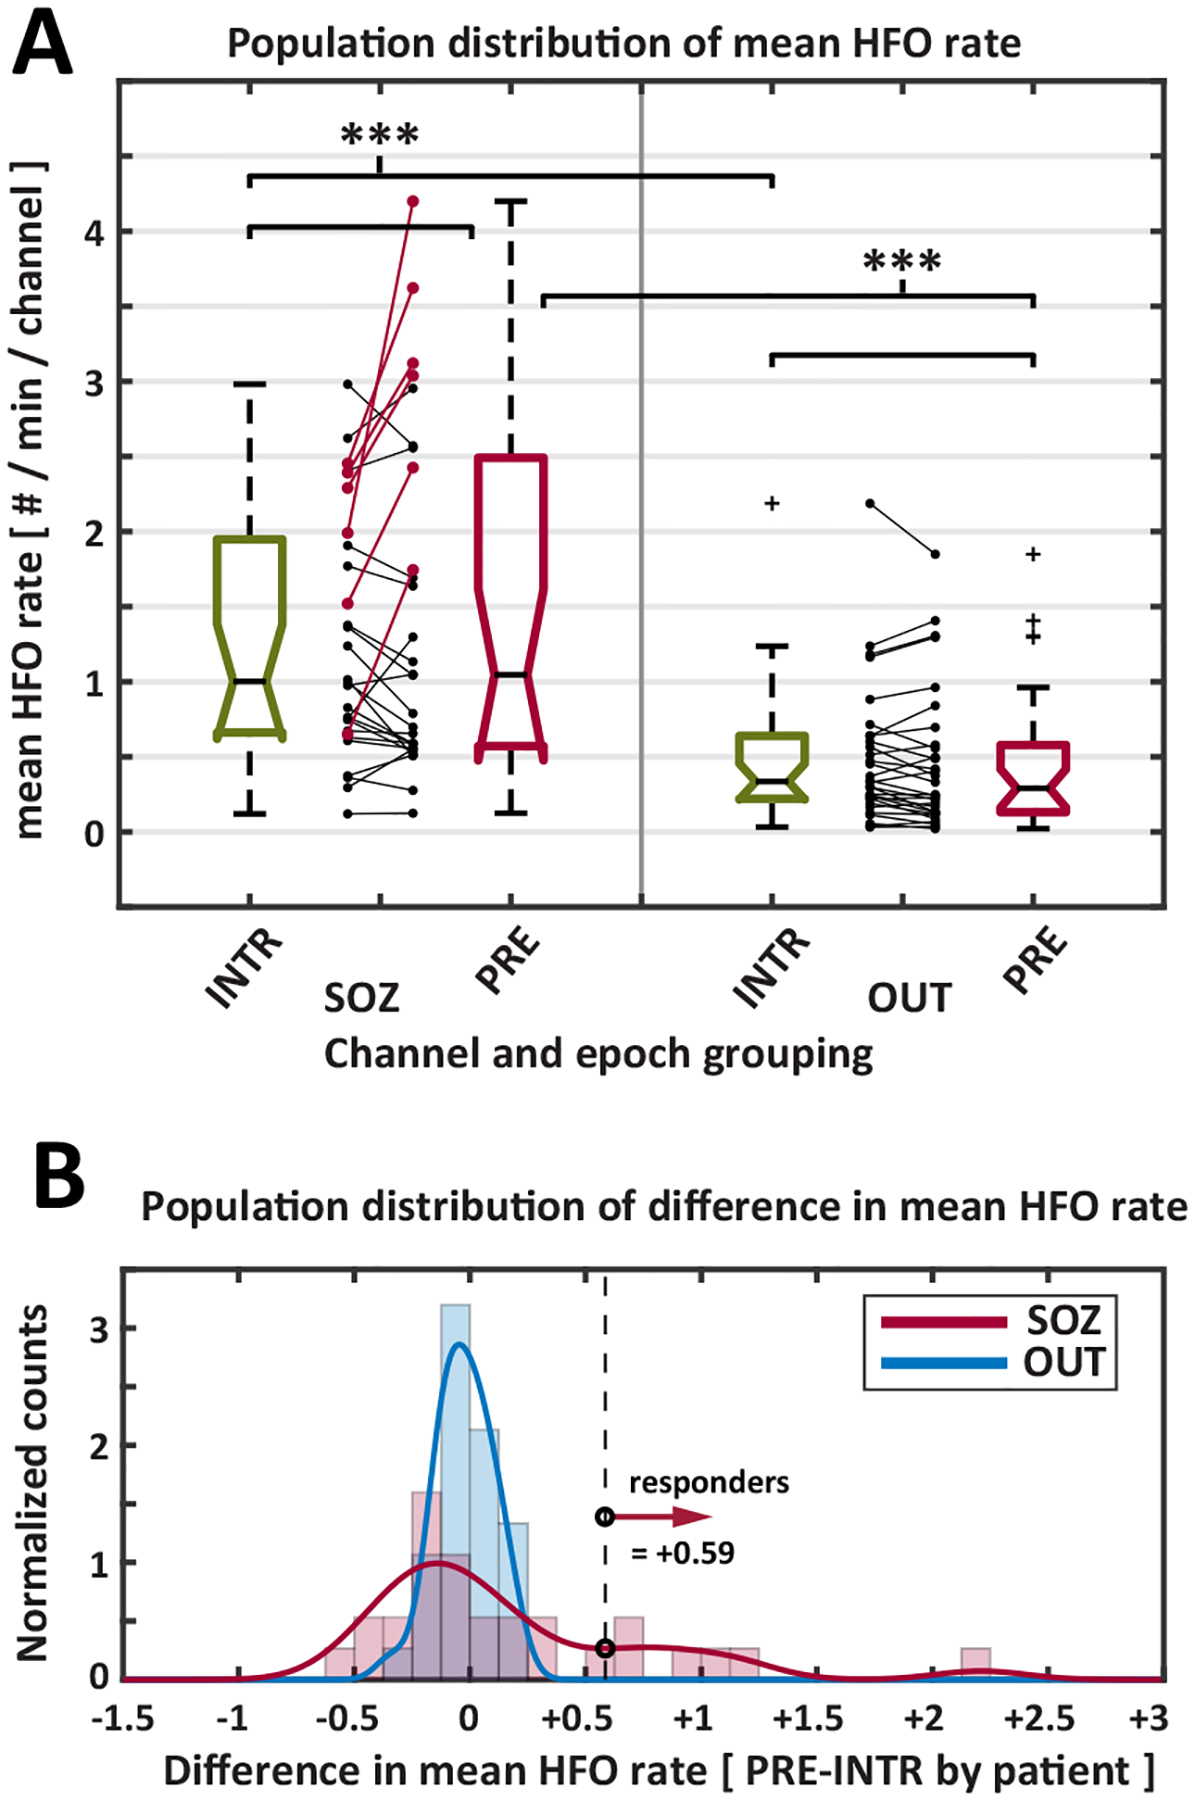
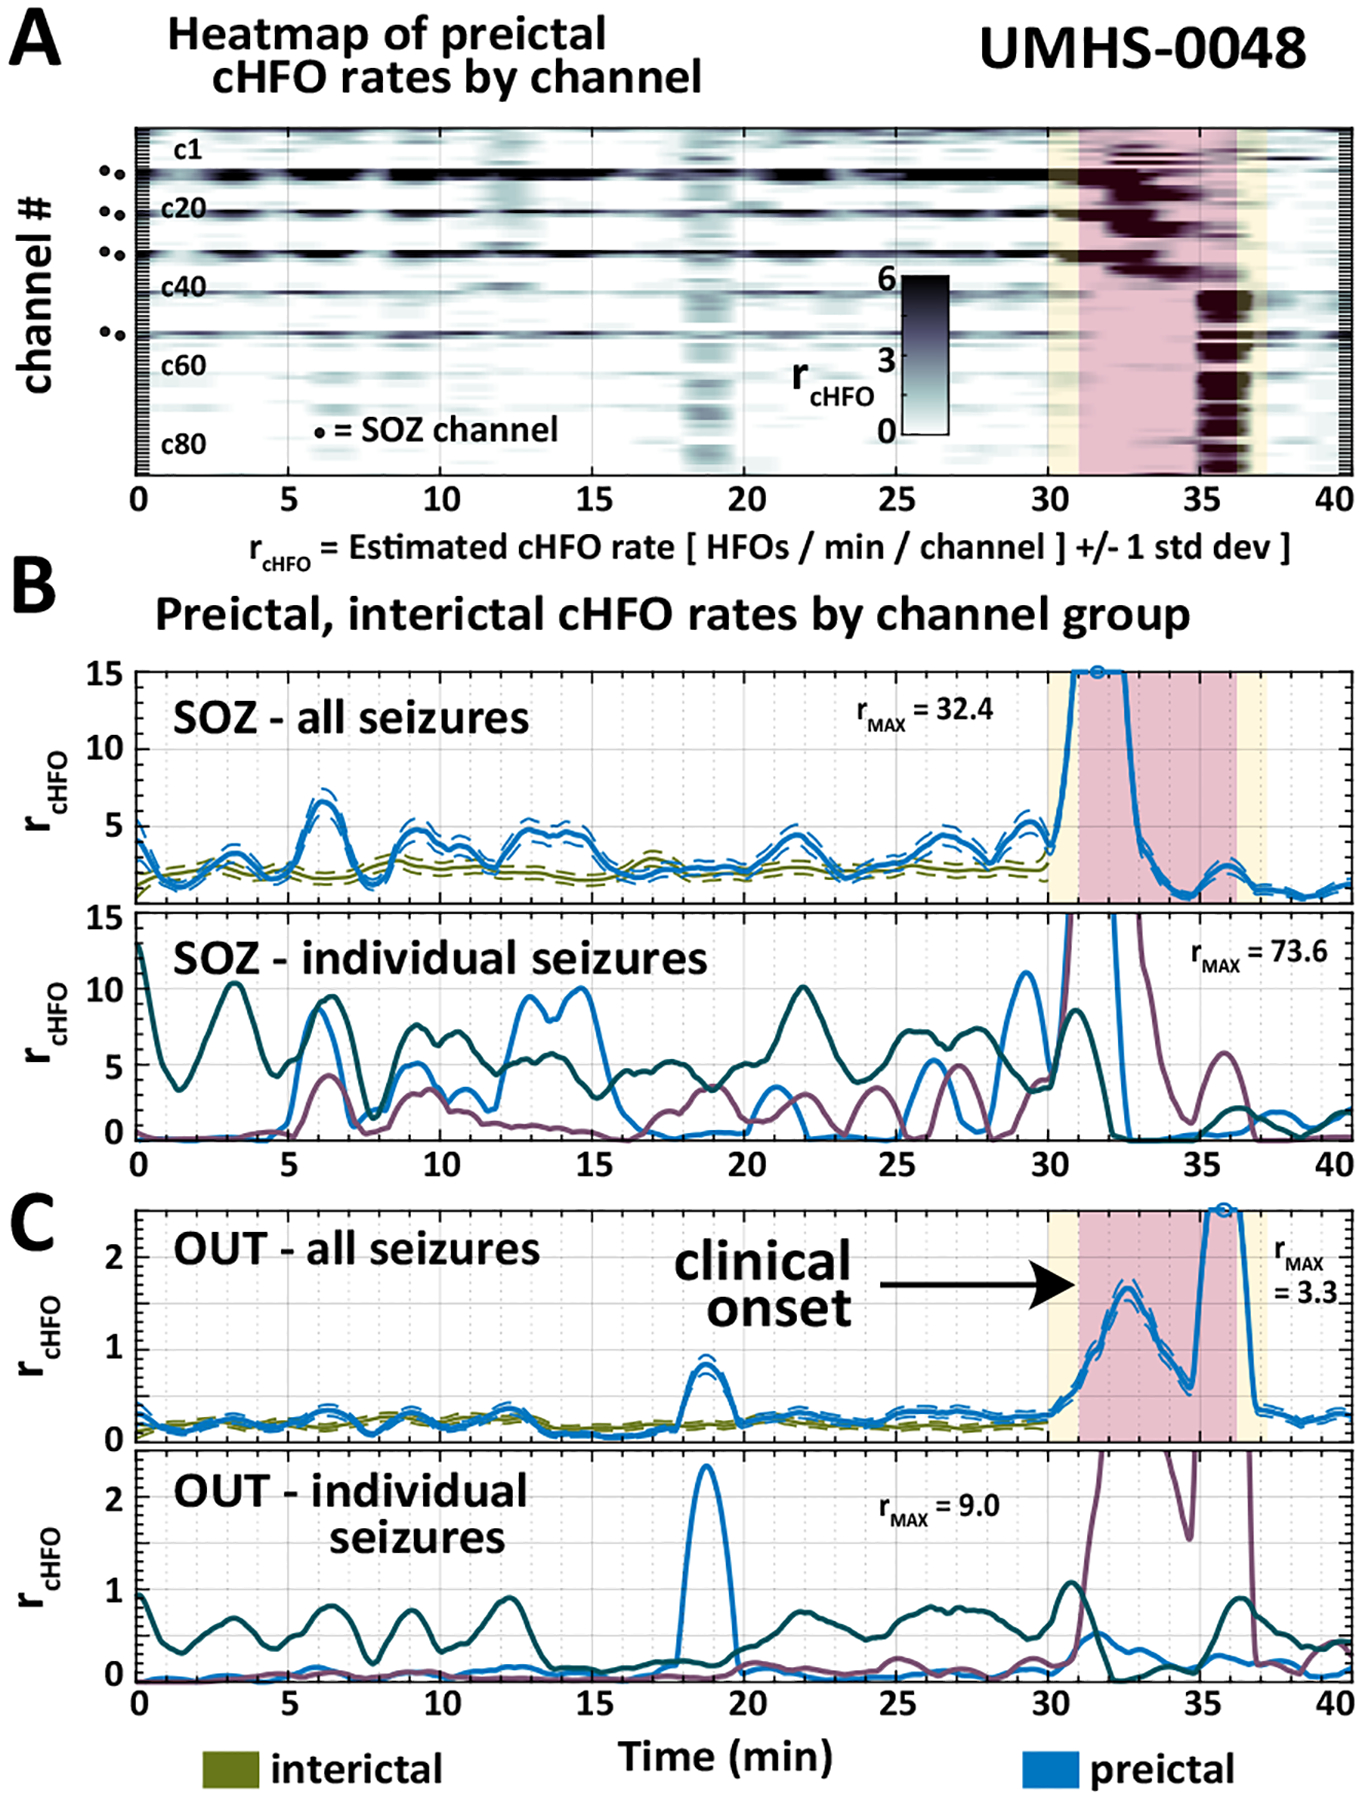
Results: Mean HFO rate was significantly higher for all epochs in seizure onset zone channels versus other channels. Across the 30 patients of our cohort, we found no statistically significant differences in mean HFO rate during preictal and interictal epochs. For continuous HFO rates in seizure onset zone channels, however, we found significant population-wide increases in preictal trends relative to interictal periods. Using a data-driven analysis, we identified a subset of 11 patients in whom either preictal HFO rates or their continuous trends were significantly increased relative to those of interictal baseline and the rest of the population.

Significance: These results corroborate existing findings that HFO rates within epileptic tissue are higher during interictal periods. We show this finding is also present in preictal, ictal, and postictal data, and identify a novel biomarker of preictal state: an upward trend in HFO rate leading into seizures in some patients. Overall, our findings provide preliminary evidence that HFOs can function as a temporal biomarker of seizure onset.

Keywords: high-frequency oscillation; preictal biomarker; seizure prediction; temporal biomarker.


Conflict of interest statement

Disclosure

We confirm that we have read the Journal’s position on issues involved in ethical publication and affirm that this report is consistent with those guidelines.

JS and SR have no conflicts of interest. WS and SG have a licensing agreement with Natus Medical, Inc but have received no financial remuneration.

Figures

Figure 1.
Figure 1.
Schematic diagram showing overall data analysis workflow. (A) Quality HFO detections (qHFOs) and their respective interictal and peri-ictal windows of analysis are aligned in time to compute mean and continuous HFO rate. (B) Analysis windows are created from patient metadata and excluded from further analysis if overlap occurs with a number of conditions that would bias results. (C1) Remaining peri-ictal windows are further divided into preictal, ictal (which includes a 1-minute buffer on either side of the clinically-marked seizure time), and postictal epochs, while (C2) remaining interictal windows are defined as 30-minute epochs. (D) Continuous HFO rate (cHFO) computed from a single seizure in an individual patient is shown for seizure onset zone channels (top row, SOZ) and non-epileptic channels (middle row, OUT). cHFO rates were computed from discrete HFO detections, shown as a raster plot of preictal detections (bottom row) and organized by channel index. This patient (UMHS-0040) was a member of the ‘slope responder’ subset of patients, and showed preictal increases in cHFO rate as onset approached. Note: here cHFO rate is defined as HFOs per minute per channel. Dotted lines indicate +/− one standard deviation; blue denotes preictal cHFO rate while green denotes interictal cHFO rate for comparison. The peri-ictal window was truncated for display purposes at 40 minutes. (E) Example HFO detections for the same patient in interictal, preictal, ictal and postictal periods are visualized in time-frequency plots, each computed with the Morse wavelet.
Figure 2.
Figure 2.
(A) Population boxplots of mean HFO rate comparing interictal (INTR) and preictal (PRE) epochs, organized by channel group (SOZ, OUT). No statistical difference in mean HFO rate during interictal and preictal periods was found; mean rate in SOZ channels was significantly higher than OUT channels for all epochs (ictal and postictal not shown: p < 0.001). Statistical comparisons performed (Wilcoxon signed rank test) are denoted by brackets at the top of each panel; asterisks show statistical significance. Differences in raw data during interictal and preictal epochs are visualized per patient between boxplot groups: ‘mean rate responders’ – patients with increased difference in preictal rate in SOZ channels – are shown with red lines, while other patients are shown with black lines. (B) Smoothed and binned population distributions of the difference in preictal vs. interictal mean HFO rate are shown by channel group. OUT channels (blue) are unimodal, but SOZ channels are bimodal and show the presence of a ‘mean rate responder’ patient subset (red), each having a difference in rate of 0.58 HFOs/minute/channel.
Figure 3.
Figure 3.
Example of cHFO rate analysis (Nelson-Aalen hazard rate estimate) for a single patient across multiple seizures, comparing preictal (blue) and interictal (green) epochs. This patient’s preictal cHFO rates were on average higher than interictal rates. (A) The scaled heatmap of cHFO rates shows the contribution of individual channels to estimates computed from seizure onset zone channels (SOZ – B) and non-epileptic channels (OUT – C). Plots beneath B and C both show cHFO trajectories by individual seizure (without interictal reference). cHFO rate is defined as HFOs per minute per channel, and is shown in top rows of B and C with +/− one standard deviation (dotted lines). Yellow rectangles show the 1-minute ictal buffer, while the red rectangle indicates the clinical duration of a given patient’s longest seizure. The peri-ictal window was truncated for display purposes at 40 minutes.
Figure 4.
Figure 4.
Variability of observed preictal cHFO rates. (A) Many patients had few significant differences between interictal and preictal cHFO rates (example patients given in A1 and A2). (B) Other patients displayed increased preictal cHFO trends relative to those of interictal periods; of these, periodic bursts of HFOs were evident in some (B1), while others showed more sustained increases in preictal HFO rates over interictal (B2). (C) Two patients with gradually increasing preictal HFO rates were also identified. (D) Examples of individual seizures in different patients, whose preictal cHFO rates also gradually increase towards onset, similarly to the average preictal trends of (C). Here cHFO rate is defined as HFOs per minute per channel. Visual formatting of all subfigures herein is the same as shown in Figures 3B and C.
Figure 5.
Figure 5.
(A) Population boxplots of regression slopes fitted to continuous HFO rates of interictal (INTR) and preictal (PRE) epochs, organized by channel group (SOZ, OUT). Increased preictal slopes were observed in both SOZ (Wilcoxon signed rank test; p < 0.05) and OUT (Wilcoxon signed rank test ; p < 0.01) channels. Differences in raw data during interictal and preictal epochs are visualized per patient between boxplot groups: ‘slope responders’ – patients with increasing preictal cHFO rates in SOZ and OUT channels – are shown with red and blue lines respectively, while other patients are shown with black lines. (B) Smoothed and binned population distributions of preictal cHFO regression slopes are shown by channel group; both SOZ and OUT distributions are bimodal. ‘OUT slope responders’ (blue) have a slope threshold of +0.41 over 30 minutes, and ‘SOZ slope responders’ (red) have a slope threshold of +1.08 over 30 minutes. Here we define cHFO regression slope (ΔcHFO rate) as the change in HFO rate over 30 minutes, where HFO rate is defined previously as HFOs/minute/channel.

References

    1. Jacobs J, Staba R, Asano E, Otsubo H, Wu JY, Zijlmans M, et al. High-frequency oscillations (HFOs) in clinical epilepsy. Prog Neurobiol. 2012; 98:302–15. - PMC - PubMed
    1. Zijlmans M, Jiruska P, Zelmann R, Leijten F, Jefferys JGR, Gotman J. High frequency oscillations as a new biomarker in epilepsy. Ann Neurol. 2012; 71:169–78. - PMC - PubMed
    1. Fujiwara H, Greiner HM, Lee KH, Holland-Bouley KD, Seo JH, Arthur T, et al. Resection of ictal high-frequency oscillations leads to favorable surgical outcome in pediatric epilepsy. Epilepsia. 2012; 53:1607–17. - PMC - PubMed
    1. Haegelen C, Perucca P, Châtillon CE, Andrade-Valença L, Zelmann R, Jacobs J, et al. High-frequency oscillations, extent of surgical resection, and surgical outcome in drug-resistant focal epilepsy. Epilepsia. 2013; 54:848–57. - PMC - PubMed
    1. Cho JR, Koo DL, Joo EY, Seo DW, Hong SC, Jiruska P, et al. Resection of individually identified high-rate high-frequency oscillations region is associated with favorable outcome in neocortical epilepsy. Epilepsia. 2014; 55:1872–83. - PubMed

Publication types