

Seizure-onset regions demonstrate high inward directed connectivity during resting-state: An SEEG study in focal epilepsy
- PMID: 32944945
- PMCID: PMC7899016
- DOI: 10.1111/epi.16686
Seizure-onset regions demonstrate high inward directed connectivity during resting-state: An SEEG study in focal epilepsy
Abstract
Objective: In patients with medically refractory focal epilepsy, stereotactic-electroencephalography (SEEG) can aid in localizing epileptogenic regions for surgical treatment. SEEG, however, requires long hospitalizations to record seizures, and ictal interpretation can be incomplete or inaccurate. Our recent work showed that non-directed resting-state analyses may identify brain regions as epileptogenic or uninvolved. Our present objective is to map epileptogenic networks in greater detail and more accurately identify seizure-onset regions using directed resting-state SEEG connectivity.
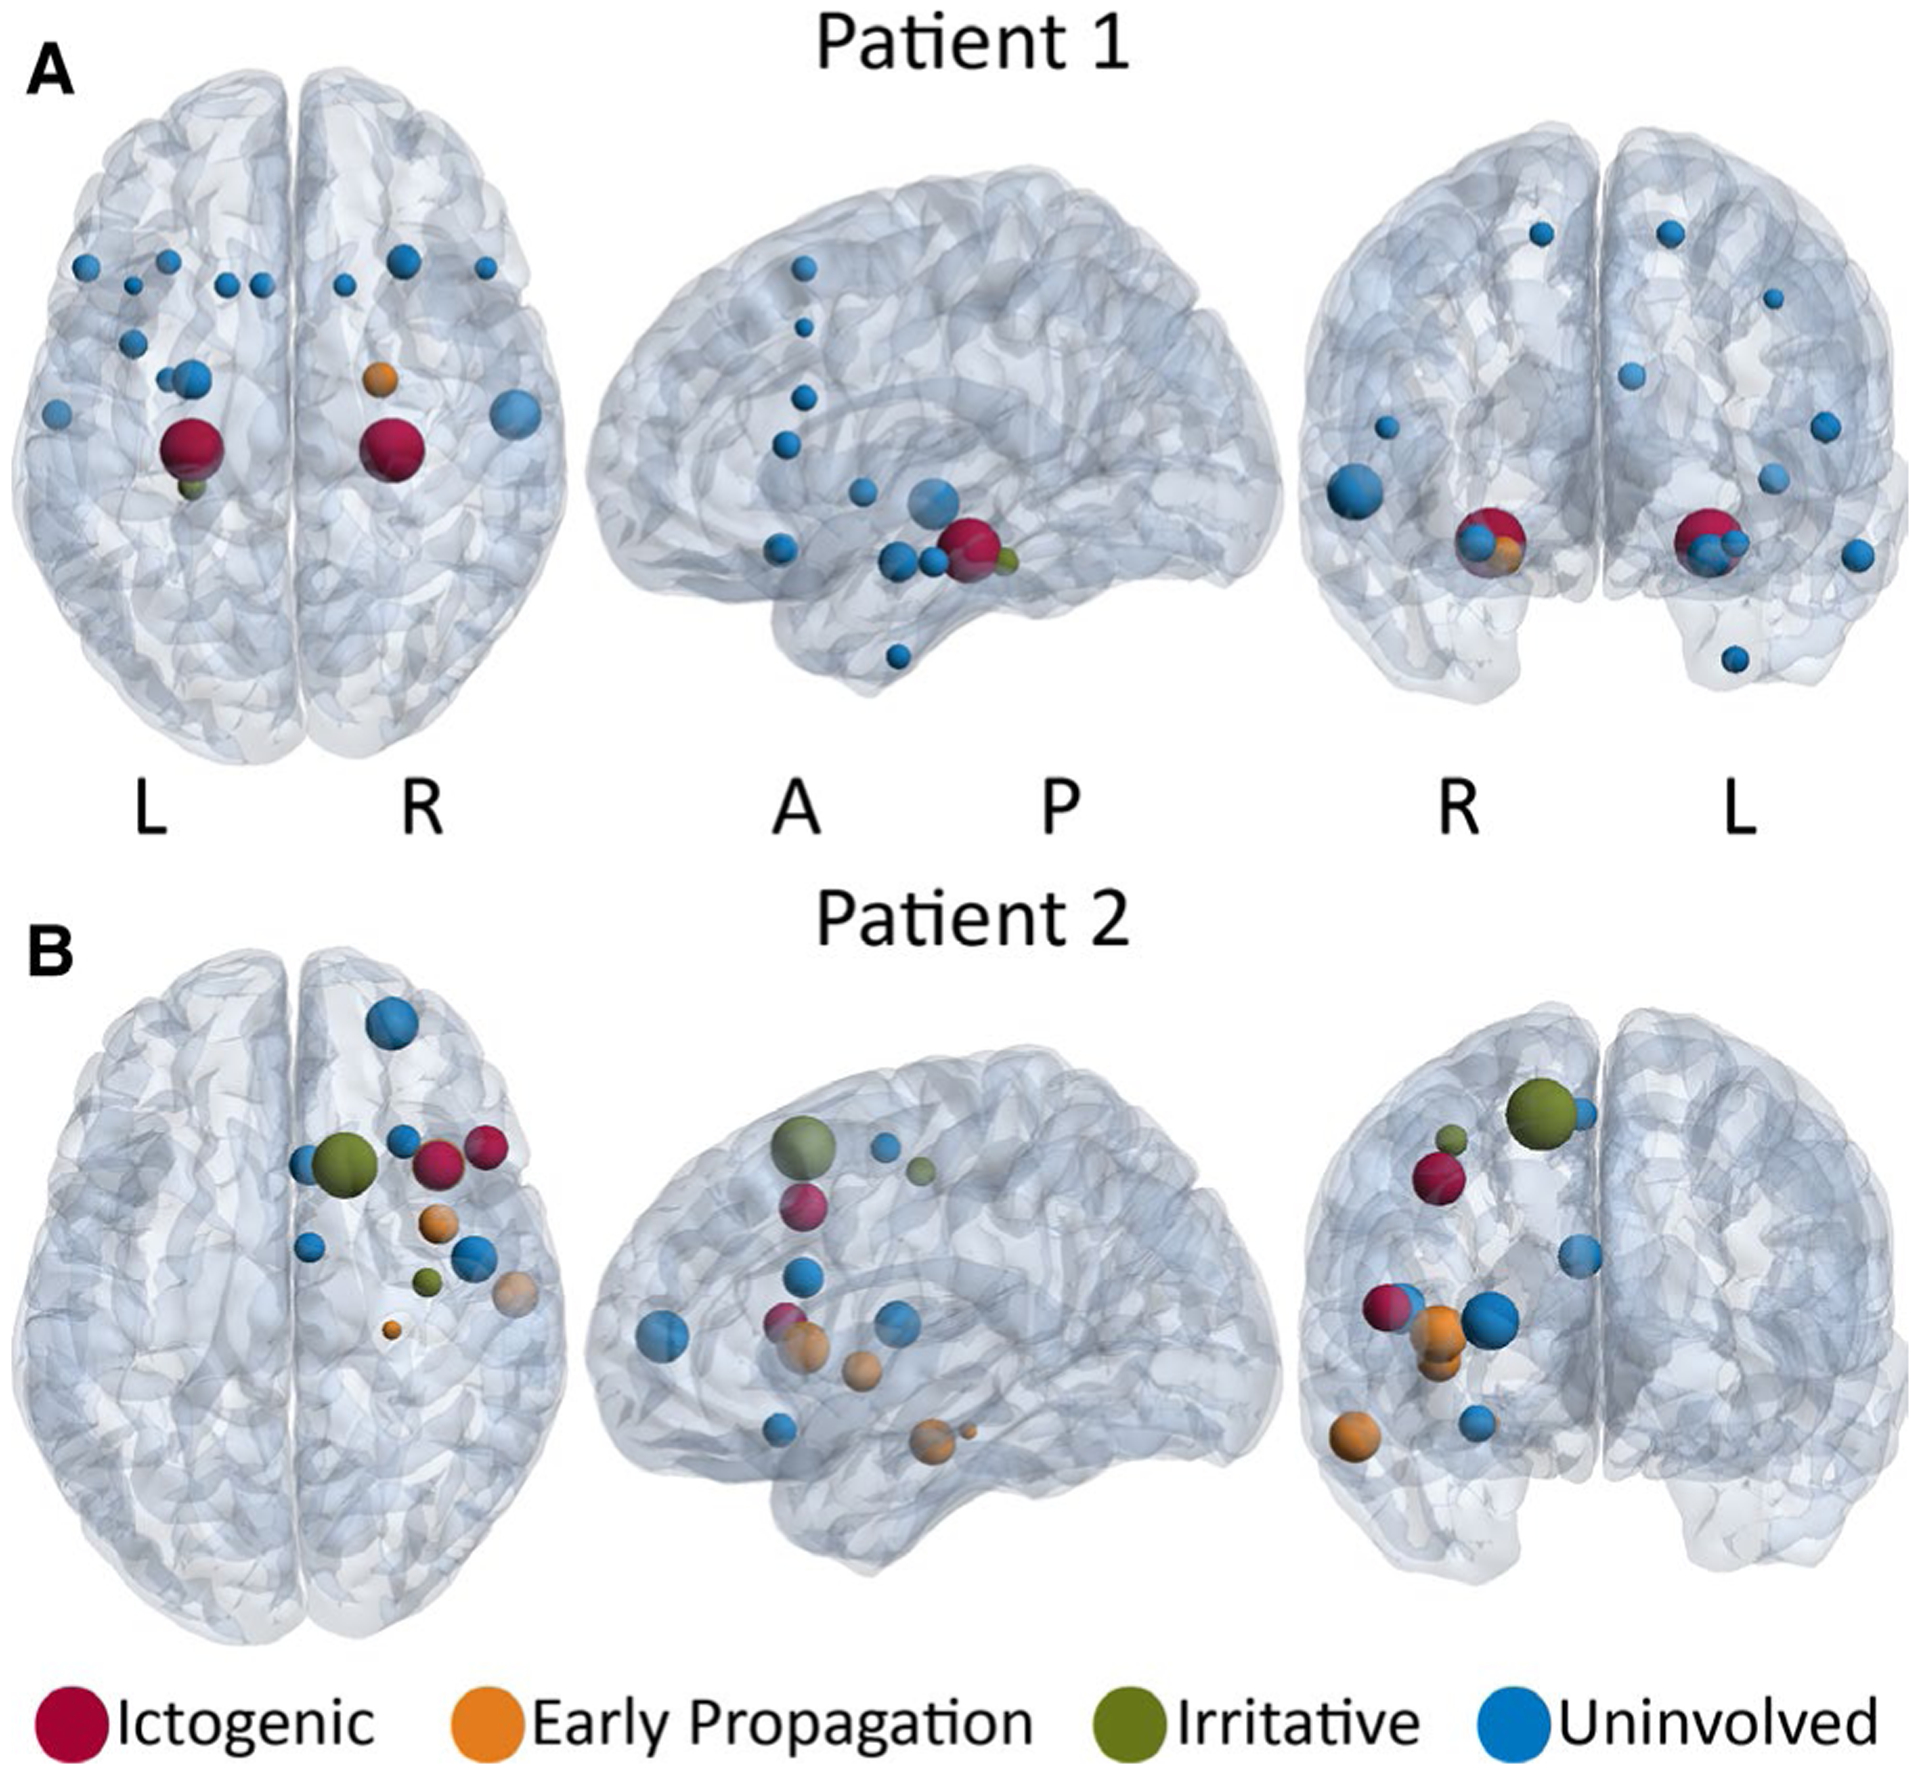
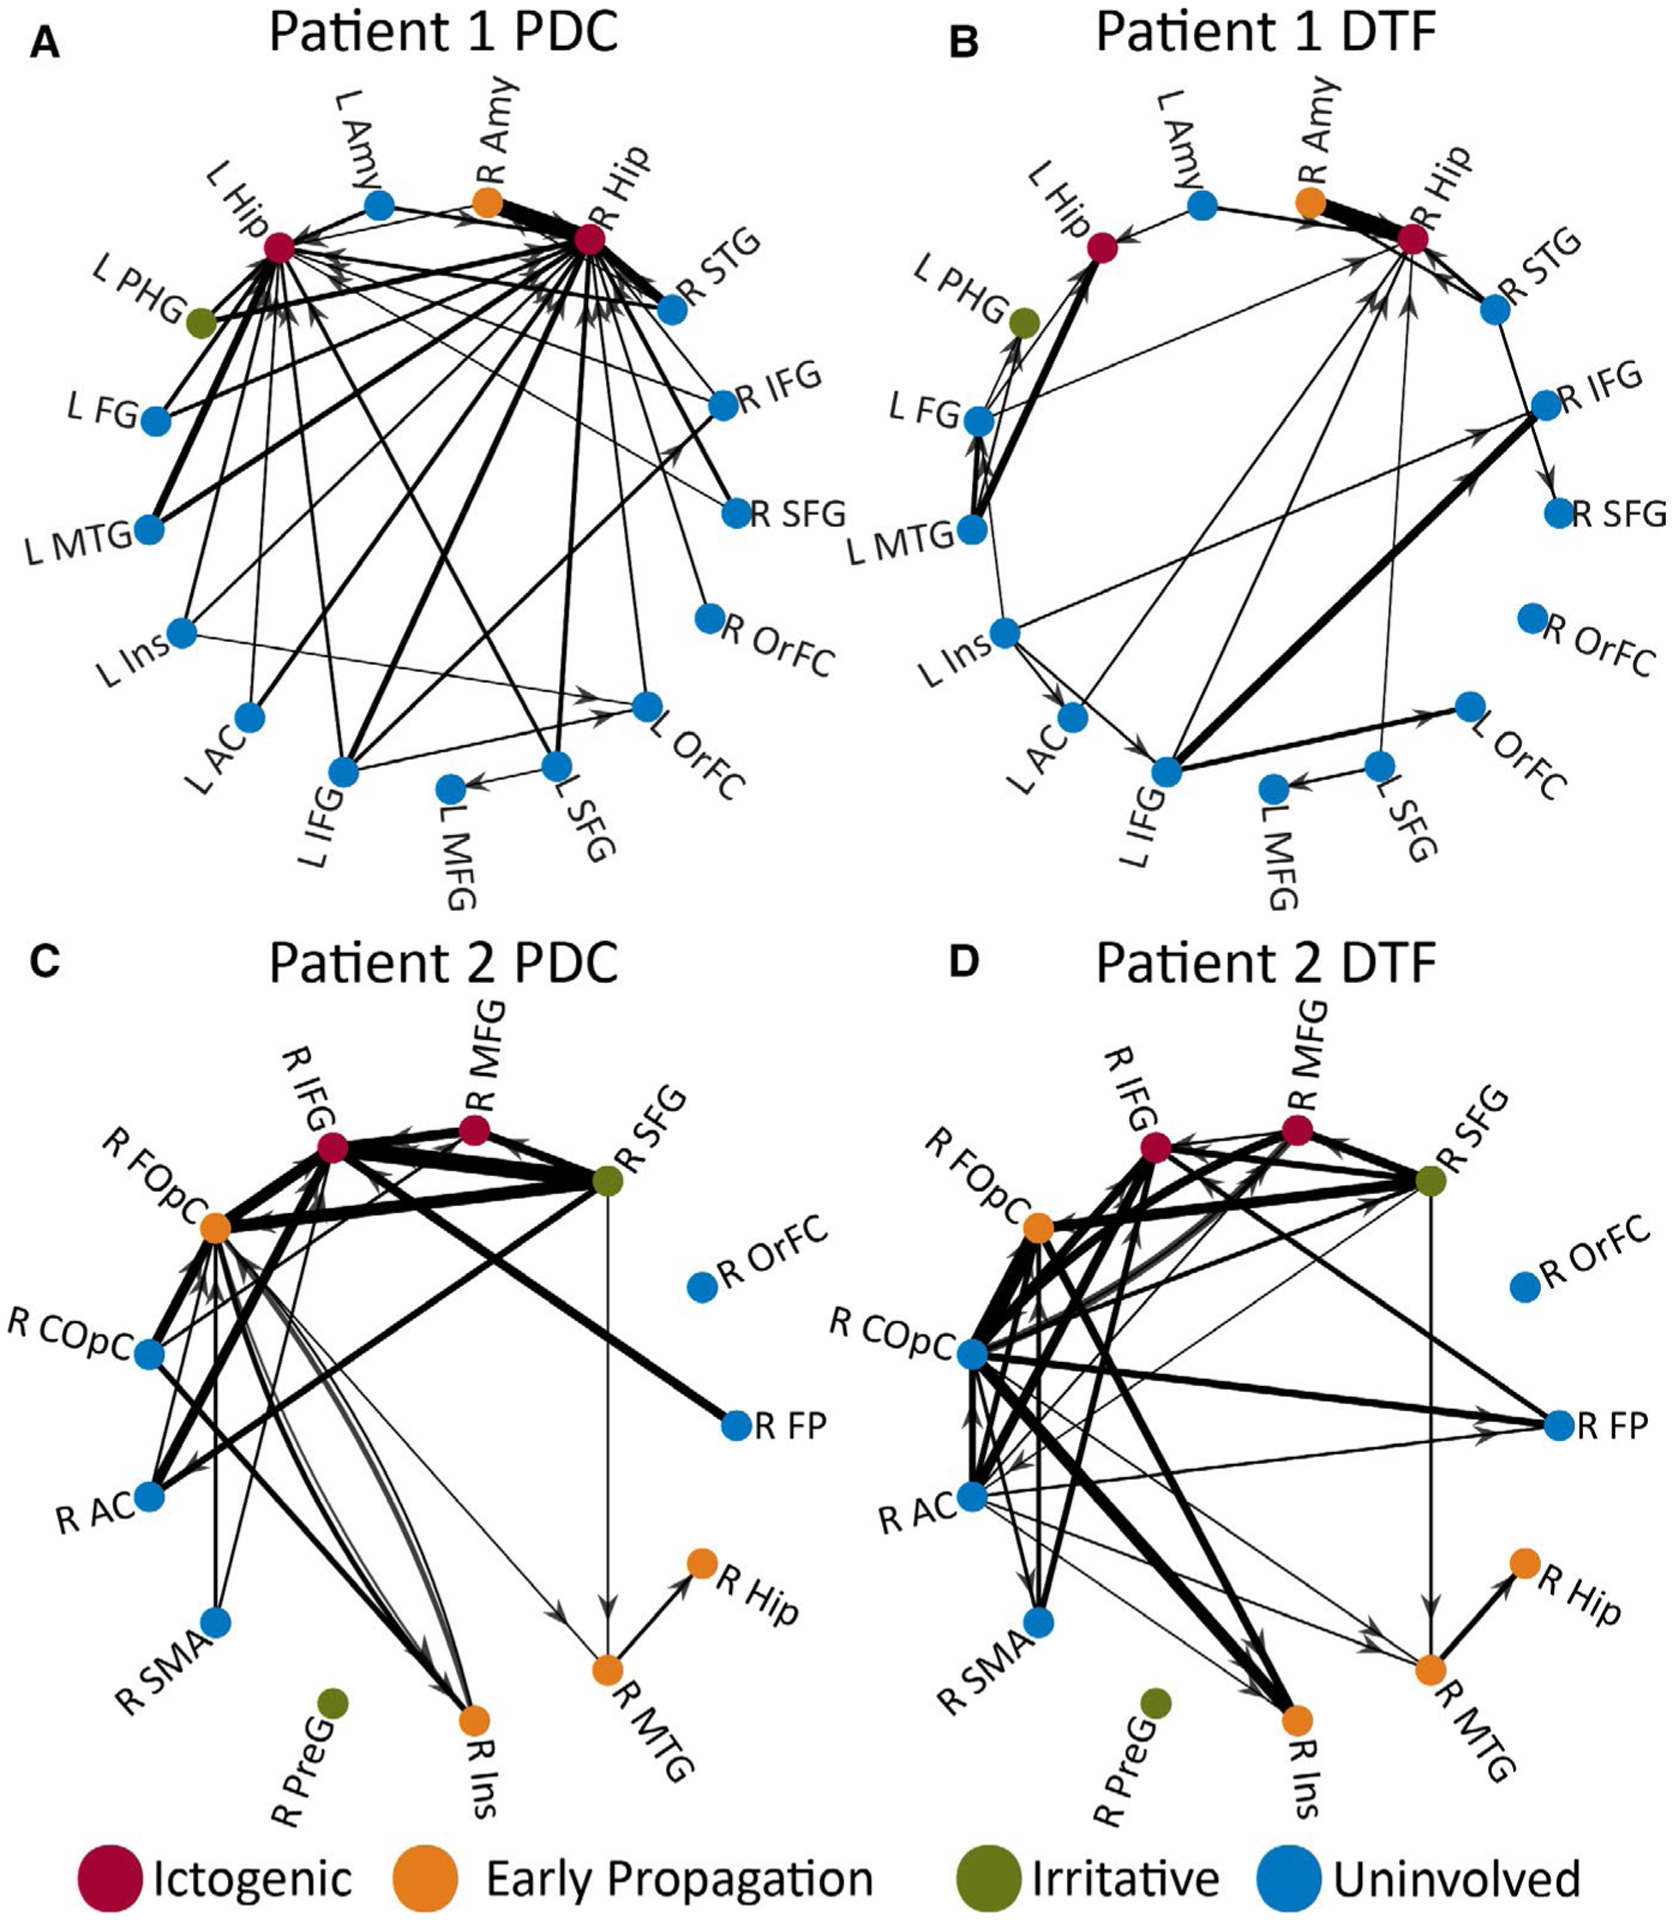
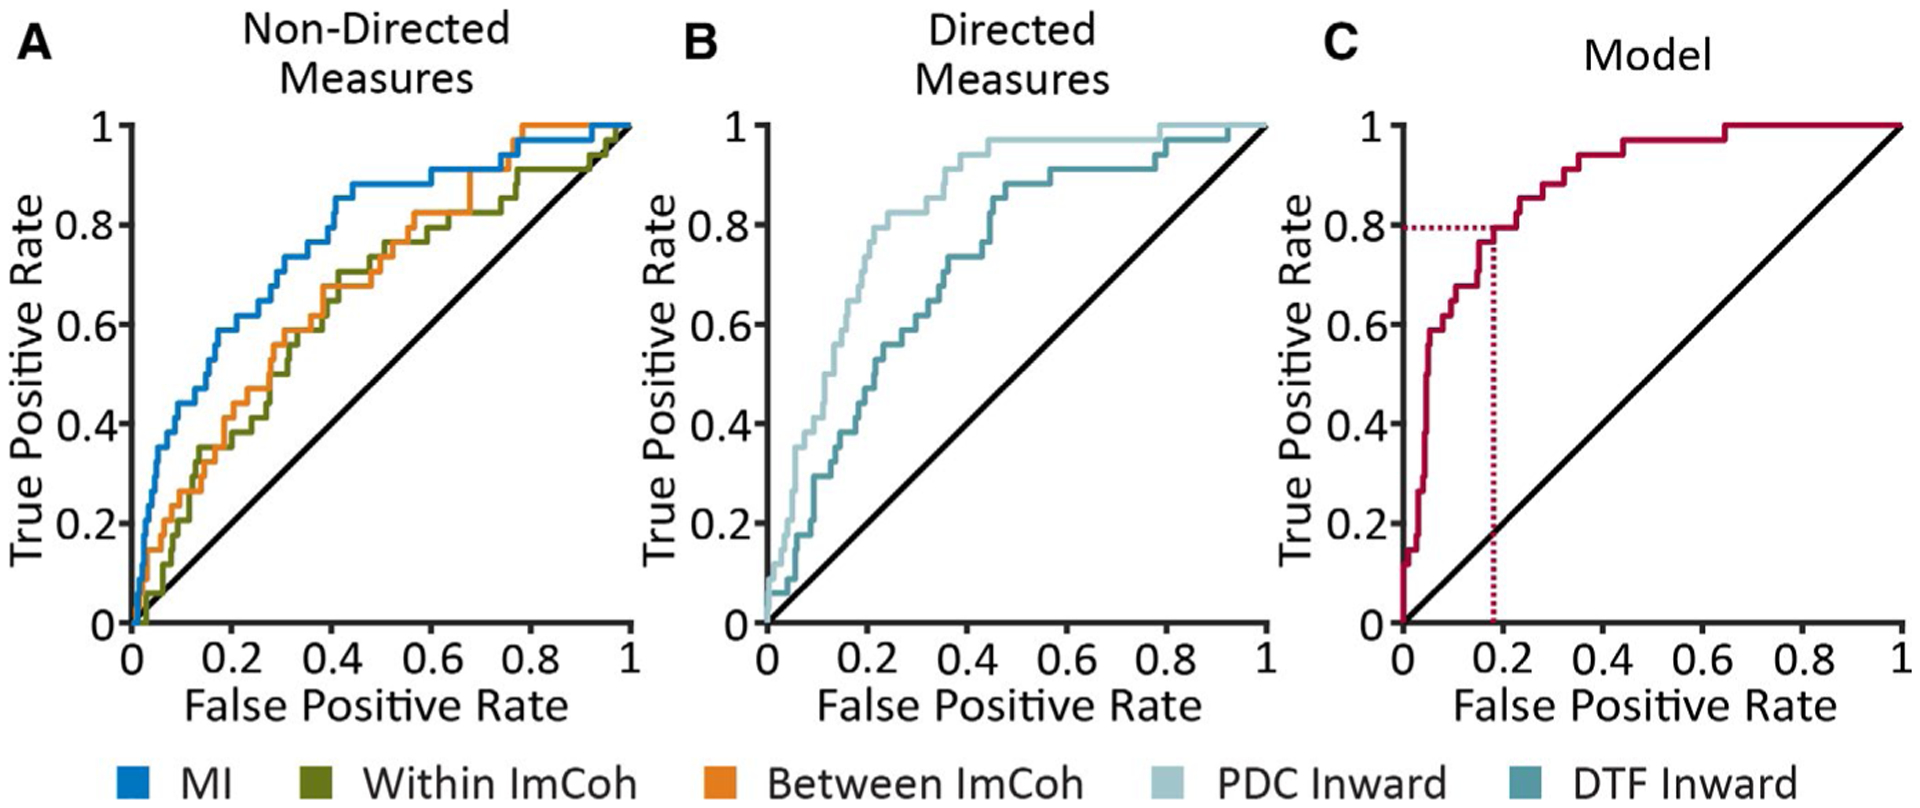
Methods: In 25 patients with focal epilepsy who underwent SEEG, 2 minutes of resting-state, artifact-free, SEEG data were selected and functional connectivity was estimated. Using standard clinical interpretation, brain regions were classified into four categories: ictogenic, early propagation, irritative, or uninvolved. Three non-directed connectivity measures (mutual information [MI] strength, and imaginary coherence between and within regions) and four directed measures (partial directed coherence [PDC] and directed transfer function [DTF], inward and outward strength) were calculated. Logistic regression was used to generate a predictive model of ictogenicity.
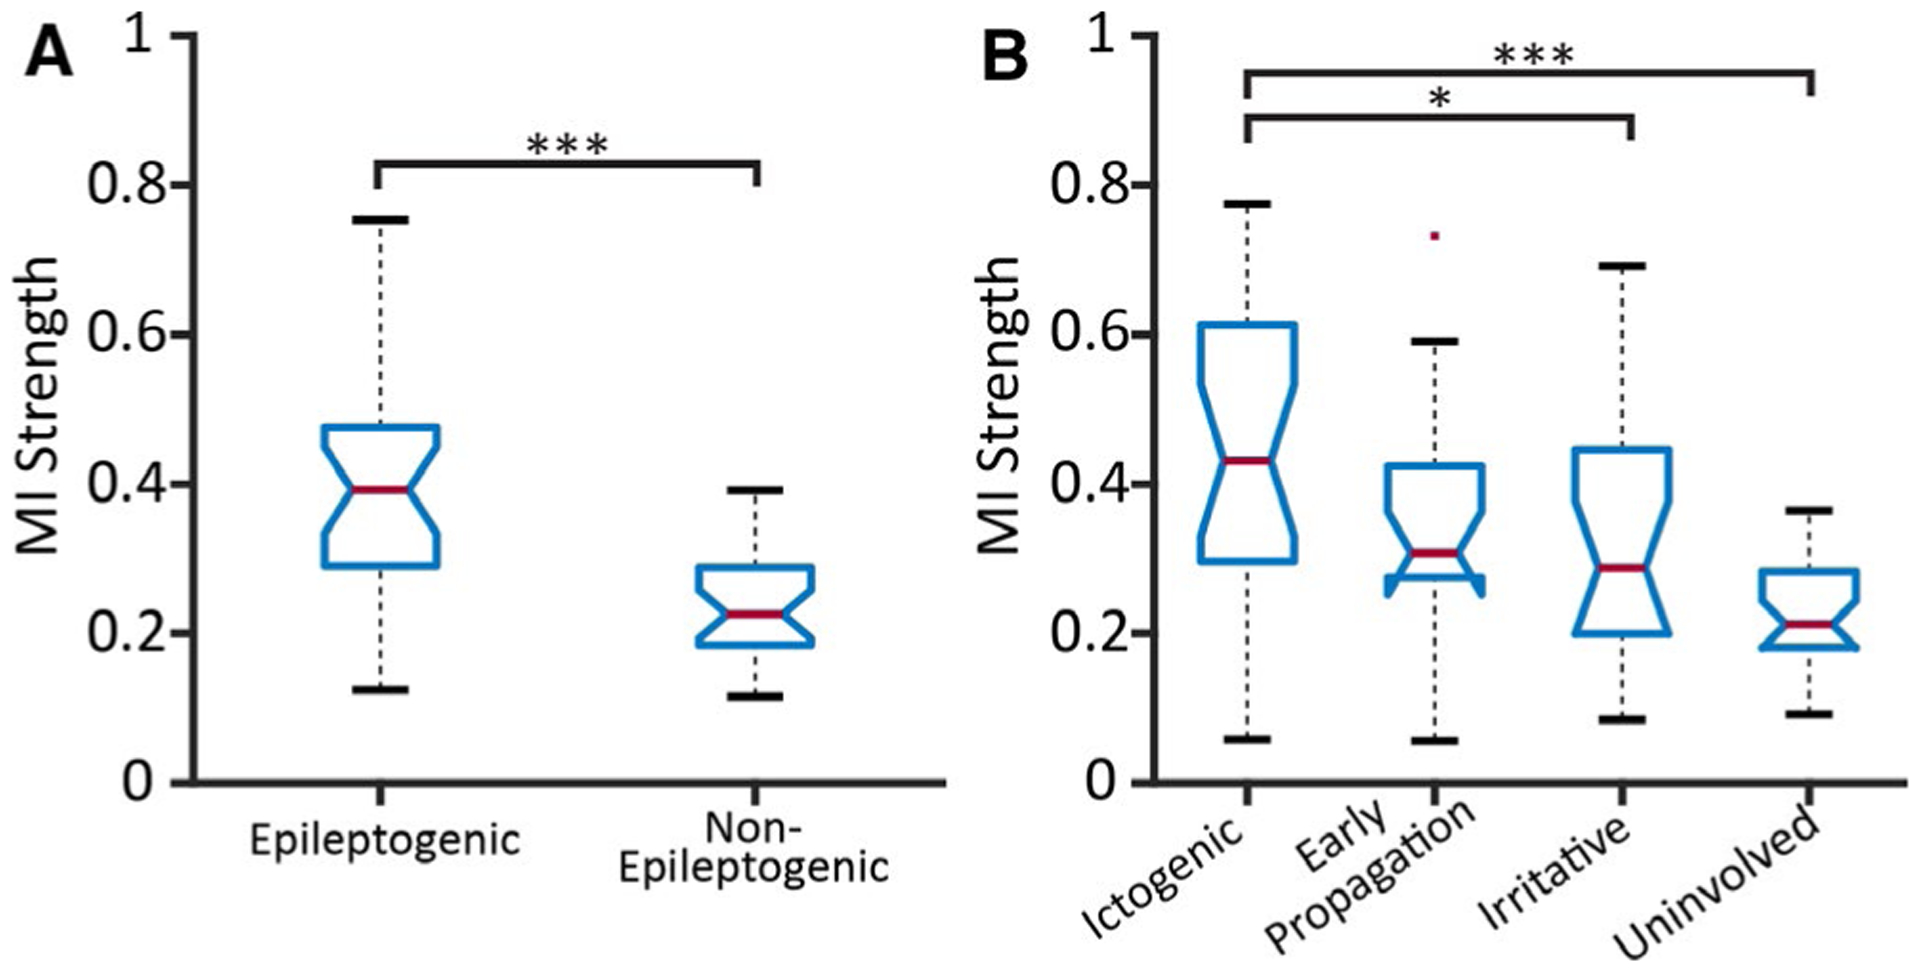
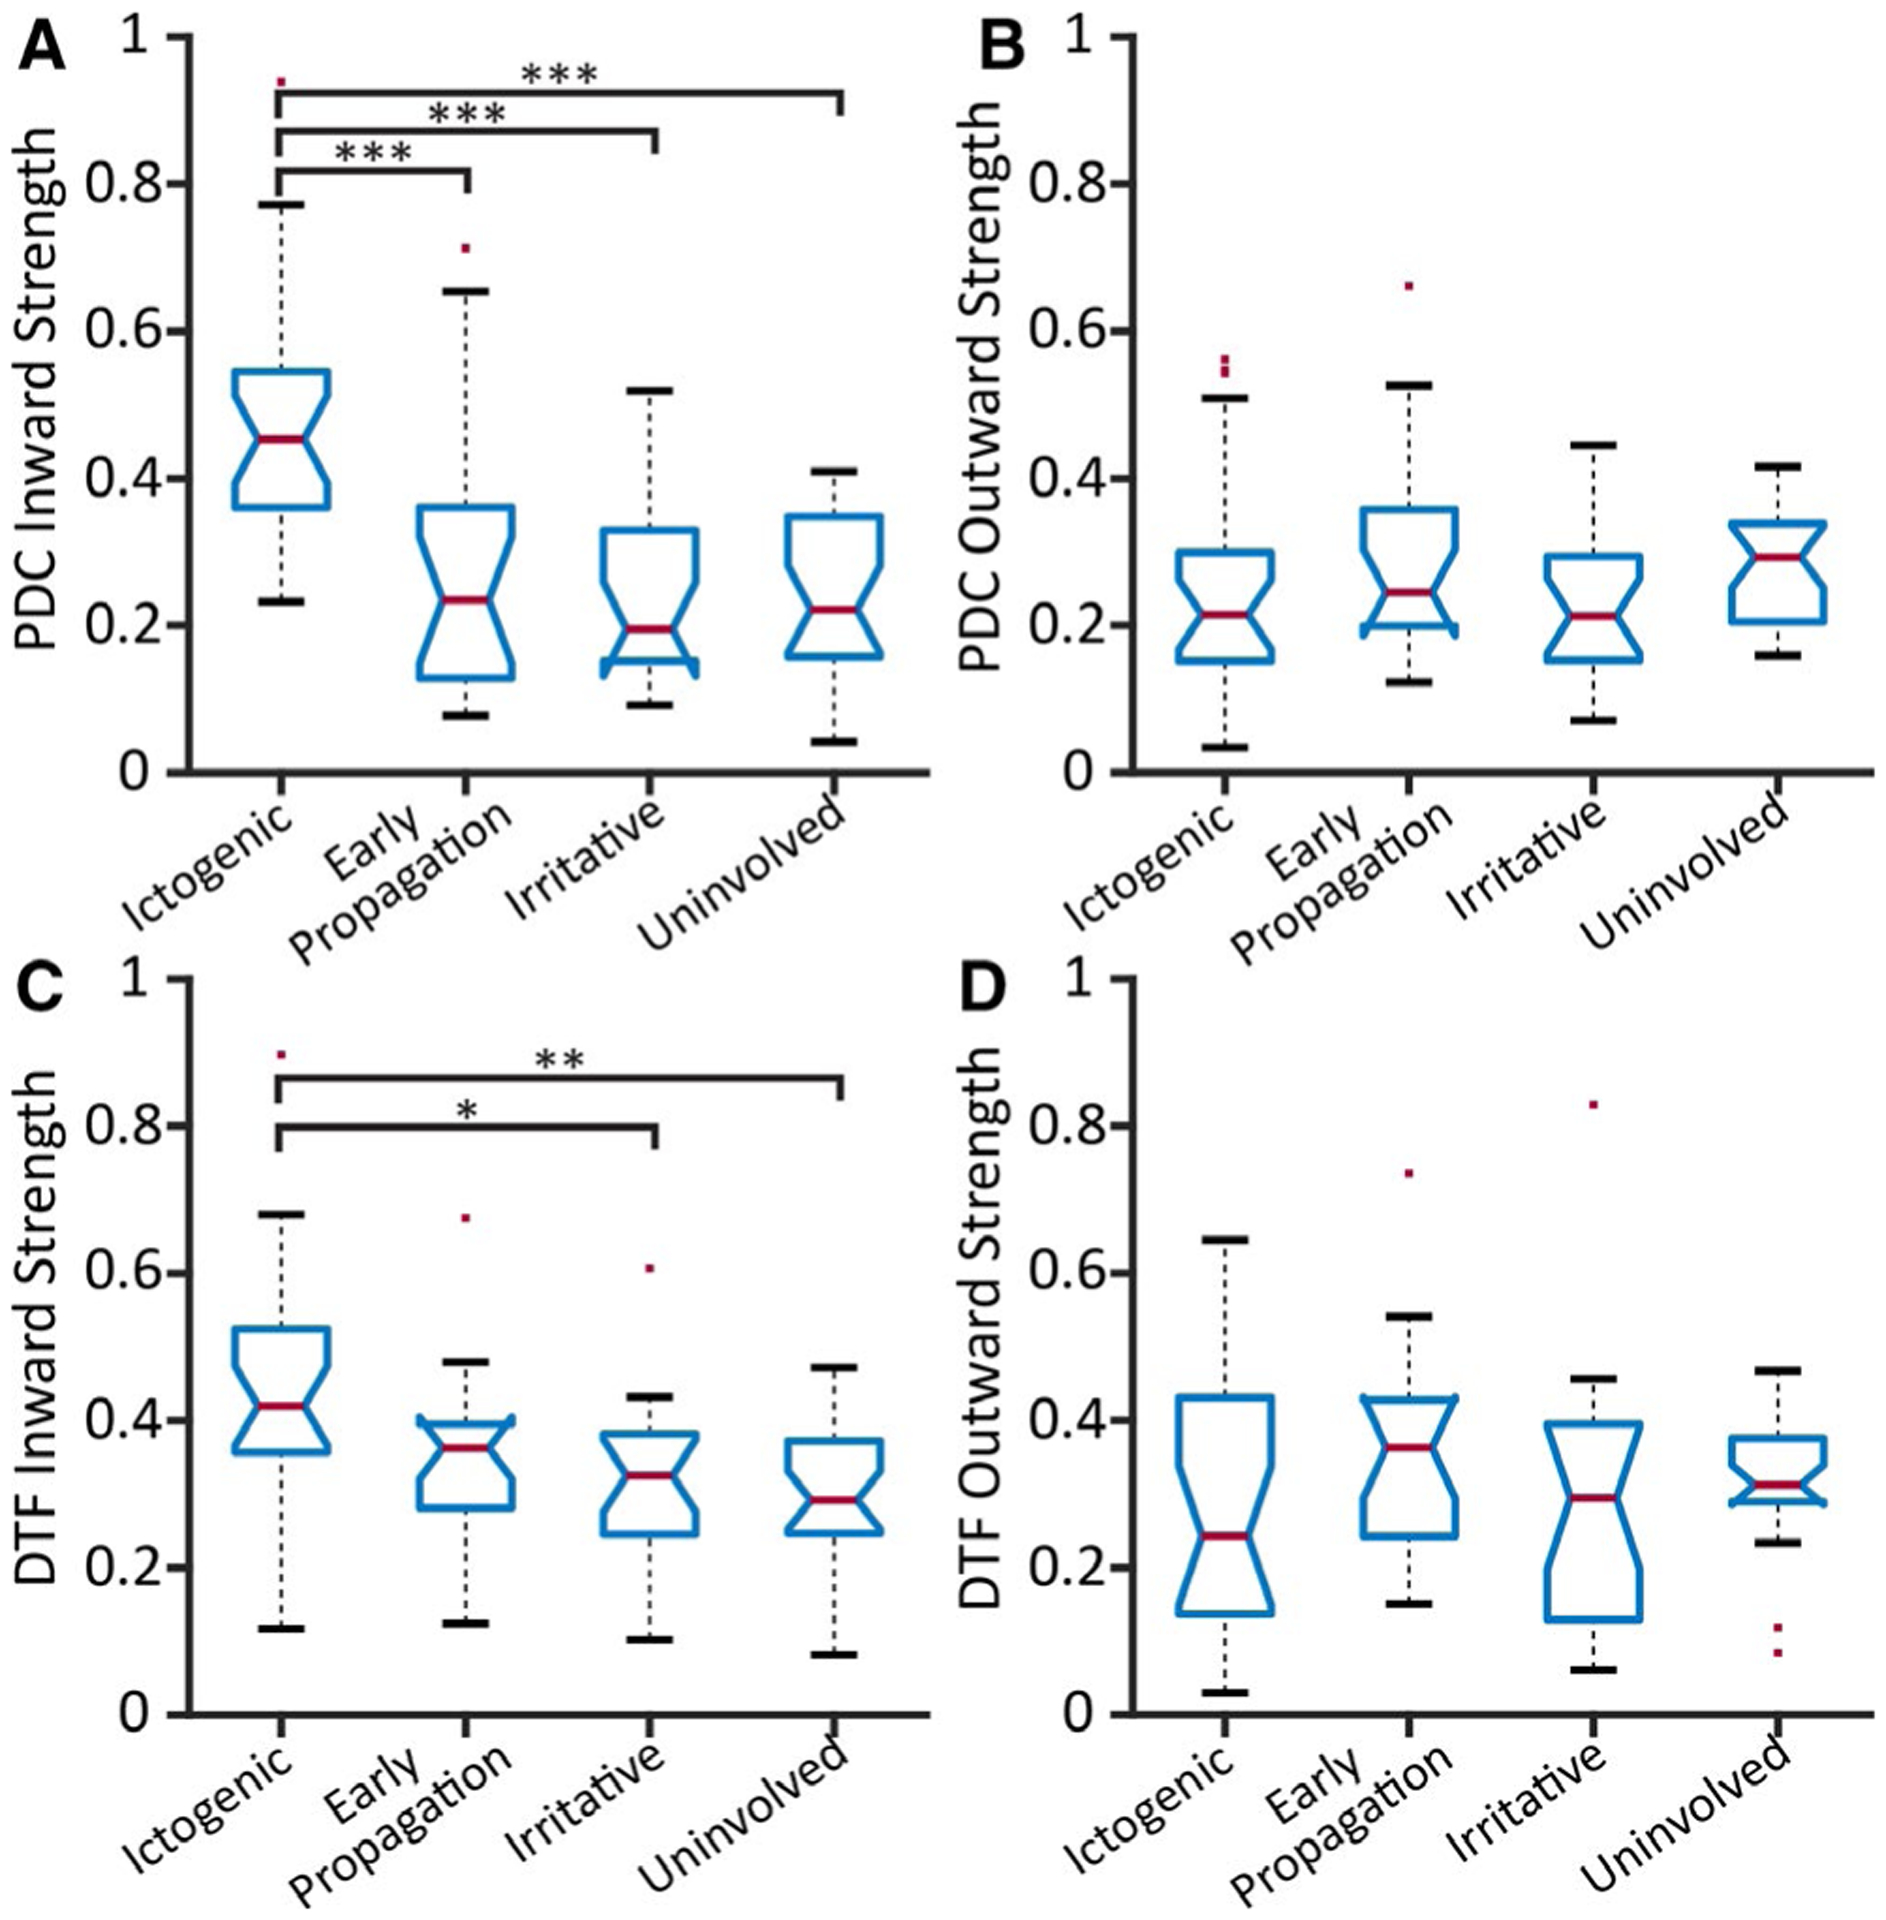
Results: Ictogenic regions had the highest and uninvolved regions had the lowest MI strength. Although both PDC and DTF inward strengths were highest in ictogenic regions, outward strengths did not differ among categories. A model incorporating directed and nondirected connectivity measures demonstrated an area under the receiver-operating characteristic (ROC) curve (AUC) of 0.88 in predicting ictogenicity of individual regions. The AUC of this model was 0.93 when restricted to patients with favorable postsurgical seizure outcomes.
Significance: Directed connectivity measures may help identify epileptogenic networks without requiring ictal recordings. Greater inward but not outward connectivity in ictogenic regions at rest may represent broad inhibitory input to prevent seizure generation.
Keywords: focal epilepsy; functional connectivity; intracranial EEG; localization; prediction.
© 2020 International League Against Epilepsy.
Conflict of interest statement
CONFLICTS OF INTEREST
None of the authors has any conflict of interest to disclose. We confirm that we have read the Journal’s position on issues involved in ethical publication and affirm that this report is consistent with those guidelines.
Figures
Similar articles
-
SEEG Functional Connectivity Measures to Identify Epileptogenic Zones: Stability, Medication Influence, and Recording Condition.Neurology. 2022 May 17;98(20):e2060-e2072. doi: 10.1212/WNL.0000000000200386. Epub 2022 Mar 25. Neurology. 2022. PMID: 35338075 Free PMC article.
-
Resting-State SEEG May Help Localize Epileptogenic Brain Regions.Neurosurgery. 2020 Jun 1;86(6):792-801. doi: 10.1093/neuros/nyz351. Neurosurgery. 2020. PMID: 31814011 Free PMC article.
-
Interictal stereotactic-EEG functional connectivity in refractory focal epilepsies.Brain. 2018 Oct 1;141(10):2966-2980. doi: 10.1093/brain/awy214. Brain. 2018. PMID: 30107499
-
Defining epileptogenic networks: Contribution of SEEG and signal analysis.Epilepsia. 2017 Jul;58(7):1131-1147. doi: 10.1111/epi.13791. Epub 2017 May 20. Epilepsia. 2017. PMID: 28543030 Review.
-
The epileptogenic network concept: Applications in the SEEG exploration of lesional focal epilepsies.Neurophysiol Clin. 2024 Nov;54(6):103023. doi: 10.1016/j.neucli.2024.103023. Epub 2024 Oct 30. Neurophysiol Clin. 2024. PMID: 39481212 Review.
Cited by
-
SEEG Functional Connectivity Measures to Identify Epileptogenic Zones: Stability, Medication Influence, and Recording Condition.Neurology. 2022 May 17;98(20):e2060-e2072. doi: 10.1212/WNL.0000000000200386. Epub 2022 Mar 25. Neurology. 2022. PMID: 35338075 Free PMC article.
-
Preictal connectivity dynamics: Exploring inflow and outflow in iEEG networks.Front Netw Physiol. 2025 Apr 28;5:1539682. doi: 10.3389/fnetp.2025.1539682. eCollection 2025. Front Netw Physiol. 2025. PMID: 40357443 Free PMC article.
-
Multimodal quantitative analysis guides precise preoperative localization of epilepsy.J Neurol. 2025 Aug 15;272(9):579. doi: 10.1007/s00415-025-13324-5. J Neurol. 2025. PMID: 40815323 Review.
-
Normative intracranial EEG maps epileptogenic tissues in focal epilepsy.Brain. 2022 Jun 30;145(6):1949-1961. doi: 10.1093/brain/awab480. Brain. 2022. PMID: 35640886 Free PMC article.
-
Source-sink connectivity: a novel interictal EEG marker for seizure localization.Brain. 2022 Nov 21;145(11):3901-3915. doi: 10.1093/brain/awac300. Brain. 2022. PMID: 36412516 Free PMC article.
References
-
- Behr C, Goltzene M, Kosmalski G, Hirsch E, Ryvlin P. Epidemiology of epilepsy. Rev Neurol (Paris). 2016;172(1):27–36. - PubMed
-
- Mullin JP, Shriver M, Alomar S, Najm I, Bulacio J, Chauvel P, et al. Is SEEG safe? A systematic review and meta-analysis of stereo-electroencephalography–related complications. Epilepsia. 2016;57(3):386–401. - PubMed
Publication types
MeSH terms
Grants and funding
- T32 EB001628/EB/NIBIB NIH HHS/United States
- R01 NS112252/NS/NINDS NIH HHS/United States
- KL2 TR002539/TR/NCATS NIH HHS/United States
- R00 NS097618/NH/NIH HHS/United States
- R01 NS110130/NS/NINDS NIH HHS/United States
- K23 NS114178/NS/NINDS NIH HHS/United States
- T32 GM007347/GM/NIGMS NIH HHS/United States
- R00 NS097618/NS/NINDS NIH HHS/United States
- R01 NS112252/NH/NIH HHS/United States
- R01 NS095291/NS/NINDS NIH HHS/United States
- R21 NS113031/NS/NINDS NIH HHS/United States
- F31 NS106735/NS/NINDS NIH HHS/United States
- T32 GM152284/GM/NIGMS NIH HHS/United States
- P50 HD103537/HD/NICHD NIH HHS/United States
- R01 NS095291/NH/NIH HHS/United States
- T32 EB001628-17/NH/NIH HHS/United States
LinkOut - more resources
Full Text Sources
