

Cholesterol 25-Hydroxylase inhibits SARS-CoV-2 and other coronaviruses by depleting membrane cholesterol
- PMID: 32944968
- PMCID: PMC7537045
- DOI: 10.15252/embj.2020106057
Cholesterol 25-Hydroxylase inhibits SARS-CoV-2 and other coronaviruses by depleting membrane cholesterol
Abstract
Coronavirus disease 2019 (COVID-19) is caused by SARS-CoV-2 and has spread across the globe. SARS-CoV-2 is a highly infectious virus with no vaccine or antiviral therapy available to control the pandemic; therefore, it is crucial to understand the mechanisms of viral pathogenesis and the host immune responses to SARS-CoV-2. SARS-CoV-2 is a new member of the betacoronavirus genus like other closely related viruses including SARS-CoV and Middle East respiratory syndrome coronavirus (MERS-CoV). Both SARS-CoV and MERS-CoV have caused serious outbreaks and epidemics in the past eighteen years. Here, we report that one of the interferon-stimulated genes (ISGs), cholesterol 25-hydroxylase (CH25H), is induced by SARS-CoV-2 infection in vitro and in COVID-19-infected patients. CH25H converts cholesterol to 25-hydrocholesterol (25HC) and 25HC shows broad anti-coronavirus activity by blocking membrane fusion. Furthermore, 25HC inhibits USA-WA1/2020 SARS-CoV-2 infection in lung epithelial cells and viral entry in human lung organoids. Mechanistically, 25HC inhibits viral membrane fusion by activating the ER-localized acyl-CoA:cholesterol acyltransferase (ACAT) which leads to the depletion of accessible cholesterol from the plasma membrane. Altogether, our results shed light on a potentially broad antiviral mechanism by 25HC through depleting accessible cholesterol on the plasma membrane to suppress virus-cell fusion. Since 25HC is a natural product with no known toxicity at effective concentrations, it provides a potential therapeutic candidate for COVID-19 and emerging viral diseases in the future.
Keywords: COVID-19 treatment; cholesterol 25-hydroxylase; innate immunity; restriction factor of coronaviruses; viral fusion.
© 2020 The Authors. Published under the terms of the CC BY NC ND 4.0 license.
Conflict of interest statement
T.M.R. is a founder of ViRx Pharmaceuticals and has an equity interest in the company. The terms of this arrangement have been reviewed and approved by the University of California San Diego in accordance with its conflict of interest policies.
Figures
- A
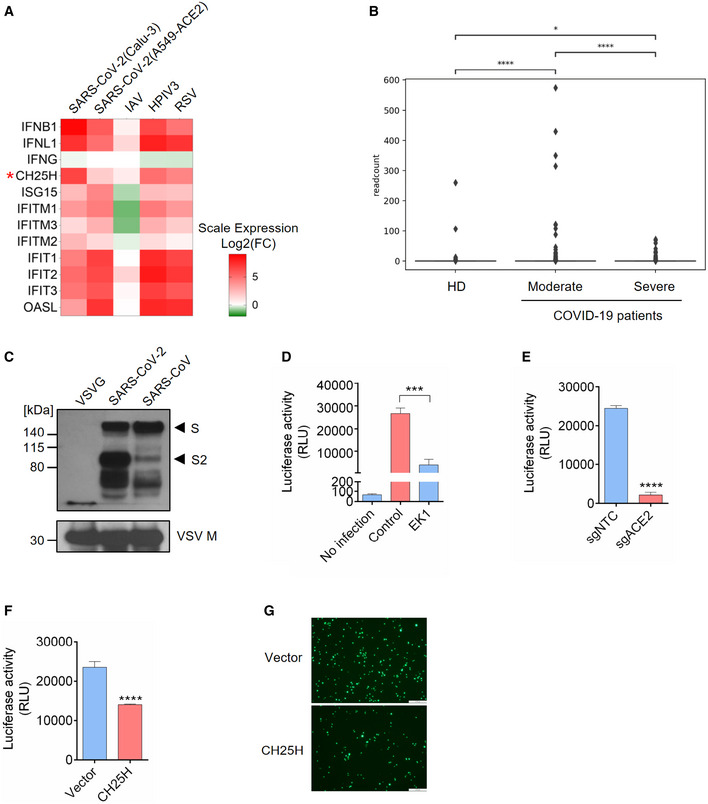
IFNs and ISGs were induced by SARS‐CoV-2 infection in lung epithelial cell lines: Calu‐3 and A549‐ACE2 were infected with SARS‐CoV-2 at MOI = 2 for 24 h; A549 was challenged with IAV at MOI = 5 for 9 h; A549 was infected with HPIV3 and RSV at MOI = 2 for 24 h (Blanco‐Melo et al, 2020). Color key represents log2(fold change) relative to uninfected control cells. CH25H was highlighted by red asterisk.
- B
Expression of CH25H in heathy donors and COVID‐19-infected patients. The box plot shows the expression of CH25H in macrophages of bronchoalveolar lavage fluids from four healthy donors, three moderate COVID‐19-infected patients and six severe COVID‐19-infected patients by scRNA‐seq analysis (Liao et al, 2020). *P < 0.05, ****P < 0.0001, by Student's t‐test.
- C–E
Characterization of SARS‐CoV-2 pseudovirus. (C) SARS‐CoV-2, SARS‐CoV, and VSV pseudovirus (VSV‐G) were concentrated by ultracentrifuge. Incorporation of spike protein on viral membrane was analyzed by Western blot using an antibody recognizing S2 subunit of SARS‐CoV and SARS‐CoV-2. VSV Matrix protein served as a loading control for viral particles. Black arrows indicate full length S and cleaved spike (S2 subunit), respectively. (D) SARS‐CoV-2 pseudovirus infection in Calu‐3 cells with or without treatment of coronavirus fusion peptide EK1. Luciferase activity was measured to quantify the infection. (E) SARS‐CoV-2 pseudovirus infection in Calu‐3 cells transduced with non‐targeting control or ACE2‐specific sgRNA. Luciferase activity was measured to quantify the infection. Mean ± SD of n = 3. ***P < 0.001, ****P < 0.0001, by Student's t‐test.
- F, G
Overexpression of CH25H restricts SARS‐CoV-2 entry. Calu‐3 cells transduced with lentivirus overexpressing CH25H or empty vector were infected with SARS‐CoV-2 pseudovirus encoding Fluc or EGFP and pseudovirus infection was quantified by luciferase assay (F) or visualized by fluorescence microscopy (G). Scale bar, 100 μm. Mean ± SD of n = 3. ****P < 0.0001, by Student's t‐test.

The box plot shows the expression of CH25H in epithelia of bronchoalveolar lavage fluids from four healthy donors, three moderate COVID‐19-infected patients and six severe COVID‐19-infected patients by scRNA‐seq analysis (Liao et al, 2020). *P < 0.05, **P < 0.01, by Student's t‐test
RNA‐seq analysis showed robust induction of CH25H in PBMCs from COVID‐19-infected patients relative to healthy donors (Blanco‐Melo et al, 2020).
Overexpression of SARS‐CoV-2 and SARS‐CoV spike protein in 293FT cells. The plasmids encoding SARS‐CoV-2 or SARS‐CoV spike protein was transfected in 293FT cells and expression of spike protein was analyzed by Western blotting using an antibody recognizing S2 subunit of SARS‐CoV and SARS‐CoV-2. Black arrows indicate full length spike protein and cleaved spike (S2 subunit), respectively.
TMPRSS2 inhibitors, camostat and nafamostat, blocked entry of SARS‐CoV-2 but not VSV. Calu‐3 cells were treated with 10 μM camostat, 10 μM nafamostat or DMSO for 1 h. Then, the cells were infected with SARS‐CoV-2 or VSV pseudovirus with EGFP for 1 h. EGFP signals were captured by fluorescence microscope 24 h post‐infection. Scale bar, 100 μM.
Knockout efficiency of ACE2 in Calu‐3 cells. Calu‐3 cells were transduced with non‐targeting control or ACE2‐specific sgRNA. ACE2 expression was analyzed by Western blotting. Black arrow indicates the band for ACE2.
- A–D
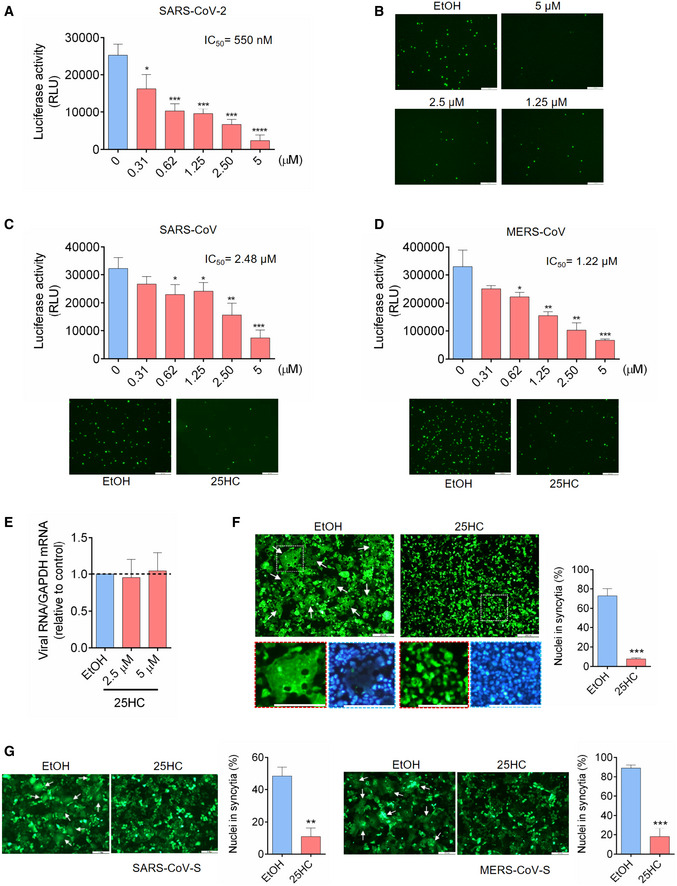
25HC inhibits entry of SARS‐CoV-2 pseudovirus (A and B), SARS‐CoV pseudovirus (C), and MERS‐CoV pseudovirus (D). Calu‐3 cells were treated with EtOH or indicated concentrations of 25HC for 16 h. Cells were then challenged with FLuc‐expressing pseudovirus (A, C and D) and EGFP‐expressing pseudovirus (B, C and D) at MOI = 0.2, with EtOH or 25HC. After 2 h of infection, virus was removed and pseudovirus infection was quantified by luciferase assay at 24 h post‐infection (A, C and D) or visualized by fluorescence microscopy (B, C and D). IC50 was calculated by GraphPad using non‐linear regression analysis. Statistical analyses were conducted by Student's t‐test. Scale bar, 100 μm. Bar represents mean ± SD of n = 4. *P < 0.05, **P < 0.01, ***P < 0.001, ****P < 0.0001.
- E
25HC does not inhibit SARS‐CoV-2 pseudovirus receptor binding. Calu‐3 cells were treated with EtOH or 25HC (2.5 or 5 μM) for 24 h prior to challenge by SARS‐CoV-2 pseudovirus at 4°C for 1 h. Total cellular RNA was extracted and quantified for VSV‐L by qPCR. Bar represents mean ± SD of n = 4.
- F, G
25HC inhibits membrane fusion mediated by SARS‐CoV-2 S (F), SARS‐CoV S (G, left), and MERS‐CoV S (G, right). 293FT or Vero cells were treated with EtOH or 25HC (5 μM) for 16 h prior to transfection with pLVX plasmids encoding SARS‐CoV-2 S (F), SARS‐CoV S (G, left), and MERS‐CoV S (G, right) in the absence of EtOH or 25HC. At 24 h post‐transfection, syncytium formation was visualized by fluorescence microscopy. Scale bar, 50 μm. White arrows indicate syncytia. Quantification of membrane fusion was performed by calculating the percentages of nuclei involved in syncytia formation from all nuclei in GFP‐positive cells. Bar represents mean ± SD of n = 3. **P < 0.01, ***P < 0.001, by Student's t‐test.
- A
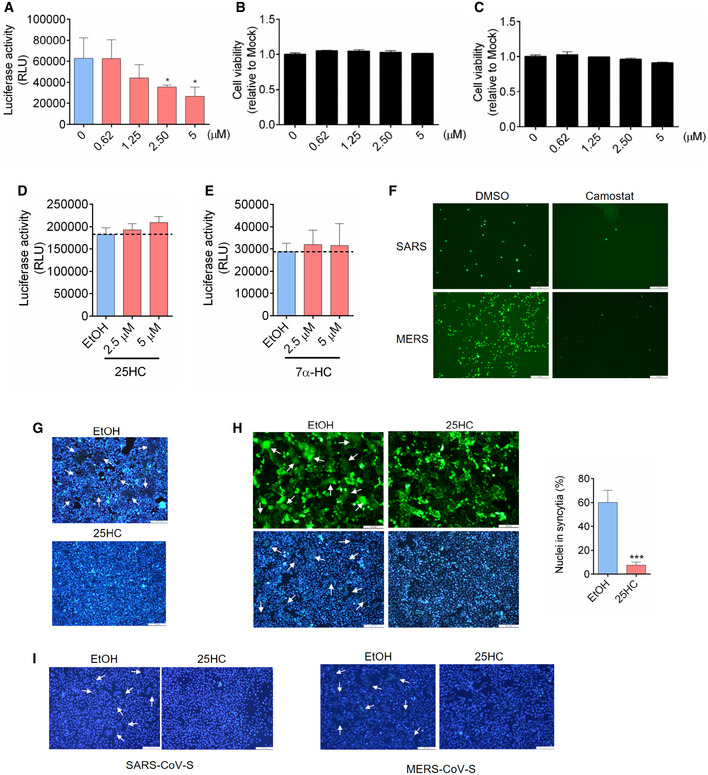
25HC inhibits SARS‐CoV-2 pseudovirus entry into Caco‐2 cells. Following a 16‐h incubation with EtOH or indicated concentrations of 25HC, cells were challenged with SARS‐CoV-2 pseudovirus encoding FLuc. After virus removal at 2 h, cells were lysed and luciferase activity was measured after 24 h. Statistical analyses were conducted by Student's t‐test. Bar represents mean ± SD of n = 3. *P < 0.05.
- B, C
25HC is not cytotoxic to Caco‐2 (B) or Calu‐3 cells (C). Cell were treated with EtOH or indicated concentrations of 25HC for 24 h, and cell viability was measured by CellTiter‐Glo (Promega). Bar represents mean ± SD of n = 3.
- D
25HC does not affect VSV genome replication. Cell were infected with VSV pseudovirus encoding FLuc for 2 h. Then, medium with EtOH or 25HC was added. At 24 h post‐infection, cells were lysed, and luciferase activity was measured. VSV replication was quantified by luciferase assays. Bar represents mean ± SD of n = 3.
- E
7α‐HC does not inhibit SARS‐CoV-2 entry. Following a 16‐h incubation with EtOH or indicated concentrations of 7α‐HC, cells were challenged with SARS‐CoV-2 pseudovirus encoding FLuc for 2 h. At 24 h post‐infection, cells were lysed, and luciferase activity was measured. Statistical analyses were conducted by Student's t‐test. Bar represents mean ± SD of n = 3. *P < 0.05.
- F
TMPRSS2 inhibitors camostat blocked entry of SARS‐CoV and MERS‐CoV pseudoviruses. Calu‐3 cells were treated with 10 μM camostat or DMSO for 1 h. Then the cells were infected with SARS‐CoV or MERS‐CoV pseudovirus with EGFP for 1 h. EGFP signals were captured by fluorescence microscope 24 h post‐infection. Scale bar, 100 μm
- G
Hoechst stain of nuclei in Fig 2F. White arrows indicate syncytia. Scale bar, 50 μm.
- H
25HC inhibits cell–cell fusion on Vero cells. Vero cells were treated with EtOH or 25HC (5 μM) for 16 h prior to transfection with pLVX plasmids encoding SARS‐CoV-2 S. After 4 h, medium was changed and re‐supplemented with EtOH or 25HC. At 48 h post‐transfection, syncytium formation was visualized after trypsin treatment by fluorescence microscopy. White arrows indicate syncytia. Scale bar, 50 μm. Bar represents mean ± SD of n = 3. ***P < 0.001, by Student's t‐test.
- I
Hoechst stain of nuclei in Fig 2G. White arrows indicate syncytia. Scale bar, 50 μm.

- A
Rescue of cholesterol depletion on the plasma membrane (PM) reverses SARS‐CoV-2 entry block in Calu‐3 cells. 25HC induces the depletion of accessible cholesterol on the plasma membrane and supplement of additional cholesterol can reverse the depletion and viral entry.
- B, C
25HC depletes accessible cholesterol on the plasma membrane. (B) Calu‐3 cells were treated with indicated concentrations of 25HC for 1 h and subsequently incubated with ALOD4 for 30 min. Cell were washed twice with PBS, lysed, and the amounts of bound ALOD4 were examined by Western blotting. (C) Calu‐3 cells were treated with 5 μM 25HC for 1 h, and subsequently incubated with AF488‐labeled ALOD4 for 30 min. Cells were washed twice and examined by fluorescence microscopy. Scale bar, 50 μm.
- D
Cholesterol rescues the level of accessible cholesterol on the plasma membrane of 25HC‐treated cells. Calu‐3 cells were pretreated with ethanol or 5 μM 25HC for 1 h. Cells were washed and incubated with PBS or 20 μM cholesterol for 1 h. After further incubation with ALOD4, cells were washed with PBS twice and lysed. The amount of bound ALOD4 was examined by Western blotting.
- E–H
Addition of cholesterol rescues entry of SARS‐CoV-2 pseudovirus, SARS‐CoV pseudovirus, and MERS‐CoV pseudovirus into 25HC‐treated Calu‐3 cells. Cells were pretreated with ethanol or 5 μM 25HC for 16 h, washed, and incubated with PBS or 80 μM cholesterol for 1 h prior to infection with SARS‐CoV-2 pseudovirus. Entry of SARS‐CoV-2 pseudovirus (E and F), SARS‐CoV pseudovirus (G), and MERS‐CoV pseudovirus (H) was assessed by luciferase assay or by fluorescence microscopy at 24 h post‐infection. Scale bar, 100 μm. Bar represents mean ± SD of n = 3. **P < 0.01, ***P < 0.001, ****P < 0.0001, by Student's t‐test.

- A, B
SARS-CoV‐2 entry is dependent on TMPRSS2 but not endosomal cathepsin in lung epithelial cells. Calu‐3 cells were treated with 10 μM camostat or 25 μM E‐64D for 1 h. Then, the cells were infected with SARS‐CoV-2 pseudovirus with EGFP (A) or Fluc (B) for 1 h. EGFP signals were captured by fluorescence microscope 24 h post‐infection. Scale bar, 100 μm. Luciferase activity was measured at 24 h post‐infection. Bar represents mean ± SD of n = 3. ****P < 0.0001, by Student's t‐test.
- C
25HC depletes accessible cholesterol on the plasma membrane. Calu‐3 cells were treated with EtOH or 5 μM 25HC and subsequently incubated with 3 or 6 μM ALOD4 for 30 min. The amount of bound ALOD4 was examined by Western blotting.
- D, E
Supplement of cholesterol can rescue cell–cell fusion induced by SARS‐CoV-2 S. (D) 293FT cells were treated with EtOH or 25HC (5 μM) for 16 h prior to transfection with pLVX plasmids encoding SARS‐CoV-2 S. 4 h post‐transfection, medium was changed and re‐supplemented with EtOH or 25HC in the presence or absence of 80 μM cholesterol. 24 h post‐transfection, syncytium formation was visualized by fluorescence microscopy. Scale bar, 50 μm. (E) Membrane fusion was quantified as the percentage of nuclei within syncytia out of all nuclei in GFP‐positive cells. Bar represents mean ± SD of n = 3, ***P < 0.001, ****P < 0.0001, by Student's t‐test.
- F
Synergistic effects of 25HC and TMPRSS2 inhibitor to block SARS‐CoV-2 entry. Addition of Nafamostat in 25HC‐treated cells were infected with SARS‐CoV-2 pseudovirus and 24 h post‐infection, cells were lysed, and luciferase activity was measured. Statistical analyses were conducted by Student's t‐test. Bar represents mean ± SD of n = 3. **P < 0.01, ****P < 0.0001.

- A
Inhibition of cholesterol mobilization from the plasma membrane by the ACAT inhibitor SZ58‐035.
- B
25HC activates ACAT and stimulates the formation of lipid droplets. Calu‐3 cells were cultured in medium containing 2% LPDS prior to the treatment of ethanol or 5 μM 25HC for 16 h. Subsequently, cells were stained by LipidSpot to visualize intracellular lipid droplets. Scale bar, 50 μm.
- C
SZ58‐035 rescues surface accessible cholesterol in 25HC‐treated cells. Calu‐3 cells were treated with vehicle or 40 μM SZ58‐035 for 16 h, prior to treatment with ethanol or 2.5 μM 25HC for 1 h. Cells were then incubated with ALOD4 for 30 min. The amount of bound ALOD4 was examined by Western blotting.
- D, E
Inhibition of ACAT activity by SZ58‐035 rescues viral entry viral entry. Calu‐3 cells were pretreated with ethanol or 5 μM 25HC for 16 h in the presence of DMSO or 40 μM SZ58‐035. Then, cells were washed and incubated with DMSO or 40 μM SZ58‐305 for 1 h prior to infection with SARS‐CoV-2 pseudovirus. Luciferase activity was measured at 24‐hour post‐infection (D). EGFP signal was captured by fluorescence microscope 24 h post‐infection (E). Scale bar, 100 μm. Bar represents mean ± SD of n = 3. ****P < 0.0001, by Student's t‐test.
- F
Knockdown of ACAT1/2 rescues SARS‐CoV-2 pseudovirus entry in 25HC‐treated cells. Calu‐3 cells were transduced with lentiviral vectors carrying non‐targeting shRNA or shRNAs targeting ACAT1 and ACAT2. 48 h post‐transduction, cells were treated with ethanol or 5 μM 25HC for 16 h. Then, the cells were challenged with SARS‐CoV-2 pseudovirus. 24 h post‐pseudovirus challenge, viral entry was quantified by luciferase assays. Bar represents mean ± SD of n = 3. **P < 0.01, ***P < 0.001, by Student's t‐test.


- A, B
25HC inhibits SARS‐CoV-2 USA‐WA1/2020 strain infection in Calu‐3 cells. Cells were pretreated with ethanol or 25HC followed by infection. At 48 h post‐infection, RNA from supernatant (A) and infected cells (B) were extracted and quantified by qPCR. Data are mean ± SD of n = 3, representative of 3 repeats.
- C
Progeny virus titer in supernatant was quantified by plaque assays. Data are mean ± SD of n = 3, representative of 3 repeats. *P < 0.05, by Student's t‐test.
- D
Two‐month‐old differentiated lung organoids were pretreated with 25HC (5 μM) for 16 h and infected with luciferase‐expressing SARS‐CoV-2 pseudovirus at MOI = 0.1 for 2 h and treated with fresh medium containing 5 μM 25HC. Luciferase activity was measured at 24 h post‐infection. Mean ± SD of n = 3. ****P < 0.0001, by Student's t‐test.
Similar articles
-
Inhibition of Coronavirus Entry In Vitro and Ex Vivo by a Lipid-Conjugated Peptide Derived from the SARS-CoV-2 Spike Glycoprotein HRC Domain.mBio. 2020 Oct 20;11(5):e01935-20. doi: 10.1128/mBio.01935-20. mBio. 2020. PMID: 33082259 Free PMC article.
-
3C-like protease inhibitors block coronavirus replication in vitro and improve survival in MERS-CoV-infected mice.Sci Transl Med. 2020 Aug 19;12(557):eabc5332. doi: 10.1126/scitranslmed.abc5332. Epub 2020 Aug 3. Sci Transl Med. 2020. PMID: 32747425 Free PMC article.
-
In vitro virucidal activity of Echinaforce®, an Echinacea purpurea preparation, against coronaviruses, including common cold coronavirus 229E and SARS-CoV-2.Virol J. 2020 Sep 9;17(1):136. doi: 10.1186/s12985-020-01401-2. Virol J. 2020. PMID: 32907596 Free PMC article.
-
Advances in the use of chloroquine and hydroxychloroquine for the treatment of COVID-19.Postgrad Med. 2020 Sep;132(7):604-613. doi: 10.1080/00325481.2020.1778982. Epub 2020 Jun 21. Postgrad Med. 2020. PMID: 32496926 Free PMC article. Review.
-
Compounds with Therapeutic Potential against Novel Respiratory 2019 Coronavirus.Antimicrob Agents Chemother. 2020 Apr 21;64(5):e00399-20. doi: 10.1128/AAC.00399-20. Print 2020 Apr 21. Antimicrob Agents Chemother. 2020. PMID: 32152082 Free PMC article. Review.
Cited by
-
Revealing the characteristics of ZIKV infection through tissue-specific transcriptome sequencing analysis.BMC Genomics. 2022 Oct 8;23(1):697. doi: 10.1186/s12864-022-08919-5. BMC Genomics. 2022. PMID: 36209057 Free PMC article.
-
Positive-strand RNA virus replication organelles at a glance.J Cell Sci. 2024 Sep 1;137(17):jcs262164. doi: 10.1242/jcs.262164. Epub 2024 Sep 10. J Cell Sci. 2024. PMID: 39254430 Free PMC article. Review.
-
Severe COVID-19-A Review of Suggested Mechanisms Based on the Role of Extracellular Matrix Stiffness.Int J Mol Sci. 2023 Jan 7;24(2):1187. doi: 10.3390/ijms24021187. Int J Mol Sci. 2023. PMID: 36674700 Free PMC article. Review.
-
Oxysterols in the Immune Response to Bacterial and Viral Infections.Cells. 2022 Jan 7;11(2):201. doi: 10.3390/cells11020201. Cells. 2022. PMID: 35053318 Free PMC article. Review.
-
Interferon at the crossroads of SARS-CoV-2 infection and COVID-19 disease.J Biol Chem. 2023 Aug;299(8):104960. doi: 10.1016/j.jbc.2023.104960. Epub 2023 Jun 24. J Biol Chem. 2023. PMID: 37364688 Free PMC article. Review.
References
Publication types
MeSH terms
Substances
Grants and funding
LinkOut - more resources
Full Text Sources
Other Literature Sources
Medical
Molecular Biology Databases
Research Materials
Miscellaneous
