

G-Quadruplexes act as sequence-dependent protein chaperones
- PMID: 32945124
- PMCID: PMC7534610
- DOI: 10.15252/embr.201949735
G-Quadruplexes act as sequence-dependent protein chaperones
Abstract
Maintaining proteome health is important for cell survival. Nucleic acids possess the ability to prevent protein aggregation more efficiently than traditional chaperone proteins. In this study, we explore the sequence specificity of the chaperone activity of nucleic acids. Evaluating over 500 nucleic acid sequences' effects on protein aggregation, we show that the holdase chaperone effect of nucleic acids is sequence-dependent. G-Quadruplexes prevent protein aggregation via quadruplex:protein oligomerization. They also increase the folded protein level of a biosensor in E. coli. These observations contextualize recent reports of quadruplexes playing important roles in aggregation-related diseases, such as fragile X and amyotrophic lateral sclerosis (ALS), and provide evidence that nucleic acids have the ability to modulate the folding environment of E. coli.
Keywords: RNA; nucleic acids; protein aggregation; protein folding; proteostasis.
© 2020 The Authors. Published under the terms of the CC BY 4.0 license.
Conflict of interest statement
The authors declare that they have no conflict of interest.
Figures
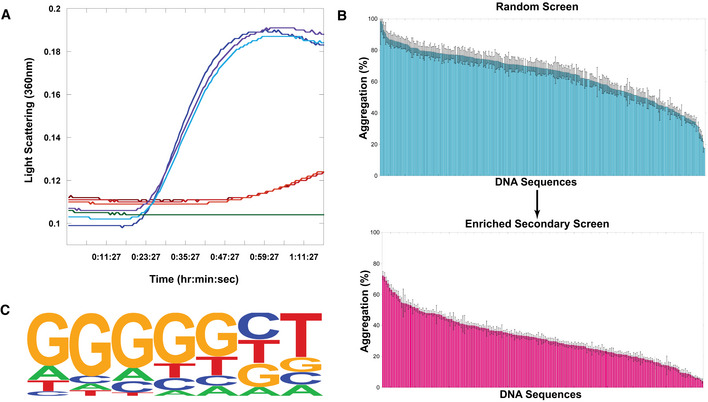
- A
Representative example citrate synthase protein aggregation assay. Turbidity and light scattering were measured in a multimode plate reader at 360 nm for 1.5 h of incubation at 50°C. Blue lines represent triplicate citrate synthase alone, red and orange lines represent triplicate citrate synthase incubated with a single ssDNA sequence, green is buffer alone.
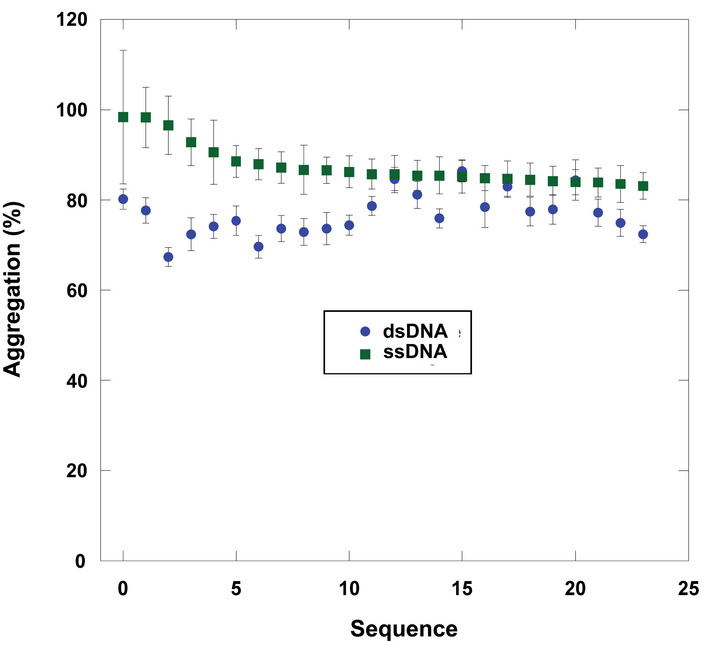
- B
Screen of ssDNA sequences for holdase chaperone activity. Each bar represents a different 20‐nt sequence, sorted by activity. Aggregation % was measured as the normalized average of triplicate (technical replicate) citrate synthase turbidity measurements after 1.5 h of incubation at 50°C (representative example shown in Fig 1A). Lower aggregation indicates greater holdase function. The initial screen used random, non‐redundant sequences (top), which led to a follow‐up enriched screen (bottom). Error bars are mean ± SE.
- C
HOMER Logo of motif found by analyzing screen (statistics using a binomial distribution with the default setting by HOMER to calculate P‐value of motif enrichment (Benner et al, 2017): P < 1.0 × 10⁻¹³, FDR < 0.001, % of Targets: 53.85, % of Background: 7.69).
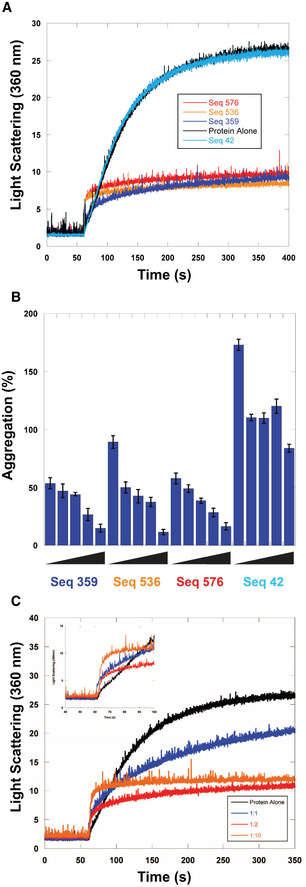
- A
Citrate Synthase aggregation from chemically induced denaturation via right angle light scattering at 360 nm. Sequences 359, 536, and 576 all displayed holdase activity and contain a polyG motif. Sequence 42 was used as a negative control, as it performed poorly as a holdase chaperone and did not contain a polyG motif.
- B
Percent aggregation in thermal denaturation assay with varying concentrations of select quadruplex‐forming sequences (Sequences 359, 536, and 576) and negative control sequence (Seq42). Concentrations are ssDNA strand to protein ratios of: 0.5:1, 1:1, 2:1, 4:1, and 8:1. Error bars are mean ± SE of technical triplicates.
- C
Citrate Synthase aggregation from chemically induced denaturation via right angle light scattering at 360 nm as a function of concentration of Sequence 359.
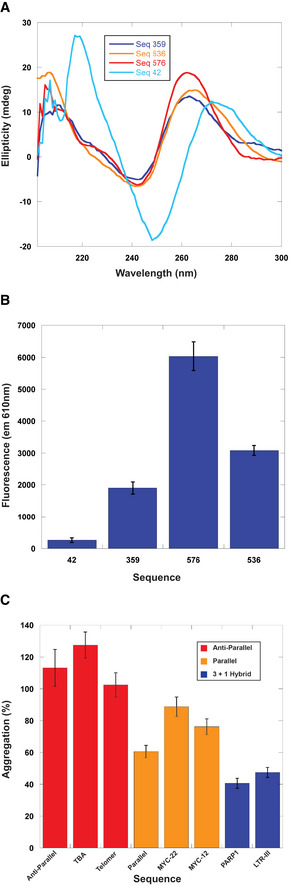
- A
Structural characterization of holdase nucleic acids using circular dichroism in sodium phosphate buffer. Peaks are observed at 260 nm and 210 nm, as well as a trough at 245 nm, indicating the presence of parallel G‐quadruplexes. Thermal stability of quadruplexes shown in Fig EV2 in potassium phosphate buffer.
- B
NMM fluorescence measured at 610 nm. Error bars are mean ± SE of technical triplicates.
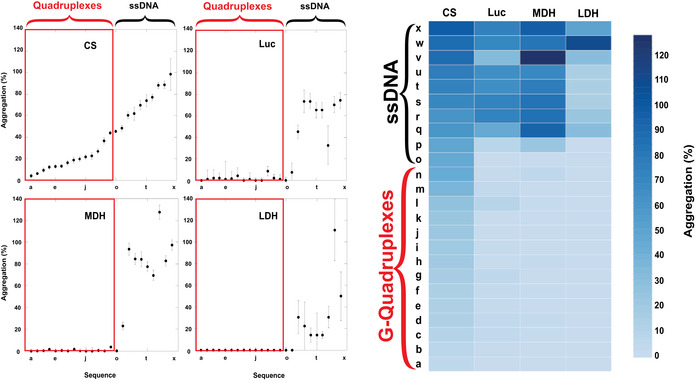
- C
Comparing holdase activity of different quadruplex‐containing sequences of known topology (Sundquist & Klug, 1989; Macaya et al, 1993; Simonsson et al, 1998; Haider et al, 2002; Phan et al, 2004; Ambrus et al, 2005; Renčiuk et al, 2009; Butovskaya et al, 2018; Sengar et al, 2019). Error bars are mean ± SE of technical triplicate.
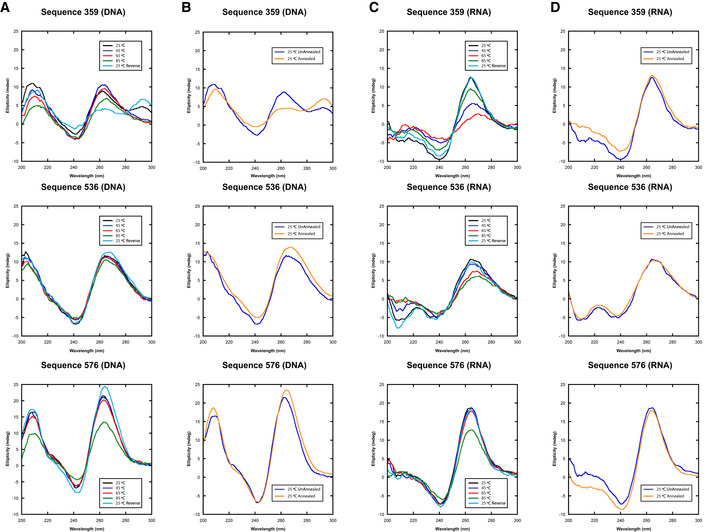
- A, C
The thermal stability of quadruplex‐containing sequences as measured by CD spectroscopy where each line represents a wavelength scan at the indicated temperature.
- B, D
The secondary structure of the same quadruplex‐containing sequences at 25°C prior to annealing or after annealing at 25°C.
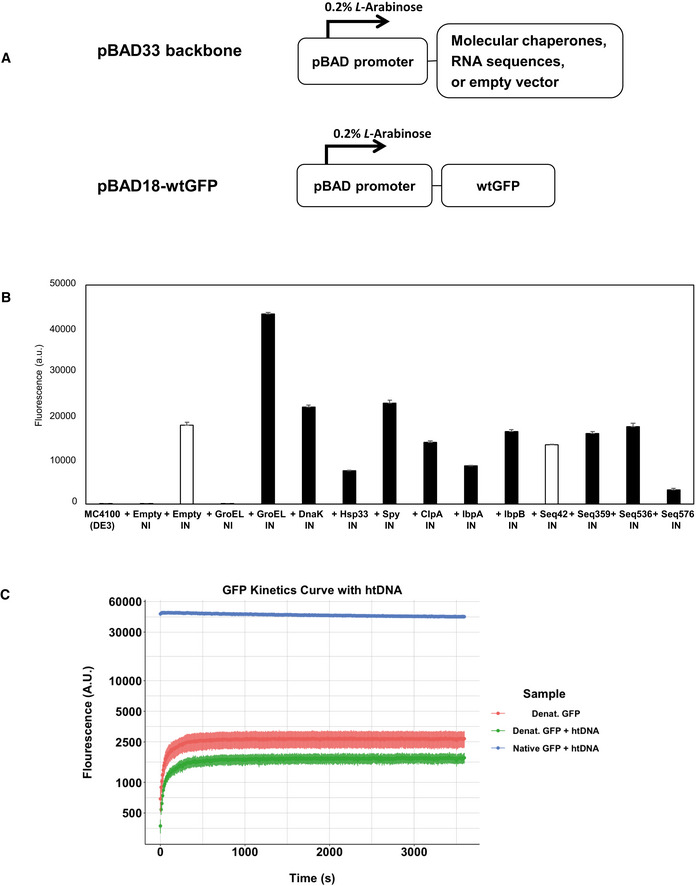
- A
Expression vector constructs. Both vectors are under the control of pBAD promoter, which is induced by 0.2% L‐Arabinose.
- B
Cellular fluorescence assay of wtGFP in the presence or absence of protein folding enhancing factors. White bars (+Empty IN and +Seq42) represent negative controls. The data are presented as mean ± SD (n = 3) of technical triplicate.
- C
In vitro refolding of wtGFP in the presence or absence of htDNA. GFP refolding curve assessing the fluorescence of GFP over a 60‐minute incubation period, with denatured GFP both in the presence of htDNA (n = 6) and absence of htDNA (n = 6). Non‐denatured GFP (Native) with htDNA (n = 4) was used as a control. Data are displayed as the mean of each experimental condition normalized to the blank with error bars represented as the Standard Error. All samples tested with technical replicates.
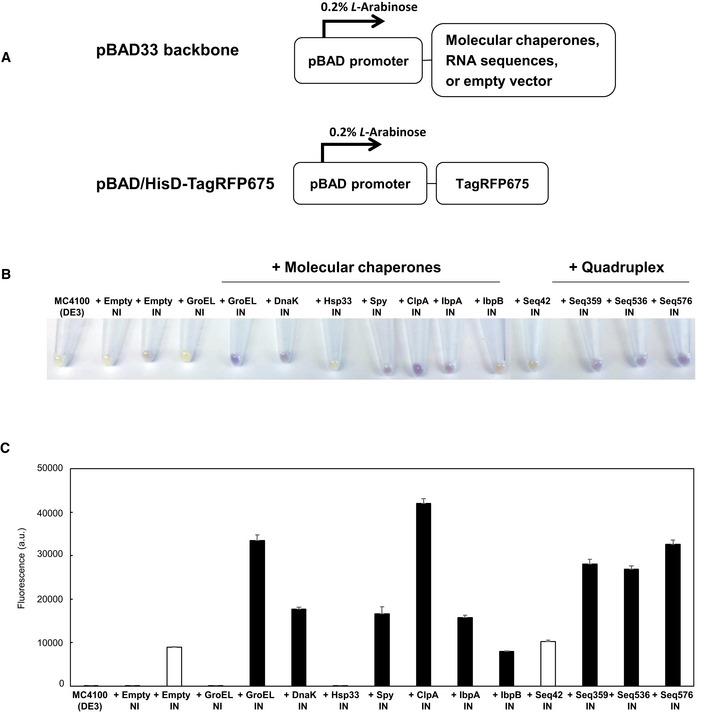
- A
A schematic illustration of expression vectors. Both the expression of protein folding enhancing factors and TagRFP675 are under the control of pBAD promoter, which is induced by 0.2% L‐Arabinose.
- B
Harvested cells. Empty vector (negative control), molecular chaperones (GroEL, DnaK, Hsp33, Spy, ClpA, IbpA, and IbpB), and selected RNA sequences (Seq42, Seq359, Seq536, and Seq576) were used as protein folding enhancers. NI and IN indicate: non‐induced and induced, respectively.
- C
Cellular fluorescence assay of TagRFP675 with various protein folding enhancing factors. Protein expression was induced at 42°C, and the fluorescence of each sample was measured with spectrophotometer. White bars (+Empty IN and + Seq42) indicate negative controls. The data are shown as mean ± SD of technical triplicates (n = 3).
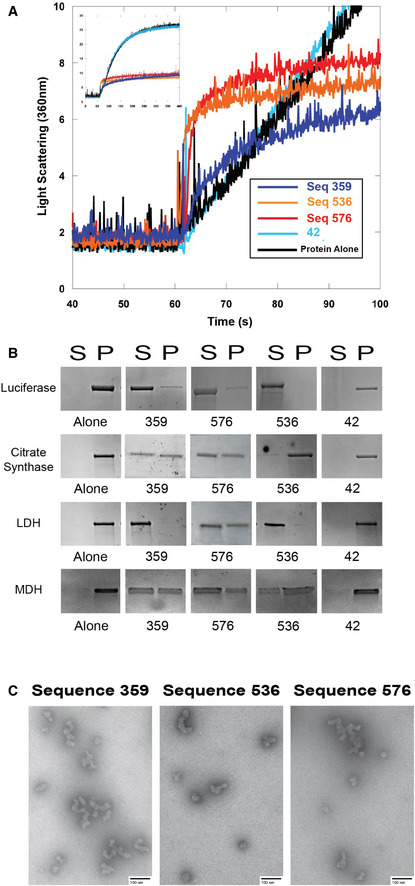
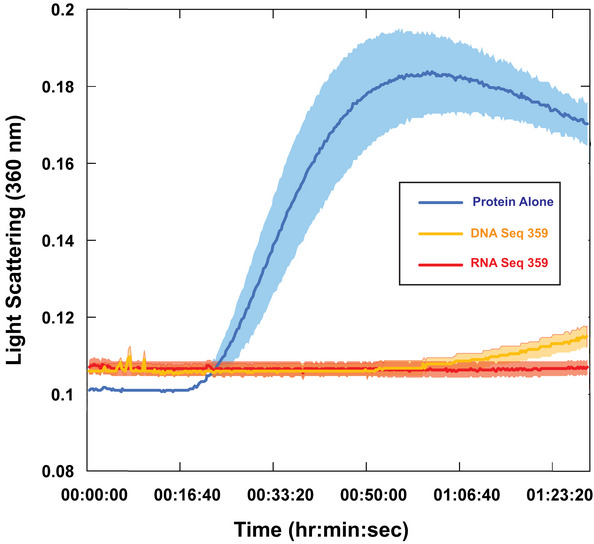
- A
Right angle light scattering of chemically induced aggregation of citrate synthase. Initial kinetics of aggregation shown with full time scale as the insert.
- B
Spin‐down assay with four different proteins denatured at 60°C in the presence of DNA. S represents the soluble fraction while the P represents the insoluble fraction or pellet.
- C
Transmission electron microscopy negative stain images of soluble fractions from thermally induced aggregation spin‐down assays. Citrate synthase oligomers were observed in each of the quadruplex cases, although the morphology of the quadruplex was dependent on the DNA sequence. Corresponding thermal denaturation spin‐down assays are shown in panel (B). Scale bar is 100 nm.
References
-
- Alriquet M, Martínez‐Limón A, Hanspach G, Hengesbach M, Tartaglia GG, Calloni G, Vabulas RM (2019) Assembly of proteins by free RNA during the early phase of proteostasis stress. J Proteome Res 18: 2835–2847 - PubMed
-
- Ambrus A, Chen D, Dai J, Jones RA, Yang D (2005) Solution structure of the biologically relevant G‐quadruplex element in the human c‐MYC promoter. Implications for G‐quadruplex stabilization. Biochemistry 44: 2048–2058 - PubMed
Publication types
MeSH terms
Substances
Grants and funding
LinkOut - more resources
Full Text Sources
Other Literature Sources
Miscellaneous
