

Optical microangiography reveals temporal and depth-resolved hemodynamic change in mouse barrel cortex during whisker stimulation
- PMID: 32945154
- PMCID: PMC7495356
- DOI: 10.1117/1.JBO.25.9.096005
Optical microangiography reveals temporal and depth-resolved hemodynamic change in mouse barrel cortex during whisker stimulation
Abstract
Significance: Cerebral blood flow (CBF) regulation at neurovascular coupling (NVC) plays an important role in normal brain functioning to support oxygen delivery to activating neurons. Therefore, studying the mechanisms of CBF adjustment is crucial for the improved understanding of brain activity.
Aim: We investigated the temporal profile of hemodynamic signal change in mouse cortex caused by neural activation and its variation over cortical depth.
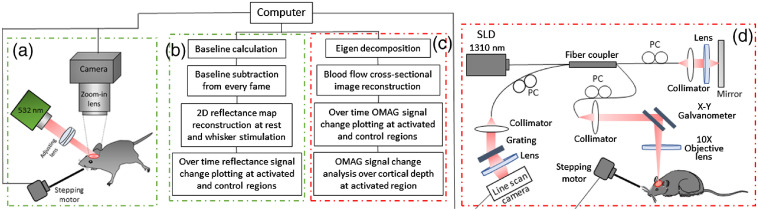
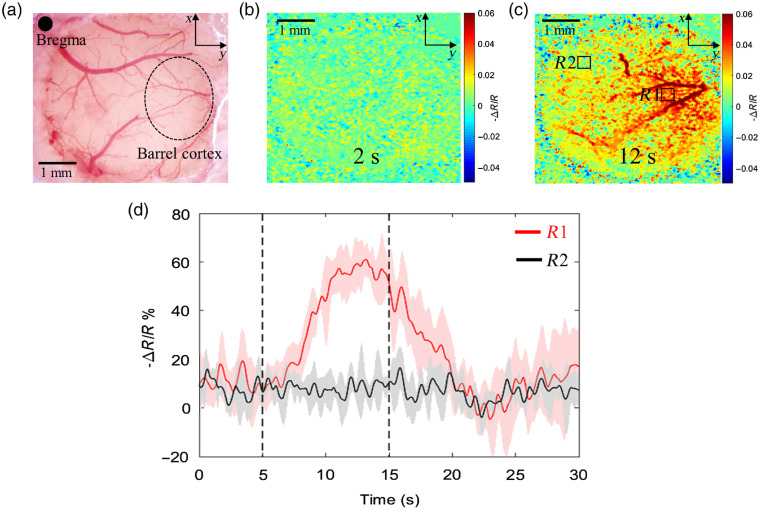
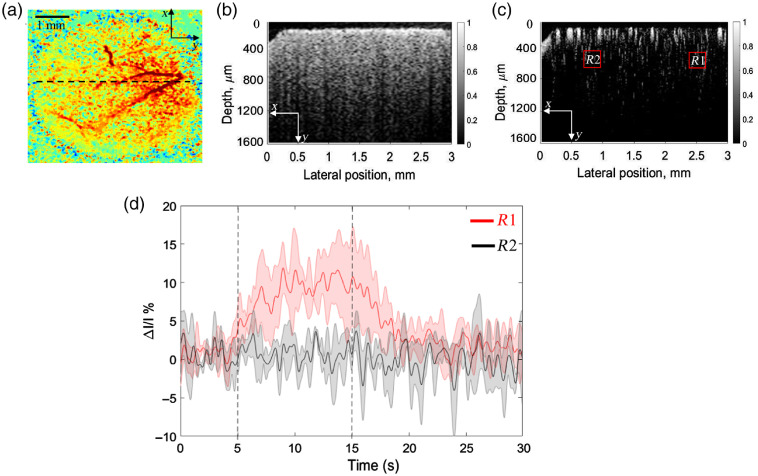
Approach: Following the cranial window surgery, intrinsic optical signal imaging (IOSI) was used to spatially locate the activated region in mouse cortex during whisker stimulation. Optical microangiography (OMAG), the functional extension of optical coherence tomography, was applied to image the activated and control regions identified by IOSI. Temporal profiles of hemodynamic response signals obtained by IOSI and OMAG were compared, and OMAG signal was analyzed over cortical layers.
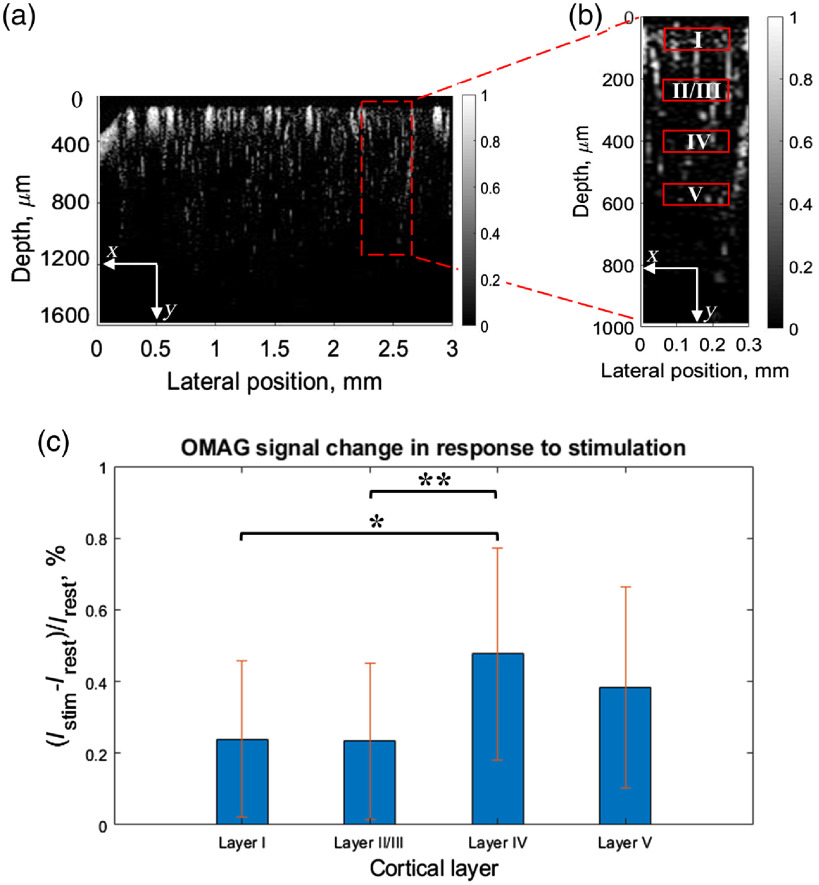
Results: Our results showed that the hemodynamic response to neural activity revealed by blood flow change signal signal through IOSI is slower than that observed by OMAG signal. OMAG also indicated the laminar variation of the response over cortical depth, showing the largest response in cortical layer IV.
Conclusions: Overall, we demonstrated the development and application of dual-modality imaging system composed of IOSI and OMAG, which may have potential to enable the future investigations of depth-resolved CBF and to provide the insights of hemodynamic events associated with the NVC.
Keywords: cerebral blood flow; hemodynamic response; intrinsic optical signal imaging; neurovascular coupling; optical coherence tomography; optical microangiography.
Figures
Similar articles
-
Functional evaluation of hemodynamic response during neural activation using optical microangiography integrated with dual-wavelength laser speckle imaging.J Biomed Opt. 2014 Feb;19(2):026013. doi: 10.1117/1.JBO.19.2.026013. J Biomed Opt. 2014. PMID: 24549439 Free PMC article.
-
Impact of Altered Cholinergic Tones on the Neurovascular Coupling Response to Whisker Stimulation.J Neurosci. 2017 Feb 8;37(6):1518-1531. doi: 10.1523/JNEUROSCI.1784-16.2016. Epub 2017 Jan 9. J Neurosci. 2017. PMID: 28069927 Free PMC article.
-
Differences in cerebral blood vasculature and flow in awake and anesthetized mouse cortex revealed by quantitative optical coherence tomography angiography.J Neurosci Methods. 2021 Apr 1;353:109094. doi: 10.1016/j.jneumeth.2021.109094. Epub 2021 Feb 5. J Neurosci Methods. 2021. PMID: 33549637 Free PMC article.
-
Neuronal units linked to microvascular modules in cerebral cortex: response elements for imaging the brain.Cereb Cortex. 1996 Sep-Oct;6(5):647-60. doi: 10.1093/cercor/6.5.647. Cereb Cortex. 1996. PMID: 8921201 Review.
-
Submillimeter-resolution fMRI: Toward understanding local neural processing.Prog Brain Res. 2016;225:123-52. doi: 10.1016/bs.pbr.2016.03.003. Epub 2016 Apr 1. Prog Brain Res. 2016. PMID: 27130414 Review.
Cited by
-
Optical coherence tomography (OCT) and OCT angiography: Technological development and applications in brain science.Theranostics. 2025 Jan 1;15(1):122-140. doi: 10.7150/thno.97192. eCollection 2025. Theranostics. 2025. PMID: 39744229 Free PMC article. Review.
-
Neurophotonic tools for microscopic measurements and manipulation: status report.Neurophotonics. 2022 Jan;9(Suppl 1):013001. doi: 10.1117/1.NPh.9.S1.013001. Epub 2022 Apr 27. Neurophotonics. 2022. PMID: 35493335 Free PMC article.
References
-
- Frostig R. D., et al. , “Using light to probe the brain: intrinsic signal optical imaging,” Int. J. Imaging Syst. Technol. 6(2–3), 216–224 (1995).IJITEG10.1002/ima.1850060212 - DOI
