

Reprogrammed mRNA translation drives resistance to therapeutic targeting of ribosome biogenesis
- PMID: 32945574
- PMCID: PMC7604608
- DOI: 10.15252/embj.2020105111
Reprogrammed mRNA translation drives resistance to therapeutic targeting of ribosome biogenesis
Abstract
Elevated ribosome biogenesis in oncogene-driven cancers is commonly targeted by DNA-damaging cytotoxic drugs. Our previous first-in-human trial of CX-5461, a novel, less genotoxic agent that specifically inhibits ribosome biogenesis via suppression of RNA polymerase I (Pol I) transcription, revealed single-agent efficacy in refractory blood cancers. Despite this clinical response, patients were not cured. In parallel, we demonstrated a marked improvement in the in vivo efficacy of CX-5461 in combination with PI3K/AKT/mTORC1 pathway inhibitors. Here, we reveal the molecular basis for this improved efficacy observed in vivo, which is associated with specific suppression of translation of mRNAs encoding regulators of cellular metabolism. Importantly, acquired resistance to this cotreatment is driven by translational rewiring that results in dysregulated cellular metabolism and induction of a cAMP-dependent pathway critical for the survival of blood cancers including lymphoma and acute myeloid leukemia. Our studies thus identify key molecular mechanisms underpinning the response of blood cancers to selective inhibition of ribosome biogenesis and define metabolic vulnerabilities that will facilitate the rational design of more effective regimens for Pol I-directed therapies.
Keywords: RNA Polymerase I inhibitor; cAMP-EPAC1/2 pathway; hematological cancers; metformin; ribosome biogenesis and function.
© 2020 The Authors. Published under the terms of the CC BY NC ND 4.0 license.
Conflict of interest statement
G.A. McArthur reports receiving commercial research grants from Celgene, Novartis, and Ventana and is a consultant/advisory board member for Provectus. R.D. Hannan is a consultant/advisory board member for Pimera, Inc. No potential conflicts of interest were disclosed by the other authors.
Figures
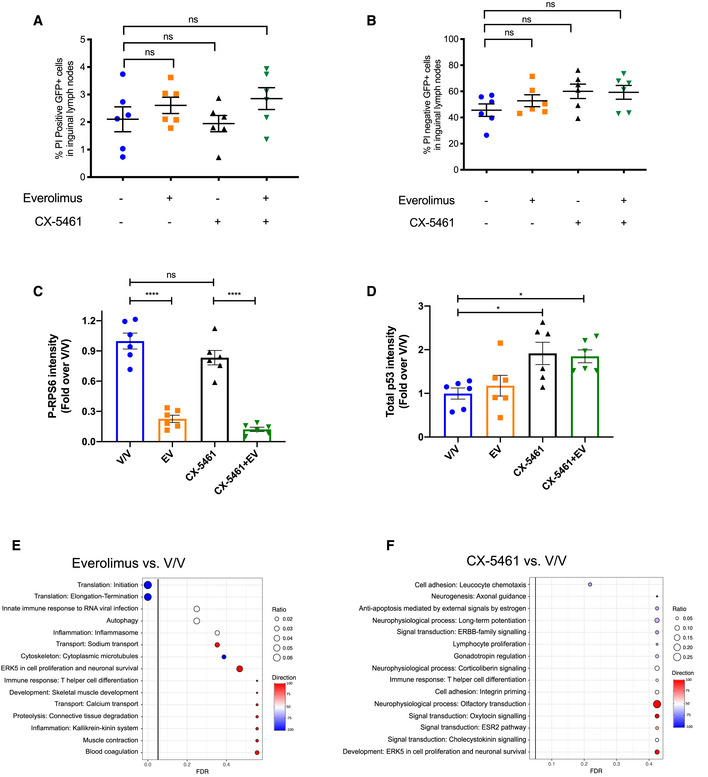
- A, B
Flow cytometry analysis of inguinal lymph node cells that are (A) GFP‐positive and propidium iodide‐positive and (B) GFP‐positive and propidium iodide‐negative isolated from C57BL/6 mice with transplanted Eμ‐Myc lymphoma cells treated as indicated for 2 h. 10,000 viable cells of the correct morphology were collected for each sample. Graphs represent mean ± SEM of n = 6.
- C, D
Quantitation of (C) phosphorylated RPS6 levels normalized to total RPS6 and (D) p53 protein levels normalized to actin in Fig 1A. Graphs represent mean ± SEM of n = 6.
- E, F
Enrichment analysis by MetaCore® GeneGO of genes in “translation up” and “translation down” categories identified by anota2seq analysis comparing lymph node cells isolated from mice in (E) everolimus single‐agent treatment group or (F) CX‐5461 single‐agent treatment group with those isolated from mice in vehicle group (n = 6). “Ratio” is the value obtained by dividing the number of genes in an indicated molecular process that is found in our data with the number of genes curated in MetaCore®'s database. “Direction” visualizes the percentage of genes associated with indicated pathways that are up (red) or down (blue).
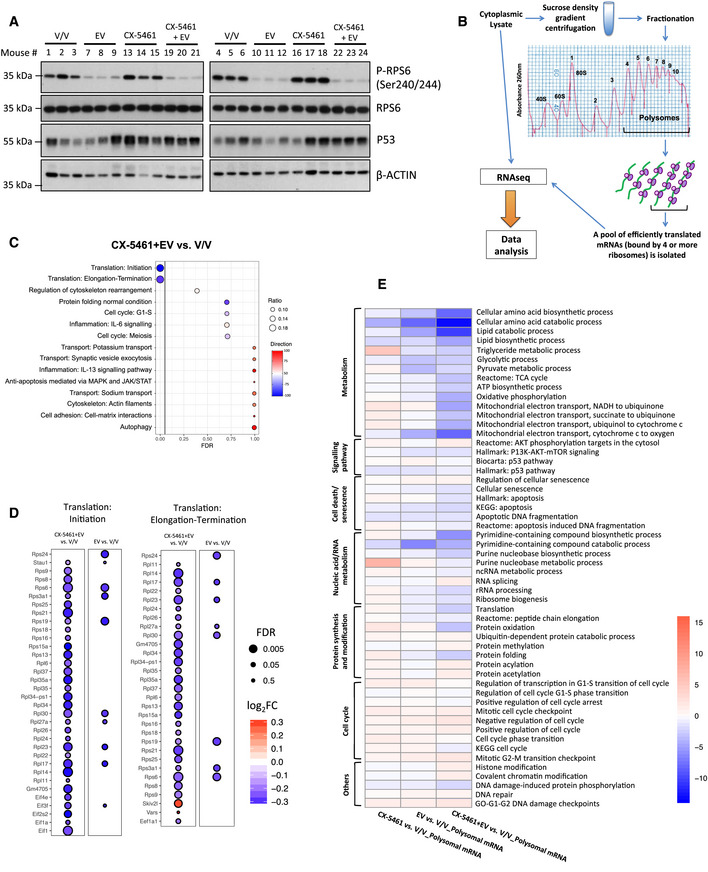
Western analysis for on‐target effects for everolimus (EV, P‐RPS6) and CX‐5461 (p53). Each lane represents equal amounts of protein from lymph node tissue isolated from a single mouse that received drug vehicles (everolimus vehicle: 1% methylcellulose; CX‐5461 vehicle: 25 mM NaH2PO4; V/V; mouse #1–6), 5 mg/kg everolimus (EV; mouse #7–12), 35 mg/kg CX‐5461 (mouse #13–18), or both drugs (CX‐5461 + EV; mouse #19–24) for 2 h (n = 6 per treatment group). Actin was used as a loading control.
A schematic illustration of the polysome profiling analysis workflow: Cytoplasmic lysate was layered on top of a linear 10–40% sucrose gradient, ultracentrifuged (222,228 g, 2¼ h at 4°C using SW41Ti rotor), and fractionated using the Foxy Jr Fraction Collector with constant monitoring of absorbance at 260 (A260) nm by an ISCO UA‐6 Absorbance Detector. Fractions (one fraction per minute: 800 μl per tube) corresponding to polysomal mRNAs that were bound by four or more ribosomes were pooled and analyzed by RNA‐seq followed by data analysis using anota2seq or limma.
Enrichment analysis by MetaCore® GeneGO of genes in “translation up” (red) and “translation down” (blue) categories identified by anota2seq analysis comparing lymph node cells isolated from mice in CX‐5461 + EV treatment group with the V/V group (n = 6). “Ratio” values were obtained by dividing the number of significant genes in our data assigned to a molecular process by the total number of genes in the process in MetaCore®'s database.
Genes implicated in “Translation: initiation” and “Translation: Elongation‐Termination” processes based on Fig 1C and Fig EV1E. log2FC: log2 fold change; FDR: false discovery rate (adjusted P value).
Activity levels of key biological processes involved in cellular growth, proliferation, and metabolism based on single sample gene set enrichment analysis (ssGSEA) of indicated comparisons. Percentage increase (red) or decrease (blue) in the activity levels of key biological processes involved in cellular growth, proliferation, and metabolism based on ssGSEA of indicated comparisons. Data were obtained from n = 6 mice per treatment group.
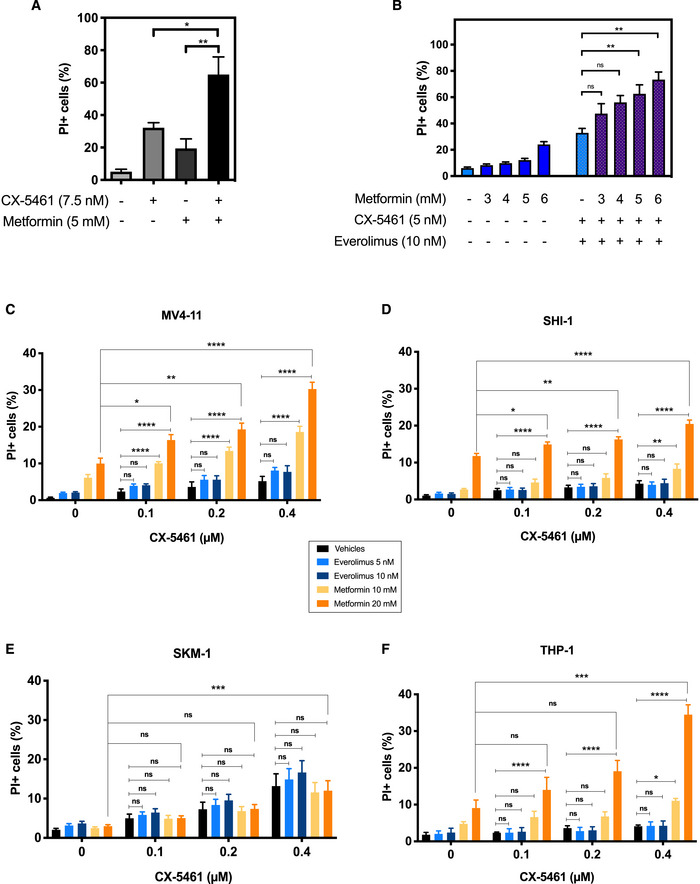
- A
Propidium iodide (PI) exclusion analysis of Eμ‐Myc lymphoma cells treated with CX‐5461 in the presence and absence of metformin for 48 h. Graphs represent mean ± SEM of n = 3 experiments, and data were analyzed by one‐way ANOVA.
- B
PI exclusion analysis of Eμ‐Myc lymphoma cells treated with CX‐5461 + EV in the presence and absence of metformin as indicated for 48 h. Graphs represent mean ± SEM of n = 3 experiments, and data were analyzed by Student's t‐test.
- C–F
PI exclusion analysis of (C) MV4‐11, (D) SHI‐1, (E) SKM‐1, and (F) THP‐1 human acute myeloid leukemia cell lines in response to treatments with CX‐5461, everolimus (EV), and metformin as indicated for 72 h. Graphs represent mean ± SEM of n = 4–6, and data were analyzed by two‐way ANOVA.
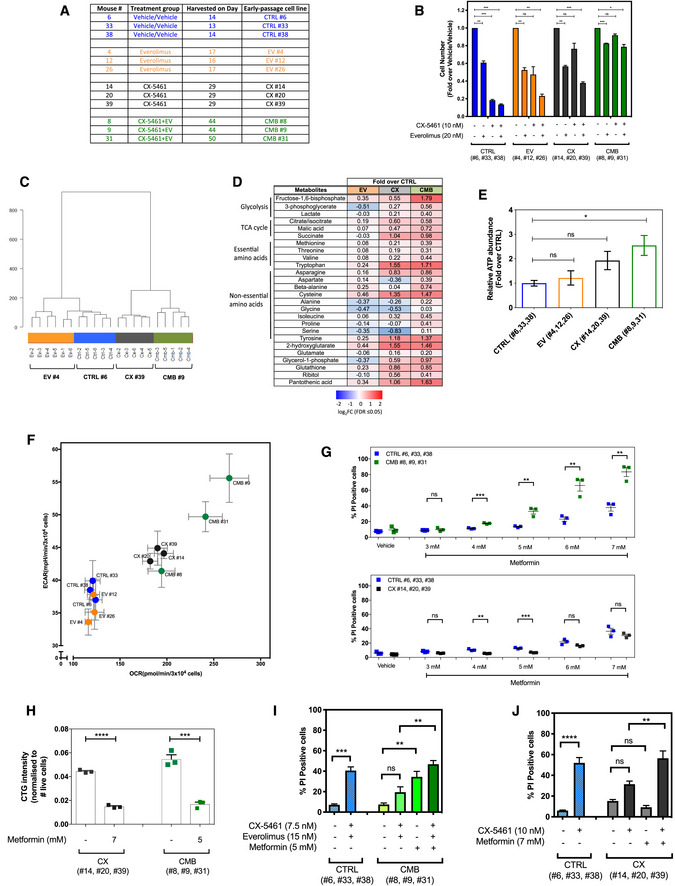
The early passage Eμ‐Myc lymphoma cells used in this study, which were established from mice that were drug‐naïve (“CTRL” cell lines), previously treated with everolimus (“EV” cell lines) or CX‐5461 (“CX” cell lines) alone, or combination of both (“CMB” cell lines). Harvest day indicates the number of days post‐transplantation of lymphoma cells.
Cell viability analysis of the indicated early passage Eμ‐Myc lymphoma cells treated with indicated compound(s) for 48 h as determined by Beckman® Coulter counter. Graphs represent mean ± SEM of n = 3. Data were analyzed by two‐way ANOVA.
Hierarchical clustering analysis of metabolomics data obtained from gas chromatography (GC)–mass spectrometry (MS) analysis of early passage cell lines (n = 5–6).
Steady‐state abundance of indicated metabolites (fold‐over CTRL cells; FDR ≤ 0.05; n = 5–6).
Intracellular ATP levels determined using the liquid chromatography–mass spectrometry in CTRL, EV, CX, and CMB early passage cell lines. Graphs represent mean ± SEM of n = 3.
Basal extracellular acidification rate (ECAR) and oxygen consumption rate (OCR) in the early passage cell lines determined using the Seahorse XF96 Extracellular Flux Analyzer; graphs represent mean ± SEM of 6–8 technical replicates for each biological replicate (n = 3).
Propidium iodide (PI) exclusion analysis of early passage CX‐5461-everolimus combination therapy‐resistant (CMB), CX‐5461-resistant (CX), and drug‐naïve (CTRL) lymphoma cells treated with indicated concentrations of metformin for 48 h. Graphs represent mean ± SEM of n = 3.
CellTiterGLO®‐based assay measuring cellular ATP levels of the CX-5461‐resistant (CX) and CX-5461‐everolimus combination therapy‐resistant (CMB) cells treated with metformin as indicated for 48 h. Graphs represent mean ± SEM of n = 3.
PI analysis of CTRL and CMB cells treated with CX‐5461 and everolimus in the presence and absence of metformin for 48 h as indicated. Graphs represent mean ± SEM of n = 3.
PI analysis of CTRL and CX cells treated with CX‐5461 in the presence and absence of metformin for 48 h as indicated. Graphs represent mean ± SEM of n = 3.
- A
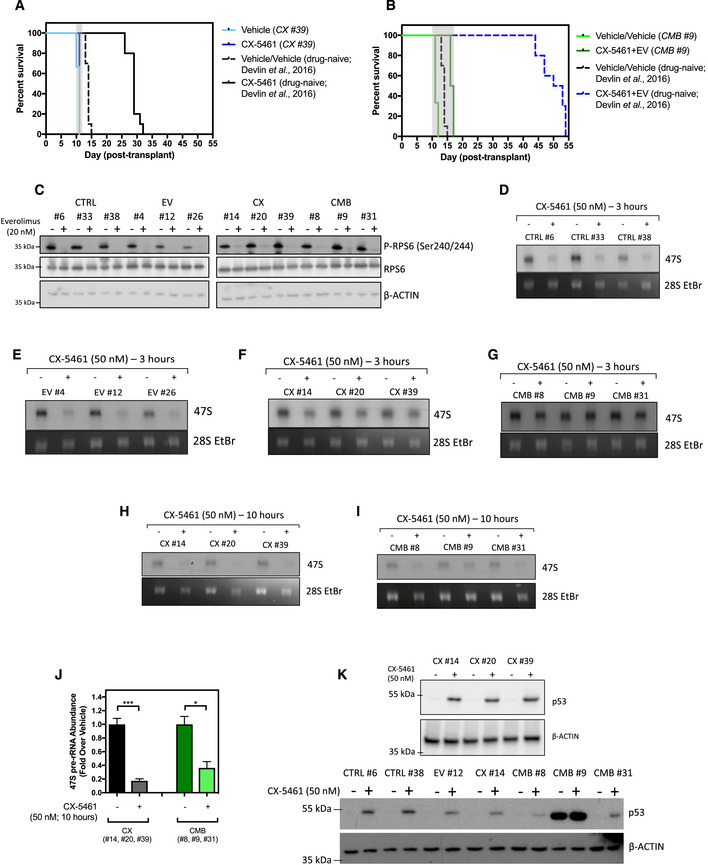
Kaplan–Meier curve of C57BL/6 mice transplanted with the CX-5461‐resistant CX #39 early passage Eμ‐Myc lymphoma cells treated with CX‐5461 (35 mg/kg every 3 days; n = 5–6). Survival curves of drug‐naïve cells were actual data reproduced from Devlin et al, 2016.
- B
Kaplan–Meier curve of C57BL/6 mice transplanted with CX‐5461 + EV‐resistant CMB #9 early passage cells treated with CX‐5461 (35 mg/kg every 3 days) and everolimus (5 mg/kg daily; n = 5–6). Survival curves of drug‐naïve cells were actual data reproduced from Devlin et al, 2016.
- C
Western blot analysis of markers for the on‐target effect of 20 nM everolimus treatment for 3 h, specifically phosphorylation of RPS6 at Serine 240/244 residues and total RPS6 (n = 3). Actin was used as a loading control.
- D–J
Synthesis rates of 47S pre‐rRNAs in (D) drug‐naïve (CTRL), (E) everolimus‐resistant (EV), (F) CX-5461‐resistant (CX), and (G) CX‐5461 + EV‐resistant (CMB) cell lines in response to 3‐h 50 nM CX‐5461 treatment were determined by 32P‐orthophosphate “pulse” labeling. Synthesis rate of 47S pre‐rRNAs in (H) CX and (I) CMB cell lines in response to 10‐h 50 nM CX‐5461 was determined by 32P‐orthophosphate “pulse” labeling and (J) its quantitation (n = 3). (D–I) 28S rRNA abundance was used as a loading control. EtBr: ethidium bromide. Data were analyzed by Student's t‐test. Graphs represent mean ± SEM of n = 3. *P ≤ 0.05. ***P ≤ 0.001.
- K
Western blot analysis for p53 abundance in response to 50 nM CX‐5461 treatment for 3 h. Actin was used as a loading control (n = 2–3).
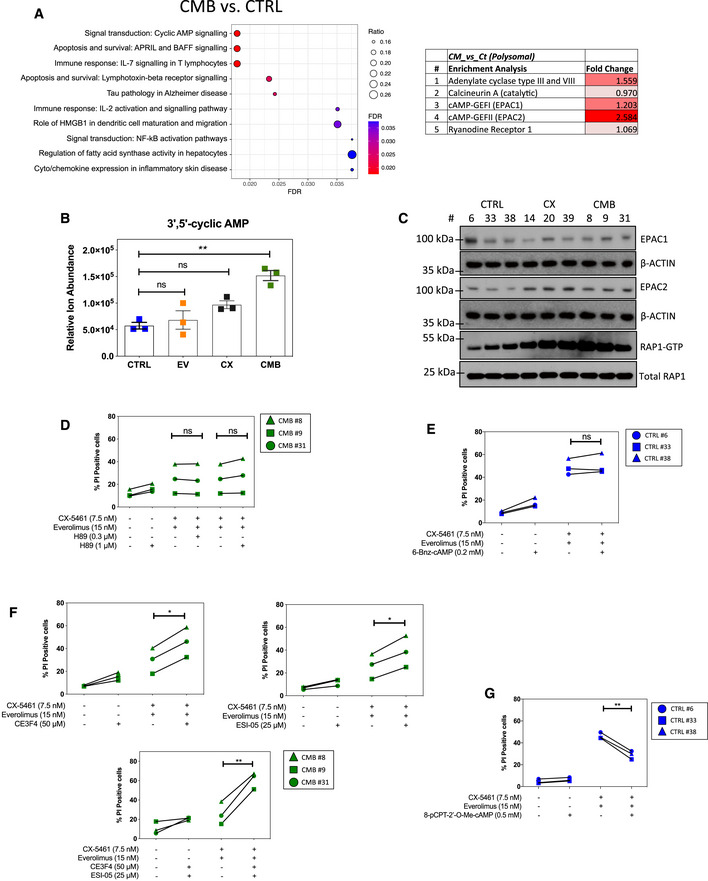
Enrichment analysis by GeneGO MetaCore® of the polysomal RNA‐seq data comparing CX‐5461 + EV‐resistant (CMB) and drug‐naïve cells (CTRL; n = 3; false discovery rate (FDR) ≤ 0.05; fold change (FC) ≥ 1.5 or ≤ ‐1.5).
Abundance of intracellular 3'5’‐cyclic AMP as measured by a liquid chromatography (LC)–mass spectrometry (MS) analysis. Graphs represent mean ± SEM of n = 3 (5–6 technical replicates each). Data were analyzed by one‐way ANOVA. CTRL vs. EV, P = 0.8951; CTRL vs. CX, P = 0.0871; CTRL vs. CMB, P = 0.0012.
Western analysis of EPAC1 and EPAC2 abundance, as well as active GTP‐bound RAP1 levels in the indicated early passage cells during their log‐phase growth period (n = 3). Actin and total RAP1 were used as loading controls. Quantitations of the blots are shown in Appendix Fig S3A–C.
Propidium iodide (PI) exclusion assays of CMB cells treated with CX‐5461 and everolimus as indicated in the presence or absence of a selective PKA inhibitor H89 for 48 h.
PI exclusion analysis of early passage drug‐naïve (CTRL) lymphoma cells treated with CX‐5461 and everolimus in the presence or absence of selective PKA activator 6‐Bnz-cAMP for 48 h.
PI exclusion analysis of the CMB cells treated with CX‐5461 and everolimus as indicated in the presence or absence of EPAC1 inhibitor CE3F4 or EPAC2 inhibitor ESI‐05 for 48 h.
PI exclusion analysis of early passage drug‐naïve (CTRL) cells treated with CX‐5461 and everolimus in the presence or absence of the selective EPAC activator 8‐pCPT-2‐O-Me-cAMP for 48 h.
- A
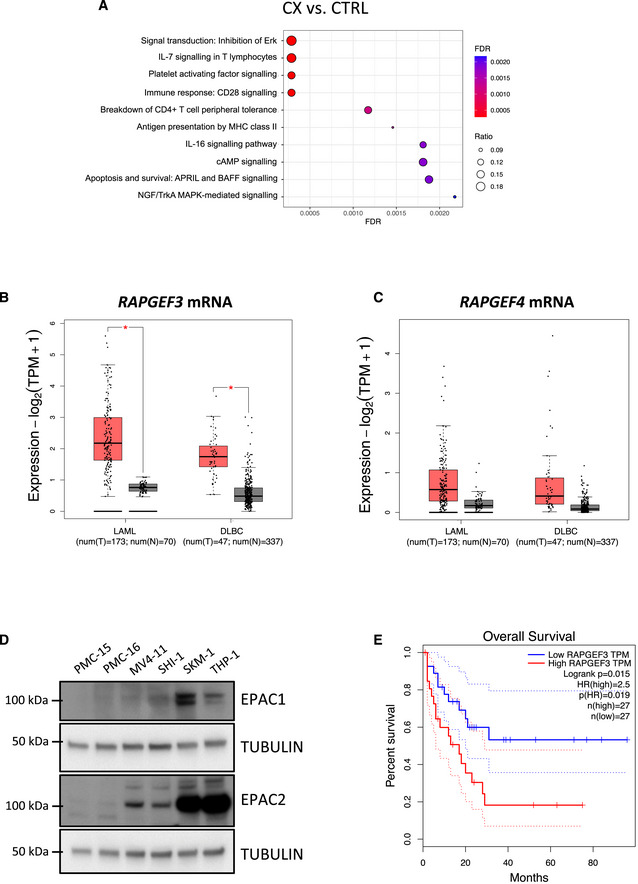
Enrichment analysis by GeneGO MetaCore® of the polysomal RNA‐seq data comparing CX‐5461‐resistant (CX) and drug‐naïve cells (CTRL; n = 3; false discovery rate (FDR) ≤ 0.05; fold change (FC) ≥ 1.5 or ≤ ‐1.5).
- B, C
Median mRNA expression levels of (B) RAPGEF3 (mRNA encoding EPAC1 protein) and (C) RAPGEF4 (mRNA encoding EPAC2 protein) generated by gene expression profiling interactive analysis (GEPIA) bioinformatics web tool based on The Cancer Genome Atlas (TCGA) database. LAML: acute myeloid leukemia (tumor, n = 173; normal, n = 70). DLBC: diffuse large B‐cell lymphoma (tumor, n = 47; normal, n = 337). Red: tumor, black: normal. The central band corresponds to the median. The lower and upper hinges correspond to the first and third quartiles (the 25th and 75th percentiles). The upper and lower whiskers extend from the hinges to the largest and smallest values no further than 1.5 * interquartile range from the hinges, respectively. Data points are plotted individually. Data were analyzed by one‐way ANOVA; *P < 0.05. tpm, transcript count per million.
- D
Western analysis of EPAC1 and EPAC2 abundance in white blood cell samples (isolated from healthy donors #PMC-15 and #PMC-16) versus MV4‐11, SHI‐1, SKM1, and THP1 human AML cell lines (representative of n = 2).
- E
Survival curves of AML patients with low and high EPAC1 (RAPGEF3; n = 27 each; cut‐off: 50%) generated by GEPIA based on TCGA database.
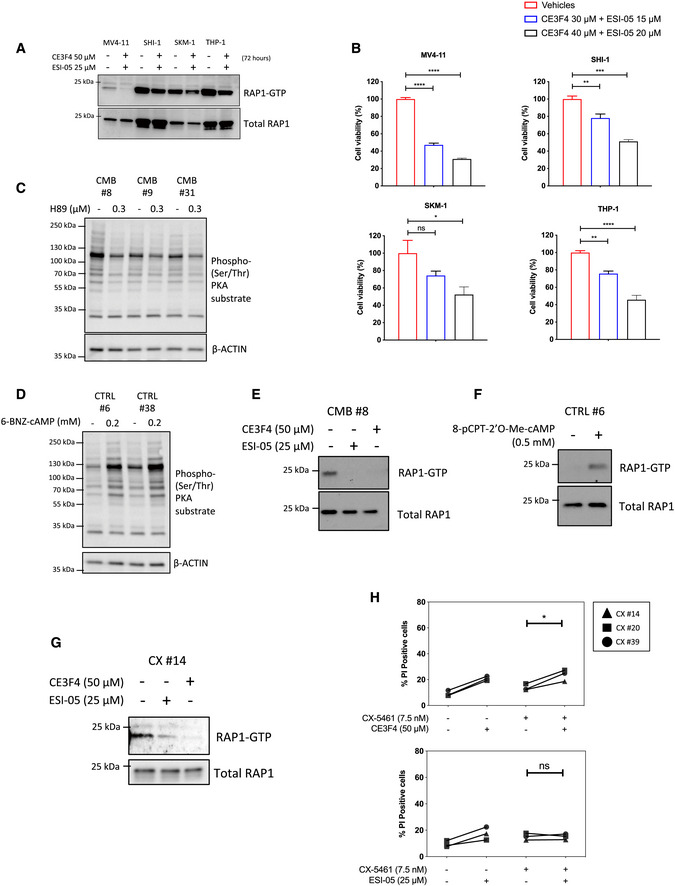
- A
Western analysis of the activated, GTP‐bound RAP1 of the indicated human AML cell lines following treatments with the EPAC1 inhibitor CE3F4 and EPAC2 inhibitor ESI‐05 for 72 h (representative of n = 2).
- B
CellTiterGLO®‐based viability assay of MV4‐11, SHI‐1, SKM‐1, and THP‐1 human AML cells treated as indicated for 72 h. Graphs represent mean ± SEM of n = 3. Data were analyzed by one‐way ANOVA.
- C, D
Western analysis of PKA activity using the phosphorylated PKA substrate antibody on whole cell extracts isolated from the indicated early passage cell lines treated for 24 h with (C) H89 (n = 3) or (D) 6‐BNZ-cAMP (representatives of n = 3). Actin was used as a loading control.
- E
Western analysis of the activated, GTP‐bound RAP1 of the early passage CX‐5461 + EV‐resistant (CMB) cell extracts isolated following treatments with indicated EPAC inhibitors for 24 h (representative of n = 2).
- F
Western analysis of activated, GTP‐bound RAP1 using early passage drug‐naive (CTRL) Eμ‐Myc lymphoma cell extracts isolated following treatments with the selective EPAC activator 8‐pCPT-2‐O-Me-cAMP for 24 h (n = 1).
- G
Western analysis of the activated, GTP‐bound RAP1 of the early passage CX‐5461-resistant (CX) cell extracts isolated following treatments with indicated EPAC inhibitors for 24 h (n = 1).
- H
PI exclusion analysis of the CX cells treated with CX‐5461 as indicated in the presence or absence of EPAC1 inhibitor CE3F4 or EPAC2 inhibitor ESI‐05 for 48 h. Data were analyzed by paired one‐way ANOVA. Graphs represent mean ± SEM of n = 3. Black triangle: CX-5461‐resistant (CX) cells clone #14, black square: CX cells clone #20, black circle: CX cells clone #39.
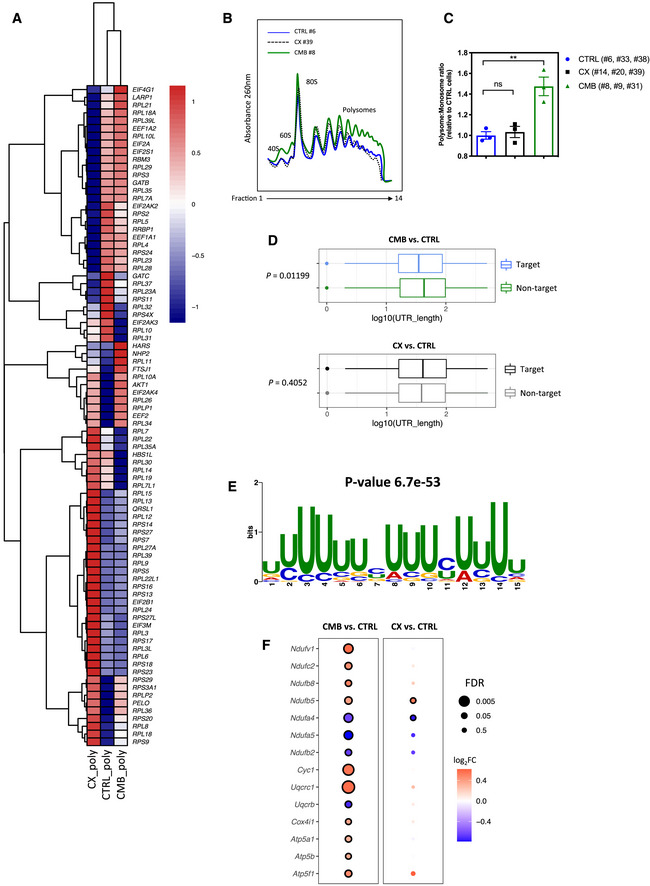
A heatmap illustrating the abundances of polysome‐associated mRNAs that are associated with the mRNA translation/protein synthesis based on the Gene Ontology Resource Database in drug‐naïve (CTRL) or CX-5461‐everolimus combination therapy‐resistant (CMB) cell lines (n = 3). The colors illustrate the expression values of indicated mRNAs that were normalized using voom (red: high expression; blue: low expression). Values represent the median gene expression levels across replicate samples.
Polysome profiles demonstrating increased ribosome abundance in CMB cells as compared to CTRL and CX-5461‐resistant (CX) cells (representatives of n = 3).
Quantitation of polysome:monosome ratio in the indicated early passage Eμ‐Myc lymphoma cells as determined by measuring the area under the curve using ImageJ software. Graph represents mean ± SEM of n = 3. Data were analyzed by one‐way ANOVA. ns, not significant; **P ≤ 0.01.
Length of the 5'UTR of mRNAs that are more actively translated by the CMB cells (as compared to CTRL cells) vs. non‐target mRNAs (n = 3). The central band corresponds to the median. The lower and upper hinges correspond to the first and third quartiles (the 25th and 75th percentiles). The upper and lower whiskers extend from the hinges to the largest and smallest values no further than 1.5 * interquartile range from the hinges, respectively. Data beyond the end of the whiskers are plotted individually. One‐sided Wilcoxon tests were used to determine significance.
The most significantly enriched motif in the 5'UTR of mRNAs that are more actively translated in the CMB cells compared to CTRL cells based on Multiple Em for Motif Elicitation (MEME) analysis (n = 3).
Polysomal abundance of mRNAs (selected based on a nominal P value < 0.01 cut‐off in either the CMB vs. CTRL or CX vs. CTRL as analyzed by limma) encoding components of mitochondrial oxidative phosphorylation based on polysome profiling data. Red denotes upregulation, and blue denotes downregulation (n = 3; genes with an adjusted P value (false discovery rate; FDR) ≤ 0.05 were considered to be significant and are denoted with a black border).
- A
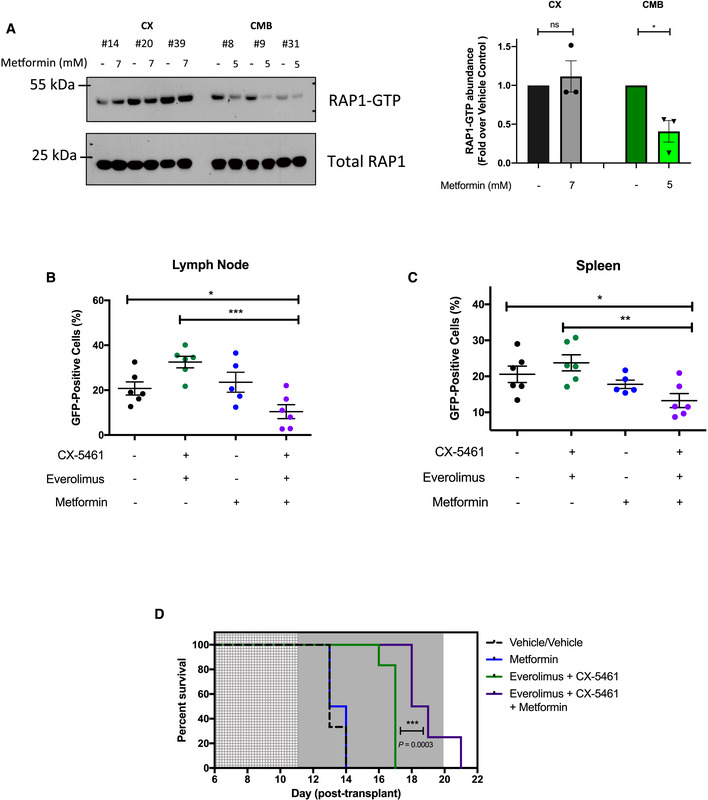
Western analysis demonstrating the effects of metformin treatment for 48 h on the levels of active GTP‐bound RAP1 in CX and CMB cells (n = 3) and its quantitation.
- B, C
Proportion of green fluorescent protein (GFP)‐positive CMB (clone #8) cells in (B) lymph node and (C) spleen of transplanted C57BL/6 mice treated as indicated for 6 h on day 12 post‐transplant. Graphs represent mean ± SEM of six mice per group.
- D
Kaplan–Meier curve of C57BL/6 mice transplanted with CX‐5461‐everolimus‐resistant (CMB #8) early passage Eμ‐Myc lymphoma cells treated with vehicles (everolimus vehicle: 1% methylcellulose; CX‐5461/metformin vehicle: 25 mM NaH2PO4; n = 6); CX‐5461 (35 mg/kg every twice weekly) and everolimus (5 mg/kg daily; n = 8), metformin (400 mg/kg twice daily; n = 6), or CX‐5461, everolimus and metformin (35 mg/kg twice weekly, 5 mg/kg daily and 400 mg/kg twice daily, respectively; n = 8). Light gray: 5‐day metformin pre‐treatment period, dark gray: treatment period. Data were analyzed by a log‐rank (Mantel–Cox) test. Vehicle vs. CX-5461‐everolimus: P = 0.0006, Vehicle vs. CX-5461‐everolimus‐metformin: P = 0.0001. CX-5461‐everolimus vs. CX-5461‐everolimus‐metformin: P = 0.0003.
Similar articles
-
Combination Therapy Targeting Ribosome Biogenesis and mRNA Translation Synergistically Extends Survival in MYC-Driven Lymphoma.Cancer Discov. 2016 Jan;6(1):59-70. doi: 10.1158/2159-8290.CD-14-0673. Epub 2015 Oct 21. Cancer Discov. 2016. PMID: 26490423
-
The Dual Inhibition of RNA Pol I Transcription and PIM Kinase as a New Therapeutic Approach to Treat Advanced Prostate Cancer.Clin Cancer Res. 2016 Nov 15;22(22):5539-5552. doi: 10.1158/1078-0432.CCR-16-0124. Epub 2016 Aug 2. Clin Cancer Res. 2016. PMID: 27486174
-
The nucleolus as a fundamental regulator of the p53 response and a new target for cancer therapy.Biochim Biophys Acta. 2015 Jul;1849(7):821-9. doi: 10.1016/j.bbagrm.2014.10.007. Epub 2014 Nov 11. Biochim Biophys Acta. 2015. PMID: 25464032 Review.
-
Combined inhibition of RNA polymerase I and mTORC1/2 synergize to combat oral squamous cell carcinoma.Biomed Pharmacother. 2021 Jan;133:110906. doi: 10.1016/j.biopha.2020.110906. Epub 2020 Nov 13. Biomed Pharmacother. 2021. PMID: 33190037
-
Dysregulated Ribosome Biogenesis Reveals Therapeutic Liabilities in Cancer.Trends Cancer. 2021 Jan;7(1):57-76. doi: 10.1016/j.trecan.2020.08.003. Epub 2020 Sep 15. Trends Cancer. 2021. PMID: 32948502 Review.
Cited by
-
Regulation of mRNA Translation by Hormone Receptors in Breast and Prostate Cancer.Cancers (Basel). 2021 Jun 29;13(13):3254. doi: 10.3390/cancers13133254. Cancers (Basel). 2021. PMID: 34209750 Free PMC article. Review.
-
Anota2seq Analysis for Transcriptome-Wide Studies of mRNA Translation.Methods Mol Biol. 2022;2418:243-268. doi: 10.1007/978-1-0716-1920-9_15. Methods Mol Biol. 2022. PMID: 35119670
-
Targeting the ribosome to treat multiple myeloma.Mol Ther Oncol. 2024 Feb 7;32(1):200771. doi: 10.1016/j.omton.2024.200771. eCollection 2024 Mar 21. Mol Ther Oncol. 2024. PMID: 38596309 Free PMC article.
-
Targeting ribosomes reprograms the tumour microenvironment and augments cancer immunotherapy.Br J Cancer. 2025 Jul 11. doi: 10.1038/s41416-025-03109-y. Online ahead of print. Br J Cancer. 2025. PMID: 40646287
-
Prioritizing key synergistic circulating microRNAs for the early diagnosis of biliary tract cancer.Front Oncol. 2022 Oct 6;12:968412. doi: 10.3389/fonc.2022.968412. eCollection 2022. Front Oncol. 2022. PMID: 36276146 Free PMC article.
References
-
- Bos JL (2006) Epac proteins: multi‐purpose cAMP targets. Trends Biochem Sci 31: 680–686 - PubMed
Publication types
MeSH terms
Substances
Grants and funding
- 1154540/Department of Health | National Health and Medical Research Council (NHMRC)
- 1106576/Department of Health | National Health and Medical Research Council (NHMRC)
- 1116999/Department of Health | National Health and Medical Research Council (NHMRC)
- 1058586/Department of Health | National Health and Medical Research Council (NHMRC)
- 1158732/Department of Health | National Health and Medical Research Council (NHMRC)
