Business Closures, Stay-at-Home Restrictions, and COVID-19 Testing Outcomes in New York City
- PMID: 32945766
- PMCID: PMC7553229
- DOI: 10.5888/pcd17.200264
Business Closures, Stay-at-Home Restrictions, and COVID-19 Testing Outcomes in New York City
Abstract
Introduction: In response to the coronavirus disease 2019 (COVID-19) pandemic, New York City closed all nonessential businesses and restricted the out-of-home activities of residents as of March 22, 2020. This order affected different neighborhoods differently, as stores and workplaces are not randomly distributed across the city, and different populations may have responded differently to the out-of-home restrictions. This study examines how the business closures and activity restrictions affected COVID-19 testing results. An evaluation of whether such actions slowed the spread of the pandemic is a crucial step in designing effective public health policies.
Methods: Daily data on the fraction of COVID-19 tests yielding a positive result at the zip code level were analyzed in relation to the number of visits to local businesses (based on smartphone location) and the number of smartphones that stayed fixed at their home location. The regression model also included vectors of fixed effects for the day of the week, the calendar date, and the zip code of residence.
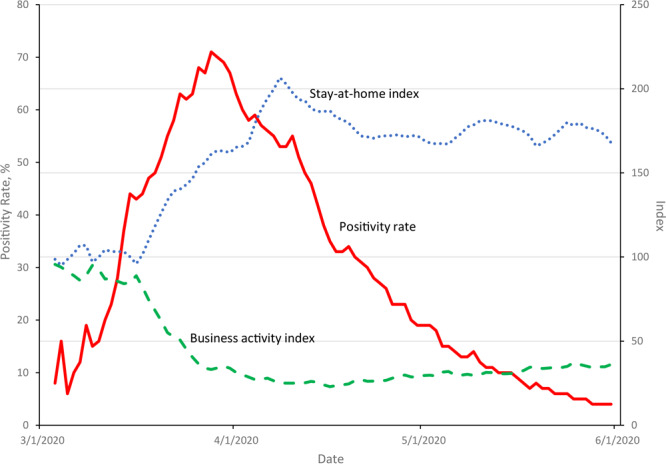
Results: A large number of visits to local businesses increased the positivity rate of COVID-19 tests, while a large number of smartphones that stayed at home decreased it. A doubling in the relative number of visits increases the positivity rate by about 12.4 percentage points (95% CI, 5.3 to 19.6). A doubling in the relative number of stay-at-home devices lowered it by 2.0 percentage points (95% CI, -2.9 to -1.2). The business closures and out-of-home activity restrictions decreased the positivity rate, accounting for approximately 25% of the decline observed in April and May 2020.
Conclusion: Policy measures decreased the likelihood of positive results in COVID-19 tests. These specific policy tools may be successfully used when comparable health crises arise in the future.
Figures
References
-
- New York City Department of Health and Mental Hygiene. Data files: testing.csv, tests.csv, and probable-confirmed-dod.csv. https://github.com/nychealth/coronavirus-data. Accessed April 1, 2020 and August 13, 2020.
-
- Borjas GJ. Demographic determinants of testing incidence and COVID-19 infections in New York City neighborhoods. Cambridge (MA): National Bureau of Economic Research; 2020. NBER Working Paper No. 26952.
-
- Schmitt-Grohé S, Teoh K, Uribe M. Covid-19: testing inequality in New York City. Covid Economics: Vetted and Real Time Papers 2020;(8):27–43. 10.3386/w27019 - DOI
-
- Chen Y, Jiao JJ, Bai S, Lindquist J. Modeling the spatial factors of COVID-19 in New York City. SSRN working paper, May 26, 2020.
MeSH terms
LinkOut - more resources
Full Text Sources
Medical
Miscellaneous