

Age at diagnosis, glycemic trajectories, and responses to oral glucose-lowering drugs in type 2 diabetes in Hong Kong: A population-based observational study
- PMID: 32946450
- PMCID: PMC7500681
- DOI: 10.1371/journal.pmed.1003316
Age at diagnosis, glycemic trajectories, and responses to oral glucose-lowering drugs in type 2 diabetes in Hong Kong: A population-based observational study
Abstract
Background: Lifetime glycemic exposure and its relationship with age at diagnosis in type 2 diabetes (T2D) are unknown. Pharmacologic glycemic management strategies for young-onset T2D (age at diagnosis <40 years) are poorly defined. We studied how age at diagnosis affects glycemic exposure, glycemic deterioration, and responses to oral glucose-lowering drugs (OGLDs).
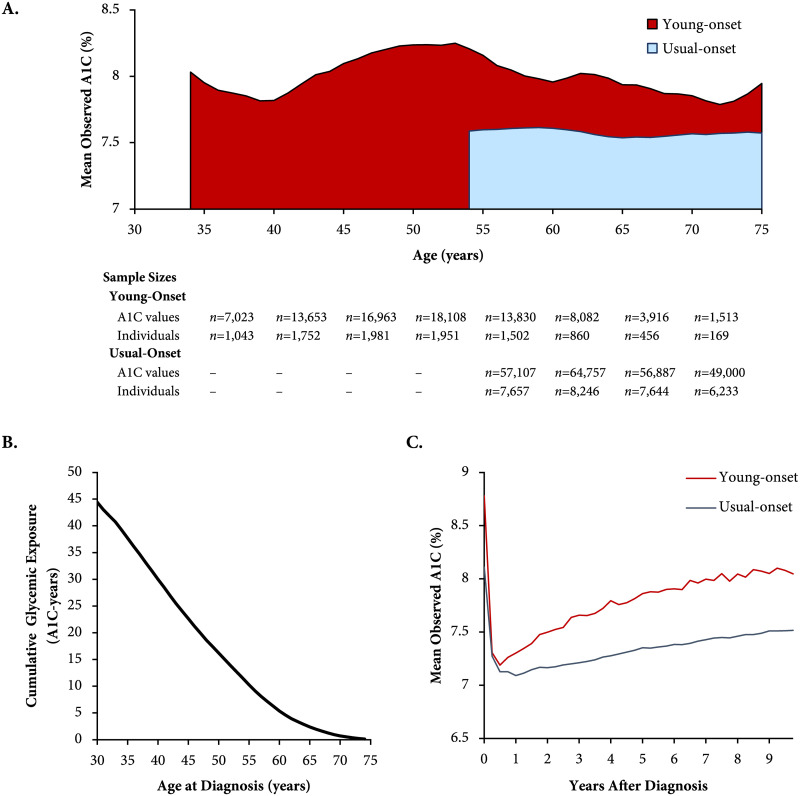
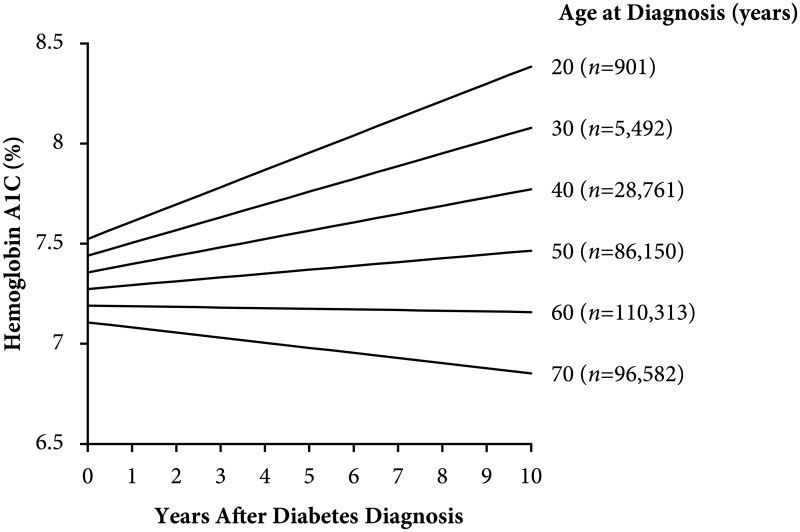
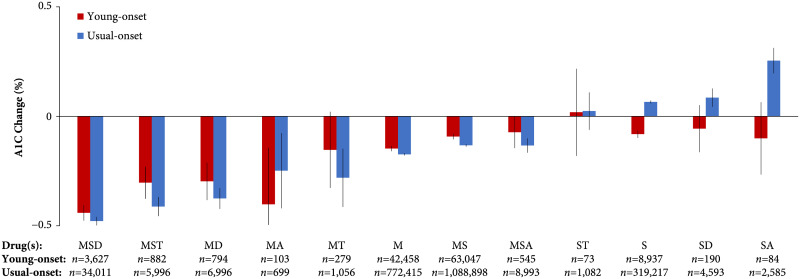
Methods and findings: In a population-based cohort (n = 328,199; 47.2% women; mean age 34.6 and 59.3 years, respectively, for young-onset and usual-onset [age at diagnosis ≥40 years] T2D; 2002-2016), we used linear mixed-effects models to estimate the association between age at diagnosis and A1C slope (glycemic deterioration) and tested for an interaction between age at diagnosis and responses to various combinations of OGLDs during the first decade after diagnosis. In a register-based cohort (n = 21,016; 47.1% women; mean age 43.8 and 58.9 years, respectively, for young- and usual-onset T2D; 2000-2015), we estimated the glycemic exposure from diagnosis until age 75 years. People with young-onset T2D had a higher mean A1C (8.0% [standard deviation 0.15%]) versus usual-onset T2D (7.6% [0.03%]) throughout the life span (p < 0.001). The cumulative glycemic exposure was >3 times higher for young-onset versus usual-onset T2D (41.0 [95% confidence interval 39.1-42.8] versus 12.1 [11.8-12.3] A1C-years [1 A1C-year = 1 year with 8% average A1C]). Younger age at diagnosis was associated with faster glycemic deterioration (A1C slope over time +0.08% [0.078-0.084%] per year for age at diagnosis 20 years versus +0.02% [0.016-0.018%] per year for age at diagnosis 50 years; p-value for interaction <0.001). Age at diagnosis ≥60 years was associated with glycemic improvement (-0.004% [-0.005 to -0.004%] and -0.02% [-0.027 to -0.0244%] per year for ages 60 and 70 years at diagnosis, respectively; p-value for interaction <0.001). Responses to OGLDs differed by age at diagnosis (p-value for interaction <0.001). Those with young-onset T2D had smaller A1C decrements for metformin-based combinations versus usual-onset T2D (metformin alone: young-onset -0.15% [-0.105 to -0.080%], usual-onset -0.17% [-0.179 to -0.169%]; metformin, sulfonylurea, and dipeptidyl peptidase-4 inhibitor: young-onset -0.44% [-0.476 to -0.405%], usual-onset -0.48% [-0.498 to -0.459%]; metformin and α-glucosidase inhibitor: young-onset -0.40% [-0.660 to -0.144%], usual-onset -0.25% [-0.420 to -0.077%]) but greater responses to other combinations containing sulfonylureas (sulfonylurea alone: young-onset -0.08% [-0.099 to -0.065%], usual-onset +0.06% [+0.059 to +0.072%]; sulfonylurea and α-glucosidase inhibitor: young-onset -0.10% [-0.266 to 0.064%], usual-onset: 0.25% [+0.196% to +0.312%]). Limitations include possible residual confounding and unknown generalizability outside Hong Kong.
Conclusions: In this study, we observed excess glycemic exposure and rapid glycemic deterioration in young-onset T2D, indicating that improved treatment strategies are needed in this setting. The differential responses to OGLDs between young- and usual-onset T2D suggest that better disease classification could guide personalized therapy.
Conflict of interest statement
I have read the journal’s policy and the authors of this manuscript have the following competing interests: RCWM acknowledges receiving research support (outside of this work) from AstraZeneca, Bayer, and Pfizer for conducting clinical trials and honoraria or consultancy fees from AstraZeneca and Boehringer Ingelheim, all of which has been donated to the Chinese University of Hong Kong to support diabetes research. RCWM is a member of the Editorial Board of PLOS Medicine. AOYL acknowledges receiving research support (outside of this work) from Boehringer Ingelheim, MSD, Sanofi, and Amgen and travel grants from travel grant from AstraZeneca, Boehringer Ingelheim, MSD, Novartis, Novo Nordisk, and Sanofi. JCNC and RCWM are cofounders of GemVCare, a diabetes genetic testing laboratory, which was established through support from the Technology Start-up Support Scheme for Universities (TSSSU) from the Hong Kong Government Innovation and Technology Commission (ITC). JCNC is the Chief Executive Officer, on a pro bono basis, of the Asia Diabetes Foundation (ADF), which is a nonprofit research organization which designed and implemented the Joint Asia Diabetes Evaluation (JADE) Technology as an extension to the HKDR, under the governance of the CUHK Foundation. The HKDR was established as a research-driven quality improvement program initiated by the Chinese University of Hong Kong (CUHK)-Prince of Wales Hospital Diabetes Care and Research Team, supported by the Hong Kong Foundation for Research and Development in Diabetes established at CUHK. In 2007, this was merged with the web-based JADE Technology, complete with care protocols, risk stratification, personalized reporting, and decision support. The JADE Technology was designed and implemented by the ADF to enable other clinics and hospitals to establish diabetes registers and contribute anonymized data for research purposes. The ADF was set up as a charitable research organization governed by the CUHK Foundation.
Figures
References
-
- van Wijngaarden RPT, Overbeek JA, Heintjes EM, Schubert A, Diels J, Straatman H, et al. Relation Between Different Measures of Glycemic Exposure and Microvascular and Macrovascular Complications in Patients with Type 2 Diabetes Mellitus: An Observational Cohort Study. Diabetes Ther. 2017. October 1;8(5):1097–109. 10.1007/s13300-017-0301-4 - DOI - PMC - PubMed
Publication types
MeSH terms
Substances
Grants and funding
LinkOut - more resources
Full Text Sources
Medical
