. 2020 Sep 18;15(9):e0239494.
doi: 10.1371/journal.pone.0239494. eCollection 2020.

Segmentation of time series in up- and down-trends using the epsilon-tau procedure with application to USD/JPY foreign exchange market data

Affiliations

Segmentation of time series in up- and down-trends using the epsilon-tau procedure with application to USD/JPY foreign exchange market data

Arthur Matsuo Yamashita Rios de Sousa et al. PLoS One. .

Abstract

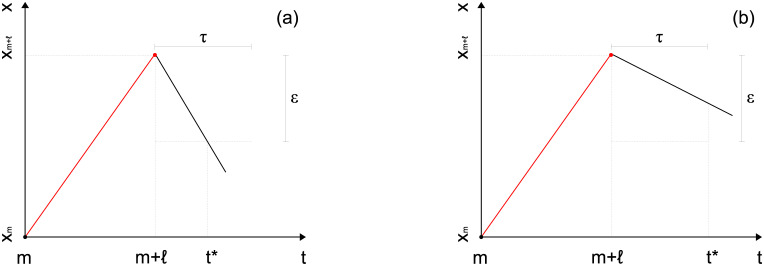
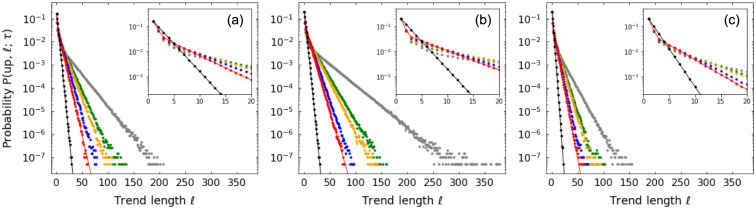
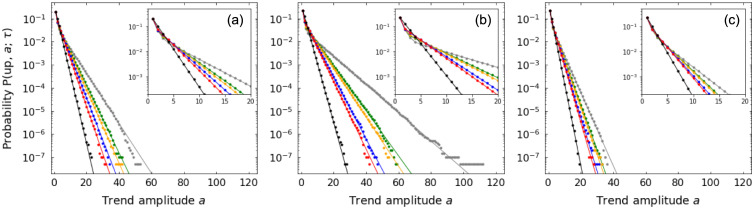
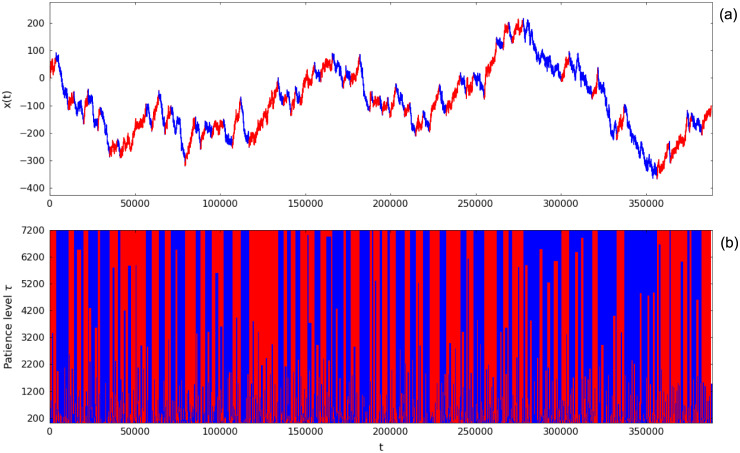
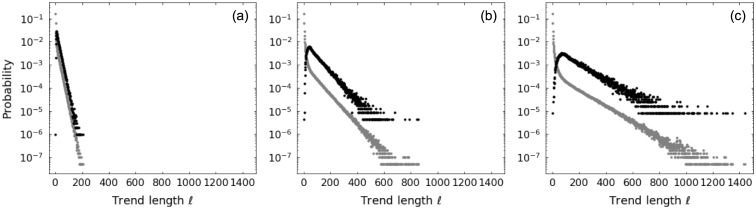
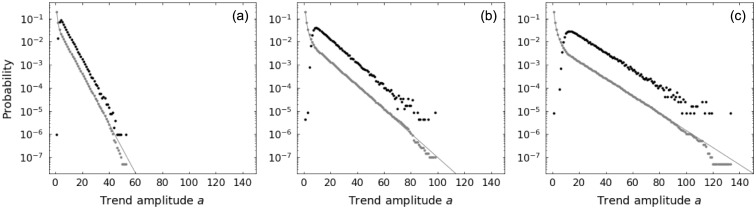
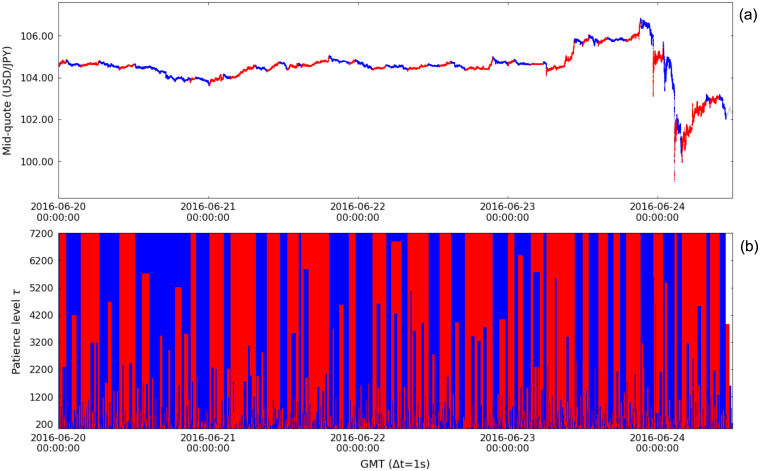
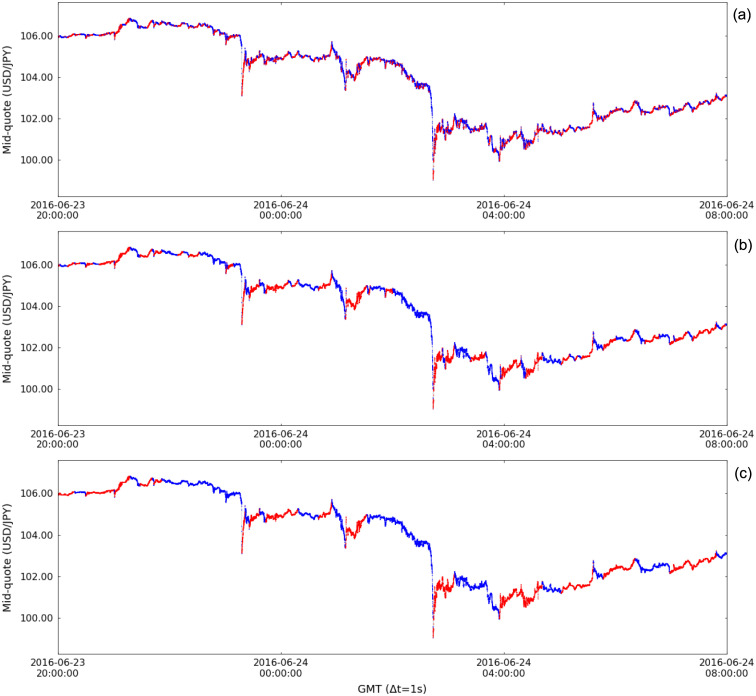
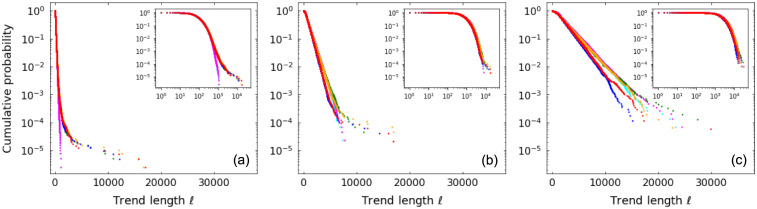
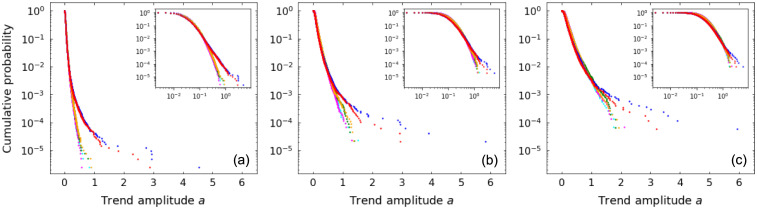
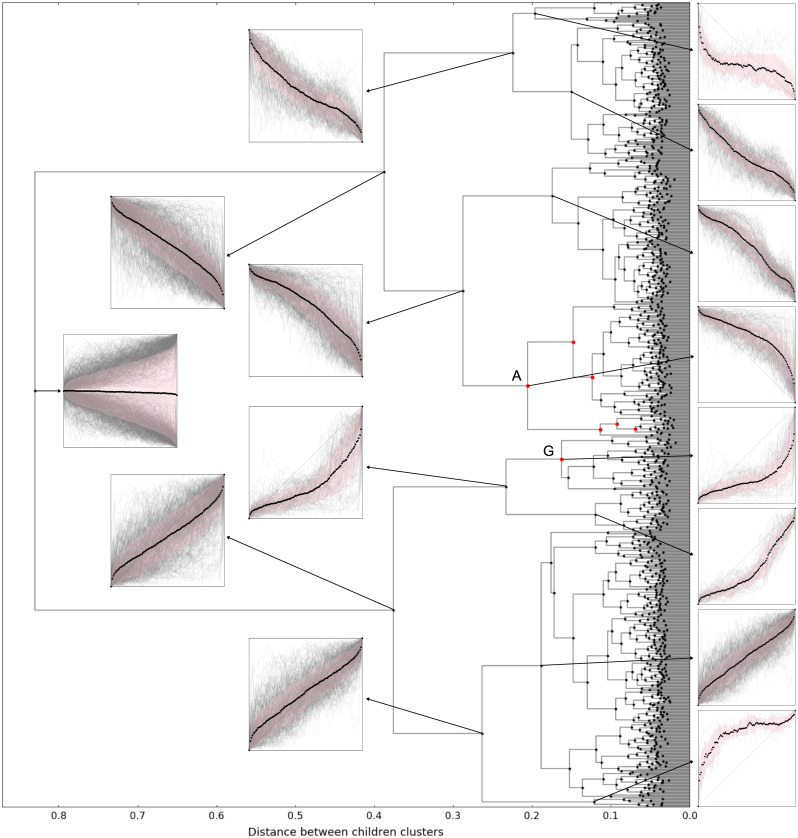
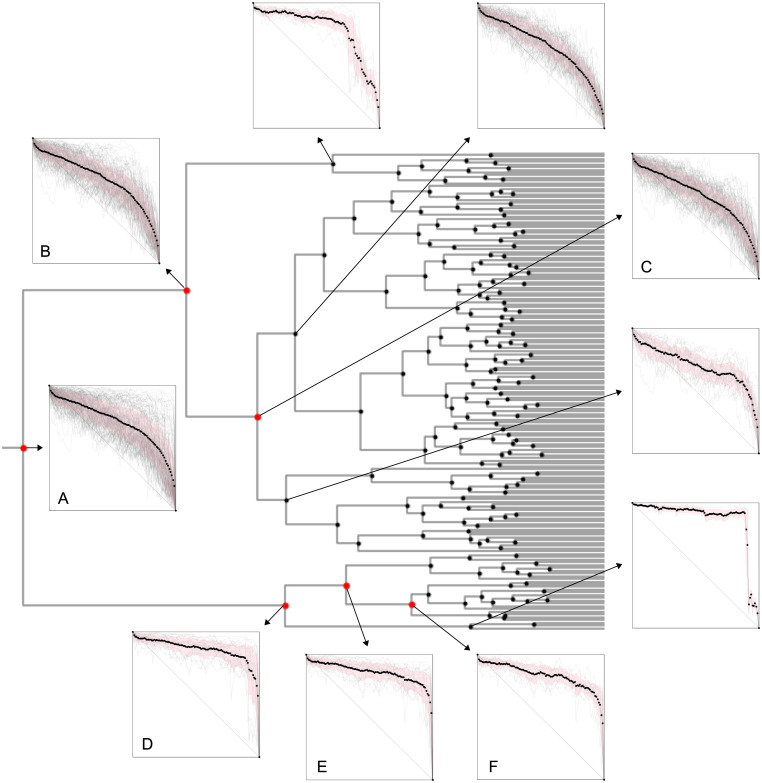
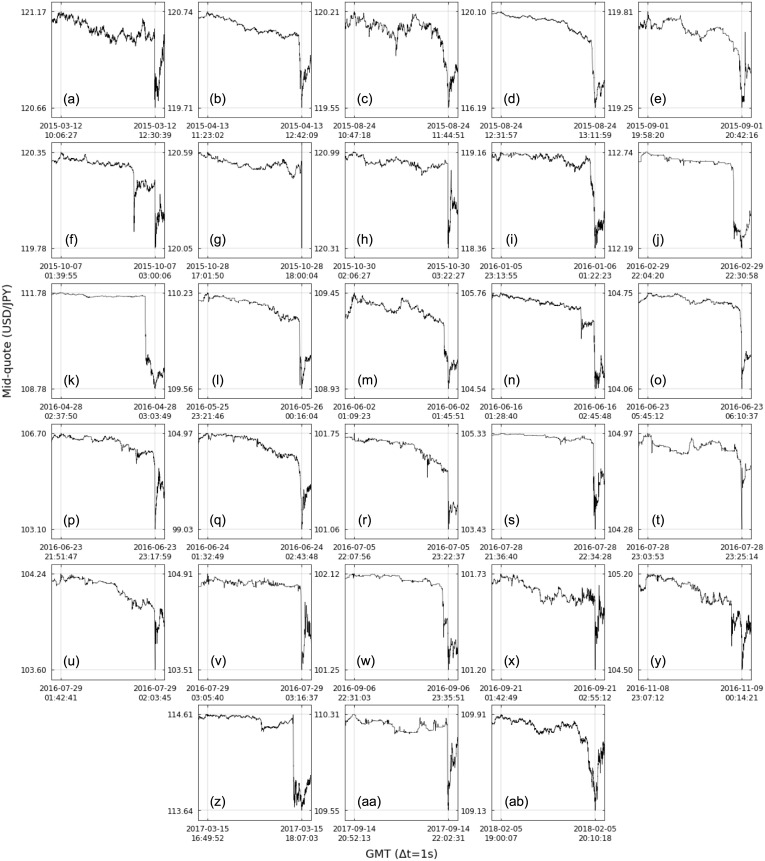
We propose the epsilon-tau procedure to determine up- and down-trends in a time series, working as a tool for its segmentation. The method denomination reflects the use of a tolerance level ε for the series values and a patience level τ in the time axis to delimit the trends. We first illustrate the procedure in discrete random walks, deriving the exact probability distributions of trend lengths and trend amplitudes, and then apply it to segment and analyze the trends of U.S. dollar (USD)/Japanese yen (JPY) market time series from 2015 to 2018. Besides studying the statistics of trend lengths and amplitudes, we investigate the internal structure of the trends by grouping trends with similar shapes and selecting clusters of shapes that rarely occur in the randomized data. Particularly, we identify a set of down-trends presenting similar sharp appreciation of the yen that are associated with exceptional events such as the Brexit Referendum in 2016.


Conflict of interest statement

The authors of this manuscript have the following competing interests: MT receives research funding (the Joint Collaborative Research Laboratory for MUFG AI Financial Market Analysis) from a commercial source (Mitsubishi UFJ financial group) as consultancy of AI trading strategies; HT is employed by Sony Computer Science Laboratories, Inc. There are no patents, products in development or marketed products to declare. This does not alter our adherence to all the PLOS ONE policies on sharing data and materials, as detailed online in the guide for authors.

Figures

Fig 1
Fig 1. Stop conditions of the epsilon-tau procedure for the up-trend case (analogous for the down-trend case).
Procedure stops when: (a) value of time series reaches tolerance level ε; or (b) time between consecutive maximum values reaches patience level τ. It defines the up-trend (red) of length ≥ 1 and amplitude a = xm+ℓxm > 0.
Fig 2
Fig 2. Up-trend length probability distributions for random walks.
Distributions for patience levels τ = 1 (black), τ = 2 (red), τ = 3 (blue), τ = 4 (orange), τ = 5 (green), τ = 10 (gray) and for random walk parameters: (a) p = 0.4, q = 0.4; (b) p = 0.5, q = 0.4; (c) p = 0.4, q = 0.5. Symbols refer to results from numerical simulations and lines represent theoretical values. Insets detail distributions for small .
Fig 3
Fig 3. Up-trend amplitude a probability distributions for random walks.
Distributions for patience levels τ = 1 (black), τ = 2 (red), τ = 3 (blue), τ = 4 (orange), τ = 5 (green), τ = 10 (gray) and for random walk parameters: (a) p = 0.4, q = 0.4; (b) p = 0.5, q = 0.4; (c) p = 0.4, q = 0.5. Symbols refer to results from numerical simulations and lines represent theoretical values. Insets detail distributions for small a.
Fig 4
Fig 4. Time series segmentation of a random walk realization.
(a) Up- and down-trends segmentation using patience level τ = 7200 for random walk parameters p = 0.4, q = 0.4. (b) Segmentation results for different patience levels τ. Red indicates up-trends, blue indicates down-trends and light-gray (in (a)) or white (in (b)) shows points where the trend is not determined (in the end of the time series—an effect of the finite size of the series).
Fig 5
Fig 5. Comparison between up-trend length probability distributions for random walk with parameters p = 0.4, q = 0.4.
Distributions considering arbitrary reference point (gray) and considering the trends obtained from time series segmentation (black) using patience levels: (a) τ = 10; (b) τ = 50; and (c) τ = 100. Symbols refer to results from numerical simulations.
Fig 6
Fig 6. Comparison between up-trend amplitude a probability distributions for random walk with parameters p = 0.4, q = 0.4.
Distributions considering arbitrary reference point (gray) and considering the trends obtained from time series segmentation (black) using patience levels: (a) τ = 10; (b) τ = 50; and (c) τ = 100. Symbols refer to results from numerical simulations and lines represent theoretical values.
Fig 7
Fig 7. Time series segmentation of the mid-quote time series of the currency pair USD/JPY during the week from June 20 2016 00:00:00 GMT to June 24 2016 12:00:00 GMT, when the Brexit Referendum took place.
(a) Up- and down-trends segmentation using patience level τ = 7200 (2h). (b) Segmentation results for different patience levels τ. Red indicates up-trends, blue indicates down-trends and light-gray (in (a)) or white (in (b)) shows points where the trend is not determined.
Fig 8
Fig 8. Time series segmentation of the mid-quote time series of the currency pair USD/JPY during the 2016 Brexit Referendum.
Segmentation results depend on the used patience level: (a) τ = 60 (1min); (a) τ = 600 (10min); and (a) τ = 1800 (30min).
Fig 9
Fig 9. Trend length cumulative probability distributions for mid-quote time series of the currency pair USD/JPY from 2015 to 2018.
Distributions for up-trends (red) and down-trends (blue) obtained from the segmentation of the mid-quote data, for up-trends (orange) and down-trends (green) obtained from the segmentation of the randomized mid-quote data with fixed zeros, and for up-trends (magenta) and down-trends (cyan) obtained from the segmentation of the totally randomized mid-quote data using patience levels: (a) τ = 60 (1min); (a) τ = 600 (10min); and (a) τ = 1800 (30min). Insets show log-log plots.
Fig 10
Fig 10. Absolute trend amplitude |a| cumulative probability distributions for mid-quote time series of the currency pair USD/JPY from 2015 to 2018.
Distributions for up-trends (red) and down-trends (blue) obtained from the segmentation of the mid-quote data, for up-trends (orange) and down-trends (green) obtained from the segmentation of the randomized mid-quote data with fixed zeros, and for up-trends (magenta) and down-trends (cyan) obtained from the segmentation of the totally randomized mid-quote data using patience levels: (a) τ = 60 (1min); (a) τ = 600 (10min); and (a) τ = 1800 (30min). Insets show log-log plots.
Fig 11
Fig 11. Dendrogram indicating the similarities between shapes of trends obtained by the segmentation of the mid-quote time series of the currency pair USD/JPY from 2015 to 2018 using patience level τ = 1800 (30min).
Only trends with absolute amplitude |a|>0.5 are considered. Each symbol represents a cluster of shapes and graphs show the normalized trends (gray lines), the average (black symbols) and the standard deviation (pink shade). Red symbols in the dendrogram indicate the clusters that deviate from the random case.
Fig 12
Fig 12. Portion of dendrogram detailing the clusters of down-trend shapes that deviate from the random case.
Graphs show the normalized trends (gray lines), the average (black symbols) and the standard deviation (pink shade). Cluster labels correspond to the ones in Table 1.
Fig 13
Fig 13. All 28 down-trends of the USD/JPY market data from 2015 to 2018 in cluster D.
Shape of trends in this cluster are marked by a sharp fall in the end of the trend, having ∼80% of its amplitude in the last ∼10% of its length (trends are limited by the gray lines). See Table 2 for trends details.

Similar articles

Cited by

References

    1. Fu TC. A review on time series data mining. Eng Appl Artif Intell. 2011;24(1):164–81. 10.1016/j.engappai.2010.09.007 - DOI
    1. Keogh E, Chu S, Hart D, Pazzani M. Segmenting time series: A survey and novel approach In: Last M, Abraham K, Horst B, editors. Data mining in time series databases. Singapore: World scientific; 2004. p. 1–21.
    1. Peng CK, Buldyrev SV, Goldberger AL, Havlin S, Sciortino F, Simons M, Stanley HE. Fractal landscape analysis of DNA walks. Physica A. 1992;191(1-4):25–9. 10.1016/0378-4371(92)90500-P - DOI - PubMed
    1. Ducré-Robitaille JF, Vincent LA, Boulet G. Comparison of techniques for detection of discontinuities in temperature series. Int J Climatol. 2003;23(9):1087–101. 10.1002/joc.924 - DOI
    1. Reeves J, Chen J, Wang XL, Lund R, Lu QQ. A review and comparison of changepoint detection techniques for climate data. J Appl Meteorol Climatol. 2007;46(6):900–15. 10.1175/JAM2493.1 - DOI

Publication types