. 2021 Aug 13;76(9):1627-1632.
doi: 10.1093/gerona/glaa238.

Development and Validation of 2 Composite Aging Measures Using Routine Clinical Biomarkers in the Chinese Population: Analyses From 2 Prospective Cohort Studies

Affiliations

Development and Validation of 2 Composite Aging Measures Using Routine Clinical Biomarkers in the Chinese Population: Analyses From 2 Prospective Cohort Studies

Zuyun Liu. J Gerontol A Biol Sci Med Sci. .

Abstract

Background: This study aimed to: (i) develop 2 composite aging measures in the Chinese population using 2 recent advanced algorithms (the Klemera and Doubal method and Mahalanobis distance); and (ii) validate the 2 measures by examining their associations with mortality and disease counts.

Methods: Based on data from the China Nutrition and Health Survey (CHNS) 2009 wave (N = 8119, aged 20-79 years, 53.5% women), a nationwide prospective cohort study of the Chinese population, we developed Klemera and Doubal method-biological age (KDM-BA) and physiological dysregulation (PD, derived from Mahalanobis distance) using 12 biomarkers. For the validation analysis, we used Cox proportional hazard regression models (for mortality) and linear, Poisson, and logistic regression models (for disease counts) to examine the associations. We replicated the validation analysis in the China Health and Retirement Longitudinal Study (CHARLS, N = 9304, aged 45-99 years, 53.4% women).

Results: Both aging measures were predictive of mortality after accounting for age and gender (KDM-BA, per 1-year, hazard ratio [HR] = 1.14, 95% confidence interval [CI] = 1.08, 1.19; PD, per 1-SD, HR = 1.50, 95% CI = 1.33, 1.69). With few exceptions, these mortality predictions were robust across stratifications by age, gender, education, and health behaviors. The 2 aging measures were associated with disease counts both cross-sectionally and longitudinally. These results were generally replicable in CHARLS although 4 biomarkers were not available.

Conclusions: We successfully developed and validated 2 composite aging measures-KDM-BA and PD, which have great potentials for applications in early identifications and preventions of aging and aging-related diseases in China.

Keywords: Aging measure; Chinese population; Klemera and Doubal method; Mortality; Physiological dysregulation.


Figures

Figure 1.
Figure 1.
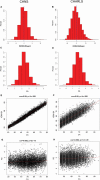
Characteristics of KDM-BA, KDM-BAacc, and PD. KDM-BA = Klemera and Doubal method-biological age; KDM-BAacc = Klemera and Doubal method-biological age acceleration; PD = physiological dysregulation; CA = chronological age. A and B, and C and D show the distribution of KDM-BAacc and PD, respectively. E and F, and G and H show the correlation between CA and the 2 measures (KDM-BA and PD), respectively. A, C, E, and G are based on the China Health and Nutrition Survey (CHNS). B, D, F, and H are based on the China Health and Retirement Longitudinal Study (CHARLS).
Figure 2.
Figure 2.
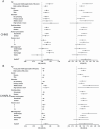
Associations of KDM-BAacc and PD with all-cause mortality in population subgroups. KDM-BAacc = Klemera and Doubal method-biological age acceleration; PD = physiological dysregulation (standardized); BMI = body mass index; HR = hazard ratio; OR = odds ratio; CI = confidence interval. A and B show results from China Health and Nutrition Survey (CHNS) and China Health and Retirement Longitudinal Study (CHARLS), respectively. The left panel in A and B shows results for KDM-BAacc and the right panel shows those for PD. All models were adjusted for chronological age and gender with an exception for gender subgroup analysis (only adjusted for chronological age). Participants with 2 diseases, and those with 3 or more diseases were combined as one subgroup due to the small sample size in each group. Body mass index was calculated as weight in kilograms divided by height in meters squared. Underweight was defined as BMI < 18.5 kg/m2; normal was defined as 18.5 ≤ BMI < 24.0 kg/m2; overweight was defined as 24.0 ≤ BMI < 28.0 kg/m2; and obese was defined as BMI ≥ 28 kg/m2. Healthy participants were defined as those having no disease and normal BMI.
Figure 3.
Figure 3.
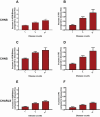
Predicted increases in the KDM-BAacc (A, C, and E) and PD (B, D, and F) for each disease count. KDM-BAacc = Klemera and Doubal method-biological age acceleration; PD = physiological dysregulation (standardized); CHNS = China Health and Nutrition Survey; CHARLS = China Health and Retirement Longitudinal Study. The y-axis depicts the increase in KDM-BAacc or PD (standardized) in comparison to participants who were disease-free. The x-axis shows groups categorized based on disease counts that each participant had. The bar indicates standard error. The results are based on a series of linear regression models with adjustment for gender. A and B show results from CHNS using the original set of 12 biomarkers. C and D show results from CHNS using the alternative set of 8 biomarkers. E and F show results from CHARLS using the same 8 biomarkers.

Similar articles

Cited by

References

    1. Kennedy BK, Berger SL, Brunet A, et al. . Geroscience: linking aging to chronic disease. Cell. 2014;159:709–713. doi:10.1016/j.cell.2014.10.039 - DOI - PMC - PubMed
    1. Sierra F, Kohanski R. Geroscience and the trans-NIH Geroscience Interest Group, GSIG. Geroscience. 2017;39:1–5. doi:10.1007/s11357-016-9954-6 - DOI - PMC - PubMed
    1. Levine ME. Modeling the rate of senescence: can estimated biological age predict mortality more accurately than chronological age? J Gerontol A Biol Sci Med Sci. 2013;68:667–674. doi:10.1093/gerona/gls233 - DOI - PMC - PubMed
    1. Belsky DW, Caspi A, Houts R, et al. . Quantification of biological aging in young adults. Proc Natl Acad Sci USA. 2015;112:E4104–E4110. doi:10.1073/pnas.1506264112 - DOI - PMC - PubMed
    1. Mitnitski A, Howlett SE, Rockwood K. Heterogeneity of human aging and its assessment. J Gerontol A Biol Sci Med Sci. 2017;72:877–884. doi:10.1093/gerona/glw089 - DOI - PMC - PubMed

Publication types