. 2020 Sep 17;182(6):1623-1640.e34.
doi: 10.1016/j.cell.2020.08.013.

Cell Types of the Human Retina and Its Organoids at Single-Cell Resolution

Affiliations

Cell Types of the Human Retina and Its Organoids at Single-Cell Resolution

Cameron S Cowan et al. Cell. .

Abstract

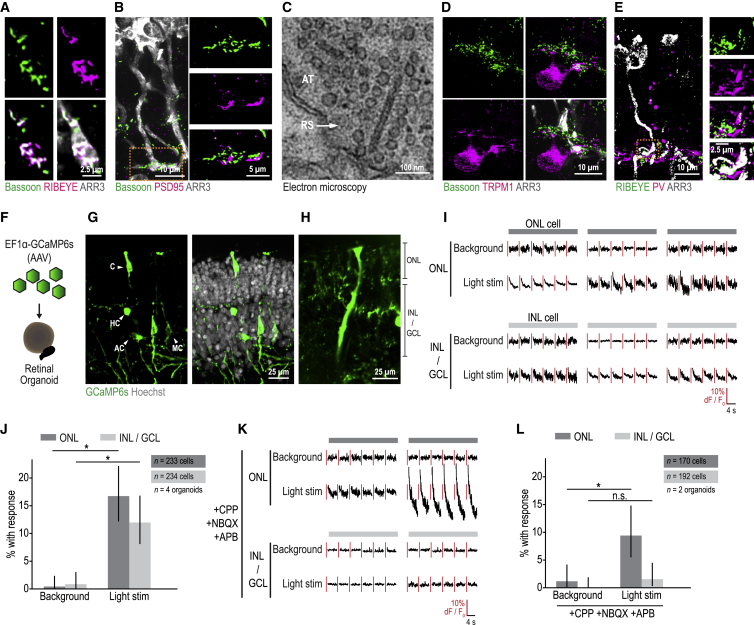
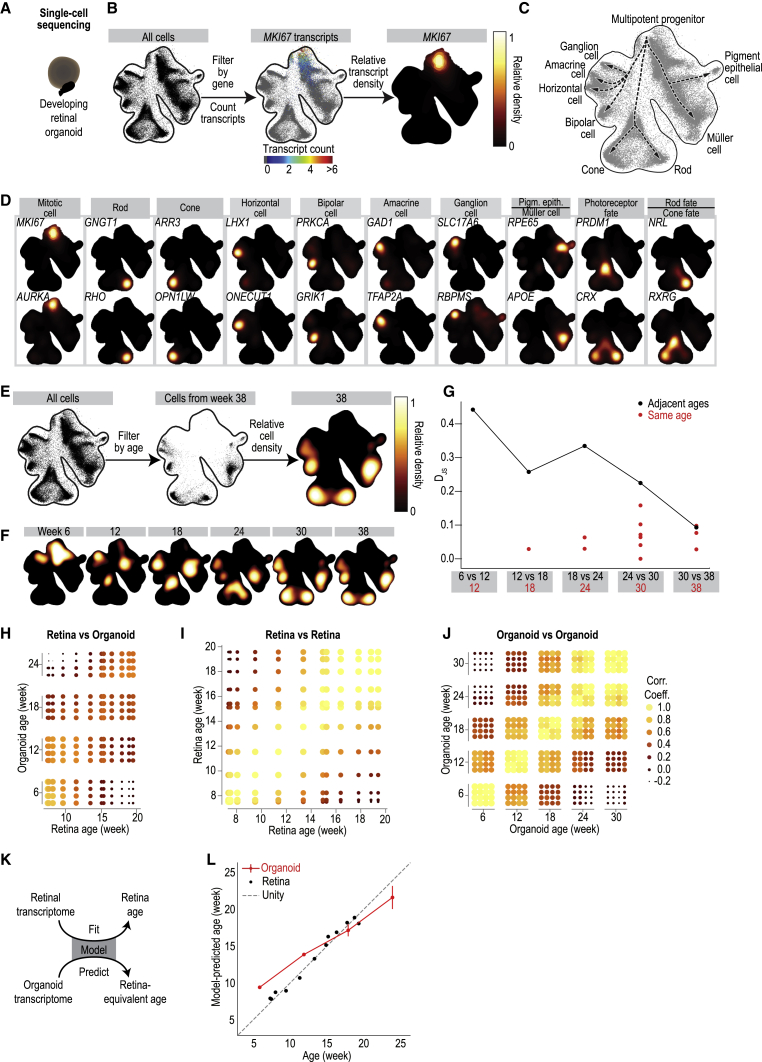
Human organoids recapitulating the cell-type diversity and function of their target organ are valuable for basic and translational research. We developed light-sensitive human retinal organoids with multiple nuclear and synaptic layers and functional synapses. We sequenced the RNA of 285,441 single cells from these organoids at seven developmental time points and from the periphery, fovea, pigment epithelium and choroid of light-responsive adult human retinas, and performed histochemistry. Cell types in organoids matured in vitro to a stable "developed" state at a rate similar to human retina development in vivo. Transcriptomes of organoid cell types converged toward the transcriptomes of adult peripheral retinal cell types. Expression of disease-associated genes was cell-type-specific in adult retina, and cell-type specificity was retained in organoids. We implicate unexpected cell types in diseases such as macular degeneration. This resource identifies cellular targets for studying disease mechanisms in organoids and for targeted repair in human retinas.

Keywords: eye disease; human retina; macular degeneration; organoid; organoid development; retina; retinal organoid; single cell sequencing; synaptic function; transcriptome.


Conflict of interest statement

Declaration of Interests The authors declare no competing interests.

Figures

None
Graphical abstract
Figure 1
Figure 1
Multilayered Human Retinal Organoids Produced in Quantity (A) Timeline of the AMASS organoid protocol with example bright-field images at important stages. Red arrowhead, pigment epithelium; red arrow, outer segments. EB, embryoid body. (B) Variability of embryoid body diameter with different generation methods. Bars, average coefficient of variation. Error bars, SD. (C) Embryoid body diameter (day 7) versus the number of cells seeded per microwell. Points, average diameter of embryoid bodies (n = 12) within an independent experiment. Line, quadratic fit. (D) Percentage of all organoids that were retinal organoids (week 6) versus embryoid body diameter (day 7). Points, experiments. Line, quadratic fit. (E) Schematic visualizing how AMASS improves yield from iPSCs using microwell array seeding and checkerboard scraping. (F) Comparison of organoid yield per well of iPSCs using different methods, weeks 20–38. Points, experiments. (G) Bright-field image of an organoid. OS, outer segment; ONL, outer nuclear layer; OPL, outer plexiform layer; INL, inner nuclear layer. (H) Confocal images. Left: adult retina. Right: organoid. Green, antibody against Bassoon (synaptic marker); white, Hoechst (nucleus marker). IPL, inner plexiform layer; GCL, ganglion cell layer. (I) Bright-field image of organoid pigment epithelial cells with black pigmentation. (J) Confocal image of pigment epithelial cells (maximum intensity projection). Magenta, MITF antibody; green, ZO-1 antibody (pigment epithelial cell markers). (K) Illustration of photoreceptor subcellular compartments. OS, outer segment; CC, connecting cilium; IS, inner segment; AT, axon terminal. (L–T) Organoid photoreceptors. (L–N) Outer segment. (L) Bright-field image. (M) Confocal images. Magenta, ARR3 antibody (cone marker); green, L/M opsin antibody (cone outer segment marker); white, Hoechst (nucleus marker). (N) Electron microscope image. Diagonal section of membrane discs. (O–Q) Connecting cilium. (O and P) Confocal images. Magenta, ARR3 antibody; green, ARL13B antibody (cilium marker). (P) Maximum intensity projection showing organoid surface. (Q) Electron microscope image. (R and S) Inner segment. (R) Confocal image. Magenta, L/M opsin antibody; green, TOMM1 antibody (mitochondrion marker). (S) Electron microscope image. (T) Axon terminal. Confocal image. Magenta, ARR3 antibody; green, RIBEYE antibody (ribbon synapse marker). All data from F49B7 organoids. See also Figure S1, Table S1, and Video S1.
Figure S1
Figure S1
Characterization of F49B7 iPSCs and Retinal Organoids from Several iPSC Lines, Related to Figures 1, 2, and 3 and Table S1 (A) Bright-field image of F49B7 iPSC colony. (B) Bright-field image of iPSC colony. Blue stain, alkaline phosphatase (pluripotency marker). (C – F) Confocal images of iPSCs. Green, antibody for pluripotency markers; white, Hoechst (nucleus marker). (C) SOX2, (D) NANOG, (E) OCT4 and (F) SSEA4. (G – I) Confocal images of iPSCs directly differentiated into the three germ layers. White, Hoechst. (G) Ectoderm; magenta, Nestin; green, PAX6 (ectoderm markers). (H) Endoderm; magenta, SOX17; green, FOXA2 (endoderm markers). (I) Mesoderm; magenta, NCAM; green, Brachyury (mesoderm markers). (J) G-banded karyotyping of F49B7 iPSCs. (K) Different iPSC lines generating 5-layered retinal organoids. Confocal images. Green, Bassoon antibody (synaptic marker); white, Hoechst (nucleus marker). Boxed area, outline of F49B7 image shown cropped in Figure 1. (L) Retinal neuroepithelium (arrows) on a five-week old organoid. (M) Embryoid body diameter (day 7) versus the number of cells seeded per microwell. Points, mean diameter of embryoid bodies (n = 12) within an independent experiment. Line, quadratic fit. (N) Percentage of all organoids that were retinal organoids (week 6) versus embryoid body diameter (day 7). Points, experiments. Line, quadratic fit. (O) Confocal image. Green, RHO antibody (rod outer segment marker); white, Hoechst (nucleus marker). OS, outer segment; ONL, outer nuclear layer. (P – S) Electron microscope images of photoreceptor outer segment (OS; P, Q, S), inner segment (IS; P, R, S) and connecting cilium (CC; P, R, S). P and S are from serial sections. (T) Confocal image. Magenta, TRPM1 antibody (ON bipolar cell marker); green, GFP antibody (GCaMP6s); white, Hoechst (nucleus marker). (U) Scheme of the time course with which organoids were sampled for single-cell RNA sequencing. Data in A – J, K, L, O, P – S and T are from F49B7 organoids, data in K, M and N are from IMR90.4 organoids.
Figure 2
Figure 2
Organoids Are Light-Responsive and Contain Functional Synapses (A–E) Synapses in organoids. (A, B, D, and E) Cone axon terminals. Confocal images. White, ARR3 (cone marker). Green, antibody against Bassoon (ribbon synapse marker); RIBEYE (ribbon synapse marker). Magenta, antibody against RIBEYE; PSD95 (postsynaptic marker); TRPM1 (ON bipolar cell marker); PV (horizontal cell marker). (C) Electron microscope image. AT, photoreceptor axon terminal; RS, ribbon synapse. (F) Schematic of organoid infection with adeno-associated viral vectors (AAV) expressing the calcium sensor GCaMP6s under the promotor EF1α. (G and H) Organoids expressing GCaMP6s. (G) Confocal image. Green, antibody against GFP detecting GCaMP6s. White, Hoechst (nucleus marker). C, cell with cone morphology; HC, cell with horizontal cell morphology; AC, cell with amacrine cell morphology; MC, Müller cell confirmed by counter-stain. (H) Two-photon microscope image. Optical cross-section of living organoid. Green, GCaMP6s. ONL, outer nuclear layer; INL, inner nuclear layer; GCL, ganglion cell layer. (I) Organoid calcium activity during background illumination and light stimulation. Top, cells from ONL. Bottom, cells from INL/GCL. Black lines, peri-stimulus calcium activity (dF/F0); line segments, individual trials. Red lines, scale bars. (J) Quantification of light responsive cells in ONL and INL/GCL. Error bars, 95% binomial confidence interval. (K and L) Organoid calcium activity during pharmacological block of glutamatergic synaptic transmission. CPP, (3-[(R)-2-carboxypiperazin-4-yl]-propyl-1-phosphonic acid); NBQX (2,3-dioxo-6-nitro-7-sulfamoyl-benzo[f]quinoxaline); APB, (2-amino-4-phosphonobutyric acid). (K) Responses from individual cells, as in (I). (L) Quantification of light responsive cells in ONL and INL/GCL, as in (J). All significance values from χ2 test. All data from F49B7 organoids. See also Figure S1.
Figure 3
Figure 3
Organoid Transcriptome Stabilizes In Vitro with a Development Rate that Matches that of the Retina In Vivo (A) Retinal organoid single-cell sequencing. (B) Left: scVis map of cells across weeks 6–38. Each point represents the transcriptome of a single cell. Black line, isodensity contour. Middle: scVis map with transcript counts of a single gene (here, mitosis marker MKI67) color-coded; colormap at bottom. Right: heatmap of relative transcript density for MKI67; colormap at right. (C) Cell classes marked on scVis map according to (D). Arrows, inferred developmental trajectories. (D) Heatmap of relative transcript density for genes marking mitotic cells, retinal cell classes, and retinal precursors. (E) Left: scVis map of cells across all ages. Middle: a black point represents a cell from an organoid of a specific age (here week 38). Right: heatmap of relative cell density at week 38; colormap at right. (F) Heatmap of relative cell density at six different ages. (G) Black line, Jensen-Shannon divergence (DJS) of organoid transcriptomes at adjacent ages. Red dots, comparison of individual organoids from the same age and batch. (H–J) Correlation in gene expression at different ages. Each point is a correlation coefficient between two samples. Point size and color, correlation strength; scale at right. (H) Developing organoid versus developing retina. (I) Retina versus retina. (J) Organoid versus organoid. (K) A model, trained to predict retina age based on retinal transcriptome data, is applied to predict retina-equivalent age of organoid samples. (L) Red line, model-predicted retina-equivalent age of organoids versus their age in culture (mean ± 3 SEM). Black points, model-predicted age of retinas versus their developmental age. Dashed gray line, one-to-one correspondence between age and model-predicted age. All organoid data from F49B7 organoids. See also Figures S1 and S2.
Figure S2
Figure S2
Reproducibility of Organoids, Firing Rate Statistics of Adult Retinal Ganglion Cells, Infomap Clustering Quality, and Sources of Variability in Adult Retinal UMAP Maps, Related to Figures 3, 4, and 5 Location of transcripts of (A) neurogenic and neuronal marker NEUROD1 (60 × upregulated, p = 1.8 × 10−308) and (B) gliogenic marker PAX2 (37 × upregulated, p = 5.8 × 10−12) in two pools of mitotic progenitor cells on organoid scVis map. Circles, cells expressing mitotic markers; color, transcript count; colormap at right. (C) Expression of cell type markers in week 38 (left) and week 46 (right) organoids. Colormap and legend at right. (D) Cell type composition in organoids at week 46 compared to other ages. Legend at right. (E) Heatmap of relative cell density in 28 different samples with indicators for organoid age (row), pooling method (top, pool; bottom, individual), batch (blue bar), and replicates from the same organoid (red bar). (F, G) Scatterplots comparing the correlation in ganglion cell firing rates across stimulus repetitions to their (F) average firing rate and (G) peak firing rate. Red, cells significantly light responsive (p < 0.01). Black, cells not light responsive (p ≥ 0.01). (H – J) Cluster quality was evaluated in a bootstrap process to evaluate the Infomap clusters of (H) peripheral retina, (I) foveal retina and (J) developed organoids. Light gray bars, cluster purity. Dark gray bars, cluster stability. (K) Peripheral retinal cell transcriptomes in scVis map, variation across donors. Points, single cell transcriptomes. Color, donor. (L) UMAP map of developed organoids labeled according to cell line. (M – R) The peripheral (left) and foveal (right) UMAP maps labeled according to (M – N) donor identity and sex; M, male; F, female, (O – P) 10x Chromium lane and (Q – R) cell class annotation used during subclustering.
Figure 4
Figure 4
Post Mortem Adult Retina with Light Responses (A) Schematic of the procedure to obtain adult retinas for single-cell RNA sequencing and electrophysiology. (B) Vertical lines, action potentials fired by five example ganglion cells (horizontal boxes) during five repetitions (rows within boxes) of a light stimulus (at bottom). (C) scVis map of light responses from a sample of ganglion cells at the same retinal location; each point represents the firing rate characteristics of an individual cell in response to visual stimulation. Colors, Infomap clusters. Labels at the two axes, response characteristics of cells in that region of the scVis map. (D) Colored lines, normalized firing rate of cells within each cluster during the stimulus. Shaded regions, ±1 SD. Colors, Infomap clusters as in (C). See also Figure S2.
Figure 5
Figure 5
Cell Types of the Adult Human Retina and Its Organoids (A) Single cells sequenced from peripheral retina, foveal retina, and developed retinal organoids (weeks 30 and 38). (B–D) UMAP maps of transcriptomic cell types within (B) peripheral retina, (C) foveal retina, and (D) developed organoids. Points, transcriptome of single cell. Abbreviations/colors, cell classes, and types as in (G). (E and F) Expression of known marker genes (rows) within Infomap clusters (columns) for (E) adult retina, both peripheral and foveal and (F) developed organoids. Dot size, percent of cells expressing. Dot color, mean transcripts per cell. Legend and colormap at bottom right of F. U, uncertainty coefficient. (G) Illustration, retinal cell classes, and types. Color bar, cell types; shades of the same color, cell types within the same cell class. (H–J) Subclustering of bipolar cells in peripheral retina, foveal retina, and retinal organoid. Points, single bipolar cells. (H) Color, bipolar cell type. Peripheral and foveal retina. (I) Color, region of origin. (J) Color, tissue of origin. All organoid data from F49B7 and IMR90.4 organoids. See also Figures S2, S3, S4, S5, and S6 and Table S2.
Figure S3
Figure S3
Identification of Retinal Cell Types, Related to Figure 5 and Table S2 (A – I) UMAP map of cell types, colored according to cell type (left), region of origin (middle), and tissue of origin (right). (A) Rods. (B) Cones. (C) Horizontal cells. (D) Amacrine cells. (E) Ganglion cells. (F) Macroglia. (G) Pigmented cells. (H) Vascular-associated cells and fibroblasts. (I) Immune cells. (J – O) Expression of known cell type marker genes (columns) by Infomap cell types (rows). (J) Cones. (K) Horizontal Cells. (L) Bipolar cells. (M) Amacrine cells. (N) Ganglion cells. (O) Macroglia. Dot size, percent of cells expressing. Dot color, mean transcripts per cell. Colormap and legend, right of panel K. Cell type acronyms as in Figure 5. , cell-type markers not previously known. (P) Expression of retinoic acid pathway genes, implicated in patterning the fovea (da Silva and Cepko, 2017). Genes for retinoic acid synthesis (ALDH1A1, ALDH1A3) and catabolism (CYP26A1), expression levels in selected cell types. CYP26A1 was expressed in foveal Müller cells and was significantly upregulated relative to the periphery (Mann-Whitney U test, CYP26A1: 6.3 × upregulated, p = 6 × 10−176). ALDH1A3 alone was expressed in pigment epithelial cells, where it was highly upregulated in the periphery relative to the fovea (630 × upregulated, p = 2.5 × 10−29). Dot size, percent of cells expressing. Dot color, mean transcripts per cell. Right, colormap and legend. Cell type acronyms are from Figures 5B–5G. , cell type not present in tissue.
Figure S4
Figure S4
Convergence of Organoid Cell Types to Those of the Adult Peripheral Retina, Cell-Type Expression of Genes Associated with Retinoic-Acid, Age-Related Macular Degeneration, and Usher Syndrome, Related to Figures 5 and 7 and Table S2 (A) Comparison of developed organoid cell type composition to that of peripheral retina (left) and foveal retina (right). Color, cell type as in Figures 5B–5G. RS, Spearman correlation. Cell types shared between organoid and adult retina. (B – C) Predictions from a classifier trained to predict the region of origin (peripheral, −1.0; foveal, +1.0) of (B) Müller cells and (C) pigment epithelial cells based on their transcriptome. Green bars, peripheral cells held out from training; purple bars, foveal cells held out from training; red bars, developed organoid cells; R2, coefficient of determination. (D – E) In situ hybridization against regional marker genes. Rows, tissue of origin. (D) Left, confocal images; Magenta, COL2A1 (peripheral Müller cell marker); Green, RLBP1, (Müller cell marker); White, DAPI (nucleus marker). Right, relative marker expression in cells. Points, cells. Color, retinal layer; legend at top right. ONL, outer nuclear layer; INL, inner nuclear layer; GCL, ganglion cell layer. (E) Confocal images. Magenta, RHCG (foveal Müller cell marker); Green, RLBP1; White, DAPI. (F) Comparison of regional marker in situ hybridization and transcriptome findings. Rows, tissue / region of origin. Columns, marker genes. Top, in situ hybridization. Bottom, single cell RNA sequencing. Dot size, percent of cells expressing. Dot color, mean transcripts per cell. Legends and colormap at right. (G) Comparison of transcriptomes in all organoid cells and adult cones by principal component analysis. Scatterplot axes are the first two principal components (PC1, PC2). Each point is the transcriptome of a cell. From left to right, panels contain cells from organoids of increasing age. Red, peripheral cones; black, developed organoid cones; gray, other organoid cells. (H) Genes from the age-related macular degeneration associated loci 1q31.3 (CFH and CFHR1, expressed by DBC_05) and 10q26.13 (HTRA1, expressed by horizontal cells and types of amacrine and ganglion cells) (Fritsche et al., 2016). Dot size, percent of cells expressing. Dot color, mean transcripts per cell. Right, colormap and legend. Cell type acronyms are from Figures 5B–5G. , cell type not present in tissue. (I – M) Genes associated with type I (USH1G, USH1C, CDH23) and type III (CLRN1) Usher syndromes which had no consensus for the cell type of origin in the human retina as their expression varies across species (Mathur and Yang, 2015; Sahly et al., 2012; Siegert et al., 2012) are expressed in Müller cells of the adult peripheral and foveal retina and developed organoids. (I – J) Confocal images. In situ hybridization. Magenta, CDH23 or USH1G (Usher disease genes); green, RLBP1 (Müller cell marker); white, DAPI (nuclear marker). (K) Relative marker expression. Points, cells. Color, retinal layer. ONL, outer nuclear layer; INL, inner nuclear layer; GCL, ganglion cell layer. (L – M) Comparison of regional marker (L) in situ hybridization and (M) transcriptome findings. Rows, tissue / region of origin. Columns, marker genes. Legends and colormaps at bottom.
Figure S5
Figure S5
Per Cell-Type Marker Gene Expression Difference between Organoid and Peripheral Retina, Related to Figures 5 and S4 and Table S2 Panels, cell types. Points, top 200 marker genes for each cell type. Labels, top 10 marker genes with the largest expression differences for that cell type. Axes; x, distance from organoid gene expression to adult z-scored using distribution of differences for the same 200 genes in peripheral retina; y, relative expression of gene in organoid compared to peripheral retina. Colormap, log2 relative expression of gene in organoid compared to peripheral retina.
Figure 6
Figure 6
Comparison of Cell Types in Adult Human Retina and Organoids (A) Distance of organoid cell types from the peripheral retina. Distances, Z scored Euclidean distance relative to adult cell type’s distribution using 200 cell-type marker genes. Points, single cells. Cell type colors and acronyms according to Figures 5B–5G. (B–H) Cell type markers in adult retinas (left column), F49B7 organoids (middle), and IMR90.4 organoids (right). Left and middle sub-columns, confocal images. White, Hoechst (nucleus marker). Green, antibody against (B) NRL (rod marker); (C) ARR3 (cone marker); (D) PV (horizontal cell marker); (E) PRKCA (rod bipolar cell marker); (F) TRPM1 (ON bipolar cell marker); (G) CHAT (starburst amacrine cell marker); (H) RLBP1 (Müller cell marker). (B–H) Right sub-column, location within retinal layers of cells expressing marker. Points, cells. See also Figures S4, S5, and S6 and Table S2.
Figure S6
Figure S6
Ischemia Rapidly Alters Gene Expression, Characterization of Cell Types, and Structures in Developed Organoids, Related to Figures 5 and 6 (A) Longitudinal sampling of post mortem human peripheral retina with different durations of ischemia and storage temperatures (n = 2 eyes from 1 donor). Filled circle, sample perfused with oxygenated medium until dissociation. Empty circle, sample not perfused to mimic delayed retrieval. (B – C) Time course of ischemia-induced gene expression changes in cell classes of the (B) retina kept at 20°C, (C) retina transferred to 4°C after three hours. Distance, z-scored Euclidean distance relative to the earliest time point (20 minutes) using 200 cell class specific genes. , significant change in gene expression (p < 0.01, Mann-Whitney U with Bonferroni correction). (D – E) Principal component analysis of horizontal cells. Color; Left, duration of ischemia; Right, expression of LHX1 (HC_02 marker). (D) Samples stored at 20°C. (E) Samples moved to 4°C at 3 hours post-mortem. (F – M) ON bipolar cell types not expressing cell type marker PCP2. Samples stored at 20°C. (F – I) Principal component analysis of the 3 ON bipolar types not expressing PCP2. Color, (F) duration of ischemia; (G) expression of CCDC136 (DBC_03 marker); (H) expression of STX18 (DBC_04 marker); (I) expression of CFH (DBC_05 marker). (J – M) z-scored distances; (J) distance between cell types at 20 minutes. (K – M) gene expression distance versus ischemia duration. Distance, z-scored Euclidean distance from the earliest time point. (N) MALAT1 expression in rods. Rows, duration of ischemia. Right, colormap and legend. (O) Histogram of MALAT1 expression in rods. Color, duration of hypoxia. (P – X) Confocal images. (P) Magenta, S opsin antibody (blue cone marker); green, L / M opsin antibody (red/green cone marker); white, Hoechst (nucleus marker). (Q) Confocal image. Green, PRKCA antibody; white, Hoechst. (R – T) Green, TH (amacrine cell marker); white, Hoechst. (R) Adult retina, (S) F49B7 Organoid, (T) IMR90.4 Organoid. (U) Green, RLBP1 antibody (Müller cell marker); white, Hoechst. (V) Boxed area from U. ILM, inner limiting membrane. (W) Magenta, ZO-1 antibody (outer limiting membrane marker); green, rhodopsin antibody (RHO, rod outer segment marker). OS, outer segment; OLM, outer limiting membrane. (X) Top view of ZO-1 rings, maximum intensity projection. Magenta, ZO-1 antibody; green, PNA (cone outer segment marker); white, Hoechst. (Y) Quantifications of cell soma diameter of rods (RHO), cones (ARR3), horizontal cells (PV), rod bipolar cells (PRKCA), on bipolar cells (TRPM1) and amacrine cells (CHAT). Dots, cells. Error bars, SD. , significant change in soma diameter (p < 0.01, Mann-Whitney U with Bonferroni correction). Data in P – S, U – Y are from F49B7 organoids, data in T and Y from IMR90.4 organoids.
Figure 7
Figure 7
Disease Map for Adult Human Retinas and Developed Organoids (A and B) Normalized expression of disease genes (rows) within cell types (columns) of (A) peripheral retina and (B) developed organoid. Left, names of diseases and associated genes; colormap at bottom left of (A), level of intra-gene normalized expression. Filled circle, gene significantly cell type specific (p < 0.01); empty circle, gene not cell type specific (p ≥ 0.01). Cell type colors and acronyms are according to Figure 5G. (C) Organoid age (columns) dependence of disease gene (rows) expression within organoids. Colormap at bottom, level of min-max normalized expression. Organoid data from F49B7 and IMR90.4 in (B), data from F49B7 organoids in (C). See also Figures S4 and S7 and Tables S2 and S4.
Figure S7
Figure S7
Disease Map for the Peripheral and Foveal Retina and Retinal Organoids; Stargardt Disease Gene ABCA4 Is Overexpressed in Foveal Pigment Epithelial Cells and Rods but Not Cones, Related to Figure 7 and Table S2 (A – E) Disease gene expression in retinal and organoid cell types. (A – C, E) Normalized expression of disease genes (rows) within cell types (columns) in (A) peripheral, (B, E) foveal retina and (C) retinal organoids. Left, names of diseases and associated genes. Colormap at bottom of B, level of intra-gene normalized expression. Filled circle, gene significantly cell type specific (p < 0.01); empty circle, gene not cell type specific (p ≥ 0.01). Cell type colors and acronyms are according to Figures 5B–5G. (D) Age (columns) dependence of disease gene (rows) expression within organoids. Colormap at bottom of D, level of min-max normalized expression. (F – K) Expression of Stargardt disease-associated gene ABCA4 in photoreceptors and pigment epithelial cells of the peripheral and foveal retina as well as in photoreceptors of developed organoids. (F – H) Confocal images. Green, ABCA4 antibody used in (F) peripheral retina, (G) foveal retina and (H) developed organoid; white, Hoechst (nucleus marker). OS, outer segment; RPE, retinal pigment epithelial cells. F49B7 organoid. (I) Expression level of ABCA4 within cell types and regions in adult retina and developed organoids. Legend, top left. Error bars, ± three SEM. p < 1 × 10-2 by Mann-Whitney U with Bonferroni correction. Without a bracket, indicates significant test result versus peripheral and foveal retina. (J) Comparison of peripheral retina (green) and foveal retina (blue) ABCA4 expression levels in rods, cones, and pigment epithelial cells. Probability densities are generated using a Gaussian kernel density estimate with bandwidth set by Scott’s rule. (K) Violin plots show the ABCA4 transcript counts in pigment epithelial cells. Expression is subdivided by the eye ID and region of origin. No foveal choroidal / pigment epithelial sample was available for eye IDs one and two. Eye five came from a different donor than eyes three and four.

References

    1. Aurnhammer C., Haase M., Muether N., Hausl M., Rauschhuber C., Huber I., Nitschko H., Busch U., Sing A., Ehrhardt A., Baiker A. Universal real-time PCR for the detection and quantification of adeno-associated virus serotype 2-derived inverted terminal repeat sequences. Hum. Gene Ther. Methods. 2012;23:18–28. - PubMed
    1. Baden T., Schubert T., Chang L., Wei T., Zaichuk M., Wissinger B., Euler T. A tale of two retinal domains: near-optimal sampling of achromatic contrasts in natural scenes through asymmetric photoreceptor distribution. Neuron. 2013;80:1206–1217. - PubMed
    1. Baden T., Berens P., Franke K., Román Rosón M., Bethge M., Euler T. The functional diversity of retinal ganglion cells in the mouse. Nature. 2016;529:345–350. - PMC - PubMed
    1. Bae J.A., Mu S., Kim J.S., Turner N.L., Tartavull I., Kemnitz N., Jordan C.S., Norton A.D., Silversmith W.M., Prentki R., Eyewirers Digital Museum of Retinal Ganglion Cells with Dense Anatomy and Physiology. Cell. 2018;173:1293–1306. - PMC - PubMed
    1. Balse E., Tessier L.-H., Fuchs C., Forster V., Sahel J.A., Picaud S. Purification of mammalian cone photoreceptors by lectin panning and the enhancement of their survival in glia-conditioned medium. Invest. Ophthalmol. Vis. Sci. 2005;46:367–374. - PubMed

Publication types

MeSH terms