

A Single-Cell RNA Expression Map of Human Coronavirus Entry Factors
- PMID: 32946807
- PMCID: PMC7470764
- DOI: 10.1016/j.celrep.2020.108175
A Single-Cell RNA Expression Map of Human Coronavirus Entry Factors
Abstract
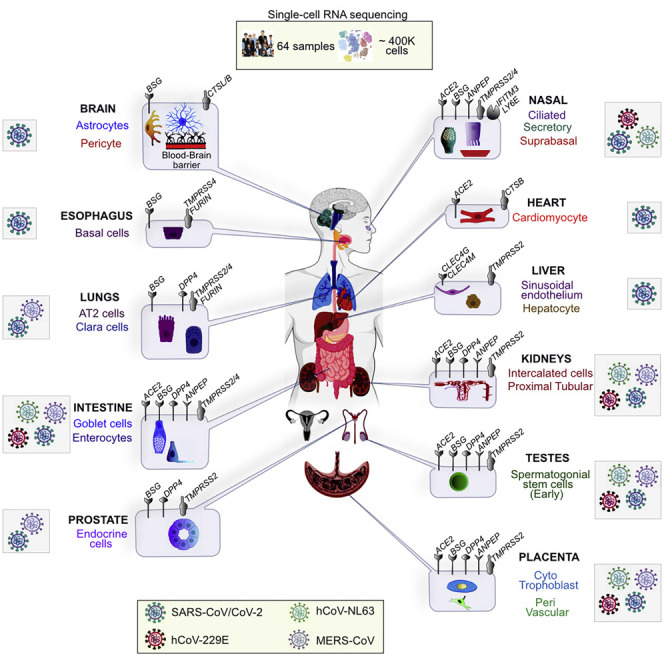
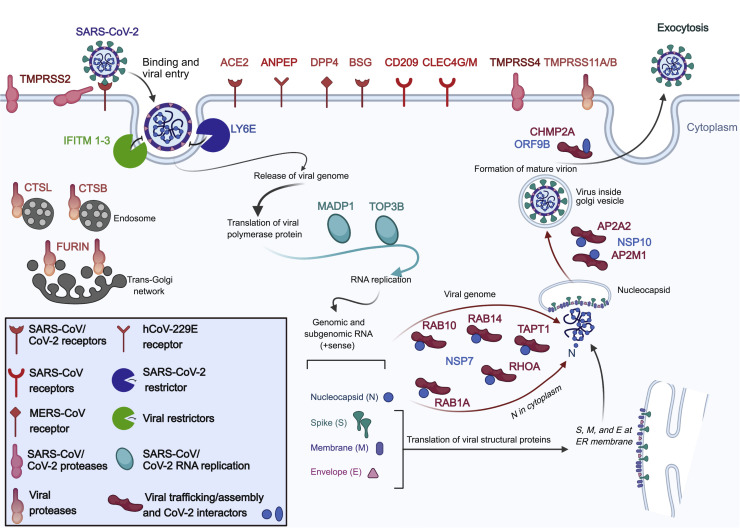
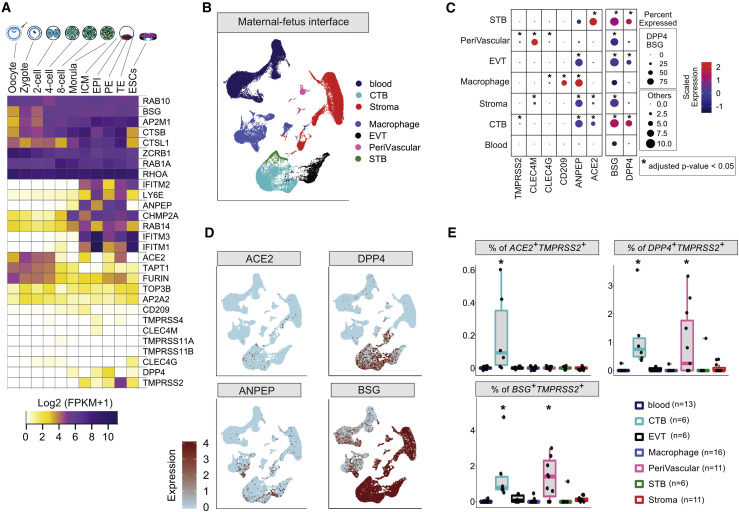
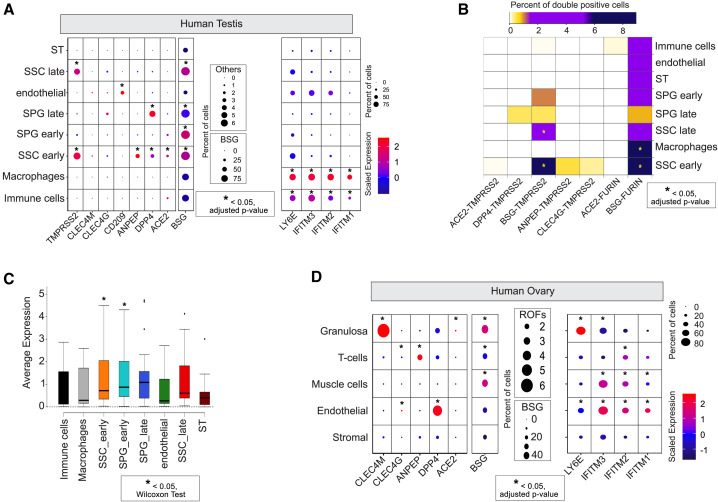
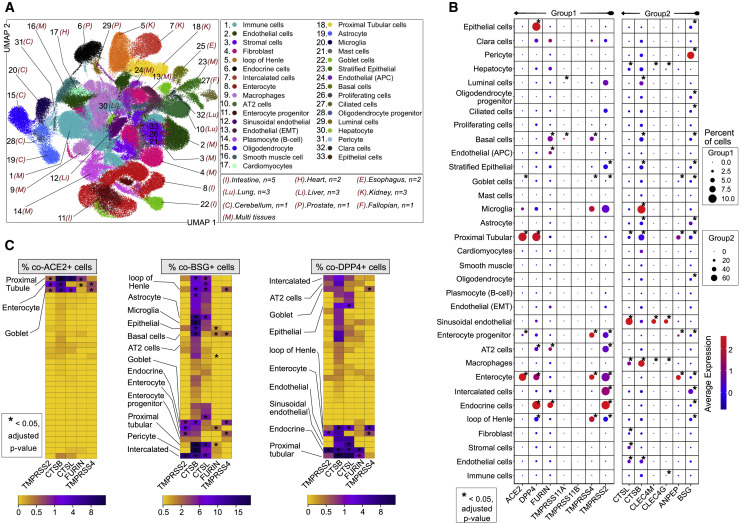
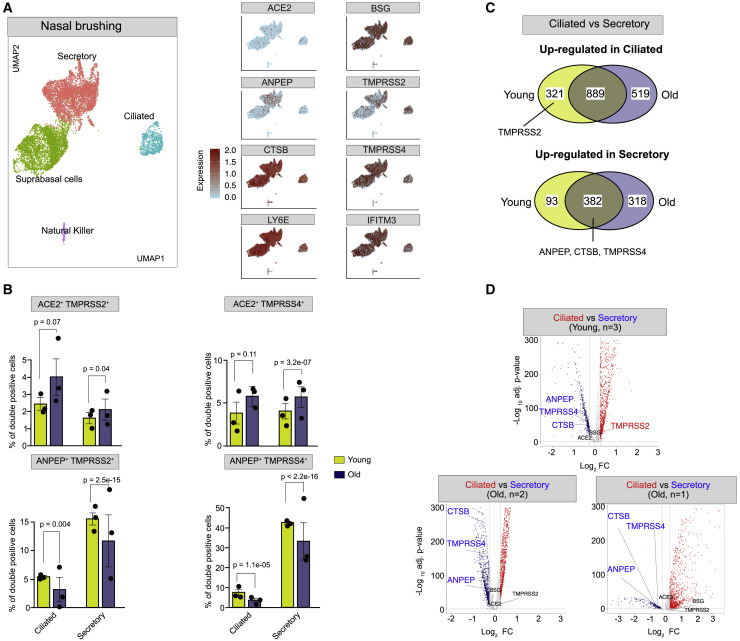
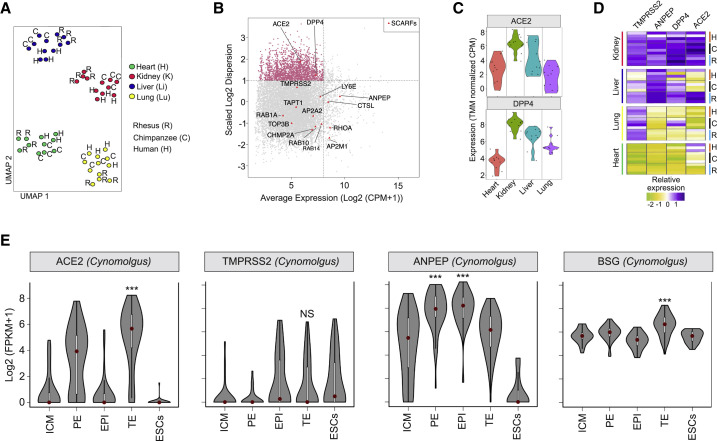
To predict the tropism of human coronaviruses, we profile 28 SARS-CoV-2 and coronavirus-associated receptors and factors (SCARFs) using single-cell transcriptomics across various healthy human tissues. SCARFs include cellular factors both facilitating and restricting viral entry. Intestinal goblet cells, enterocytes, and kidney proximal tubule cells appear highly permissive to SARS-CoV-2, consistent with clinical data. Our analysis also predicts non-canonical entry paths for lung and brain infections. Spermatogonial cells and prostate endocrine cells also appear to be permissive to SARS-CoV-2 infection, suggesting male-specific vulnerabilities. Both pro- and anti-viral factors are highly expressed within the nasal epithelium, with potential age-dependent variation, predicting an important battleground for coronavirus infection. Our analysis also suggests that early embryonic and placental development are at moderate risk of infection. Lastly, SCARF expression appears broadly conserved across a subset of primate organs examined. Our study establishes a resource for investigations of coronavirus biology and pathology.
Keywords: COVID-19; SARS-CoV-2; coronaviruses; restriction factors; scRNA-seq; viral receptors.
Copyright © 2020. Published by Elsevier Inc.
Conflict of interest statement
Declaration of Interests The authors declare no competing interests.
Figures
Update of
-
A single-cell RNA expression map of human coronavirus entry factors.bioRxiv [Preprint]. 2020 May 17:2020.05.08.084806. doi: 10.1101/2020.05.08.084806. bioRxiv. 2020. Update in: Cell Rep. 2020 Sep 22;32(12):108175. doi: 10.1016/j.celrep.2020.108175. PMID: 32511375 Free PMC article. Updated. Preprint.
-
A Single-Cell RNA Expression Map of Human Coronavirus Entry Factors.SSRN [Preprint]. 2020 May 27:3611279. doi: 10.2139/ssrn.3611279. SSRN. 2020. Update in: Cell Rep. 2020 Sep 22;32(12):108175. doi: 10.1016/j.celrep.2020.108175. PMID: 32714119 Free PMC article. Updated. Preprint.
Similar articles
-
A single-cell RNA expression map of human coronavirus entry factors.bioRxiv [Preprint]. 2020 May 17:2020.05.08.084806. doi: 10.1101/2020.05.08.084806. bioRxiv. 2020. Update in: Cell Rep. 2020 Sep 22;32(12):108175. doi: 10.1016/j.celrep.2020.108175. PMID: 32511375 Free PMC article. Updated. Preprint.
-
SARS-CoV-2 Receptor ACE2 Is an Interferon-Stimulated Gene in Human Airway Epithelial Cells and Is Detected in Specific Cell Subsets across Tissues.Cell. 2020 May 28;181(5):1016-1035.e19. doi: 10.1016/j.cell.2020.04.035. Epub 2020 Apr 27. Cell. 2020. PMID: 32413319 Free PMC article.
-
A Single-Cell RNA Expression Map of Human Coronavirus Entry Factors.SSRN [Preprint]. 2020 May 27:3611279. doi: 10.2139/ssrn.3611279. SSRN. 2020. Update in: Cell Rep. 2020 Sep 22;32(12):108175. doi: 10.1016/j.celrep.2020.108175. PMID: 32714119 Free PMC article. Updated. Preprint.
-
Differences and similarities between SARS-CoV and SARS-CoV-2: spike receptor-binding domain recognition and host cell infection with support of cellular serine proteases.Infection. 2020 Oct;48(5):665-669. doi: 10.1007/s15010-020-01486-5. Epub 2020 Jul 31. Infection. 2020. PMID: 32737833 Free PMC article. Review.
-
Angiotensin-converting enzyme 2: The old door for new severe acute respiratory syndrome coronavirus 2 infection.Rev Med Virol. 2020 Sep;30(5):e2122. doi: 10.1002/rmv.2122. Epub 2020 Jun 30. Rev Med Virol. 2020. PMID: 32602627 Free PMC article. Review.
Cited by
-
COVID-19 and human spermatozoa-Potential risks for infertility and sexual transmission?Andrology. 2021 Jan;9(1):48-52. doi: 10.1111/andr.12859. Epub 2020 Aug 5. Andrology. 2021. PMID: 32649023 Free PMC article. Review.
-
Single-nucleus transcriptomic profiling of multiple organs in a rhesus macaque model of SARS-CoV-2 infection.Zool Res. 2022 Nov 18;43(6):1041-1062. doi: 10.24272/j.issn.2095-8137.2022.443. Zool Res. 2022. PMID: 36349357 Free PMC article.
-
Deep Learning for the discovery of new pre-miRNAs: Helping the fight against COVID-19.Mach Learn Appl. 2021 Dec 15;6:100150. doi: 10.1016/j.mlwa.2021.100150. Epub 2021 Sep 9. Mach Learn Appl. 2021. PMID: 34939043 Free PMC article.
-
Recent progress on the mutations of SARS-CoV-2 spike protein and suggestions for prevention and controlling of the pandemic.Infect Genet Evol. 2021 Sep;93:104971. doi: 10.1016/j.meegid.2021.104971. Epub 2021 Jun 17. Infect Genet Evol. 2021. PMID: 34146731 Free PMC article. Review.
-
Virus Infection Variability by Single-Cell Profiling.Viruses. 2021 Aug 9;13(8):1568. doi: 10.3390/v13081568. Viruses. 2021. PMID: 34452433 Free PMC article. Review.
References
-
- Aguiar J.A., Tremblay B.J.-M., Mansfield M.J., Woody O., Lobb B., Banerjee A., Chandiramohan A., Tiessen N., Cao Q., Dvorkin-Gheva A. Gene expression and in situ protein profiling of candidate SARS-CoV-2 receptors in human airway epithelial cells and lung tissue. Eur. Respir. J. 2020 doi: 10.1183/13993003.01123-2020. Published online July 16, 2020. - DOI - PMC - PubMed
-
- Battle A., Brown C.D., Engelhardt B.E., Montgomery S.B., He Y., Jo B., Mohammadi P., Park Y.S., Parsana P., Segrè A.V., GTEx Consortium. Laboratory, Data Analysis &Coordinating Center (LDACC)—Analysis Working Group. Statistical Methods groups—Analysis Working Group. Enhancing GTEx (eGTEx) groups. NIH Common Fund. NIH/NCI. NIH/NHGRI. NIH/NIMH. NIH/NIDA. Biospecimen Collection Source Site—NDRI. Biospecimen Collection Source Site—RPCI. Biospecimen Core Resource—VARI. Brain Bank Repository—University of Miami Brain Endowment Bank. Leidos Biomedical—Project Management. ELSI Study. Genome Browser Data Integration &Visualization—EBI. Genome Browser Data Integration & Visualization—UCSC Genomics Institute, University of California Santa Cruz. Lead analysts. Laboratory, Data Analysis &Coordinating Center (LDACC) NIH program management. Biospecimen collection. Pathology. eQTL manuscript working group Genetic effects on gene expression across human tissues. Nature. 2017;550:204–213. - PubMed
Publication types
MeSH terms
Substances
Grants and funding
LinkOut - more resources
Full Text Sources
Miscellaneous
