. 2020 Oct 1;183(1):62-75.e17.
doi: 10.1016/j.cell.2020.08.039. Epub 2020 Sep 17.

pH-Gated Succinate Secretion Regulates Muscle Remodeling in Response to Exercise

Affiliations

pH-Gated Succinate Secretion Regulates Muscle Remodeling in Response to Exercise

Anita Reddy et al. Cell. .

Abstract

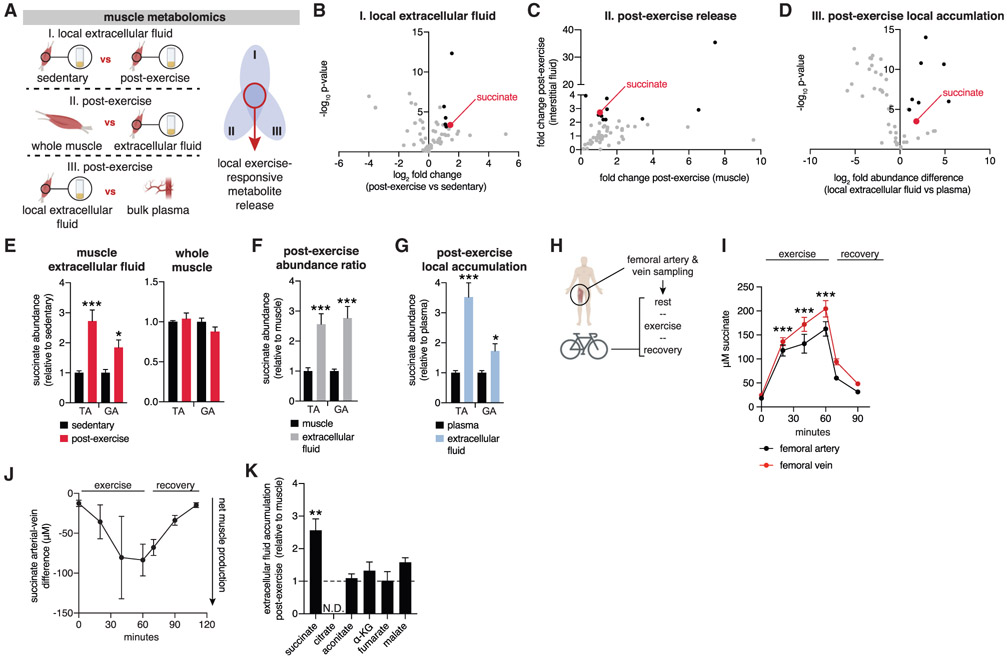
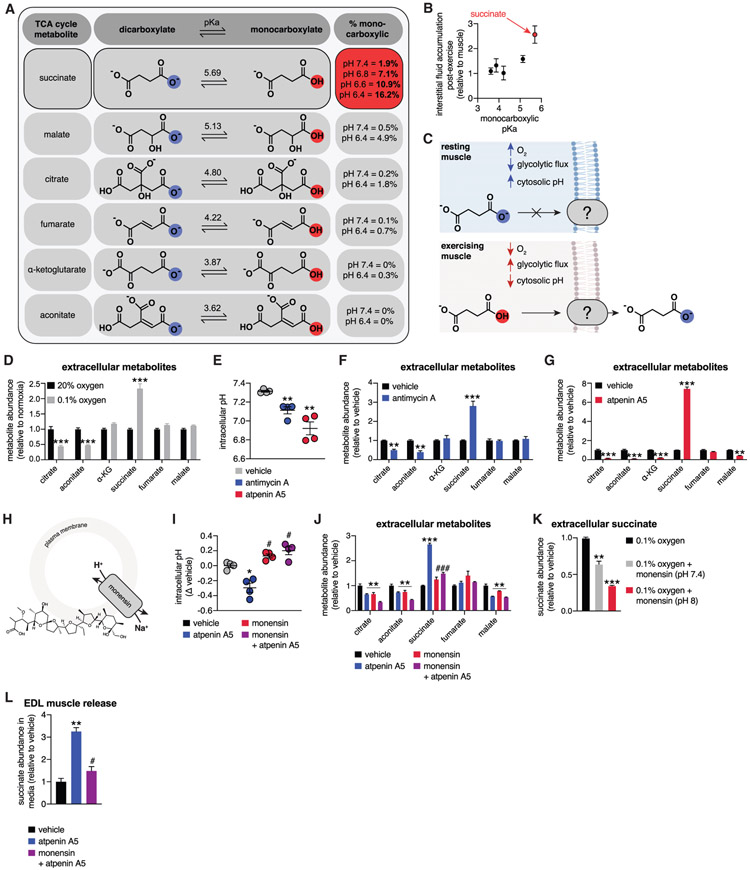
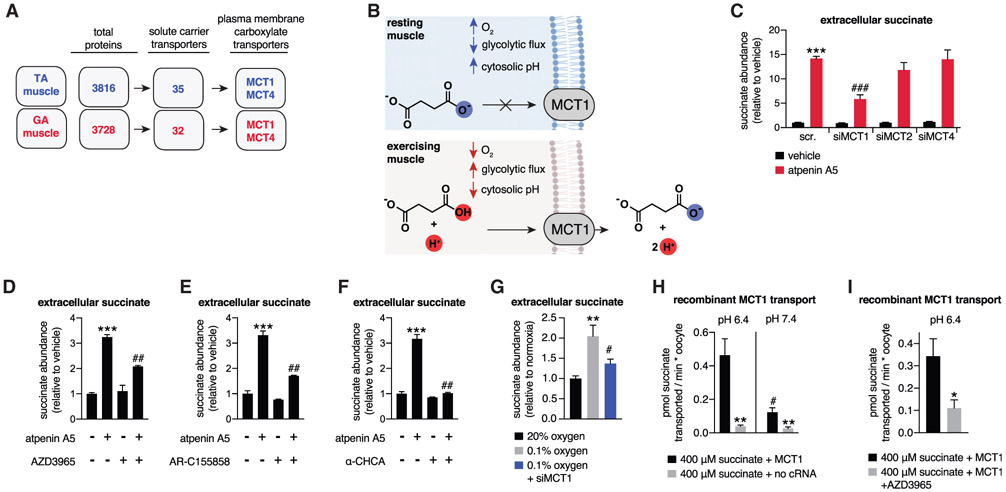
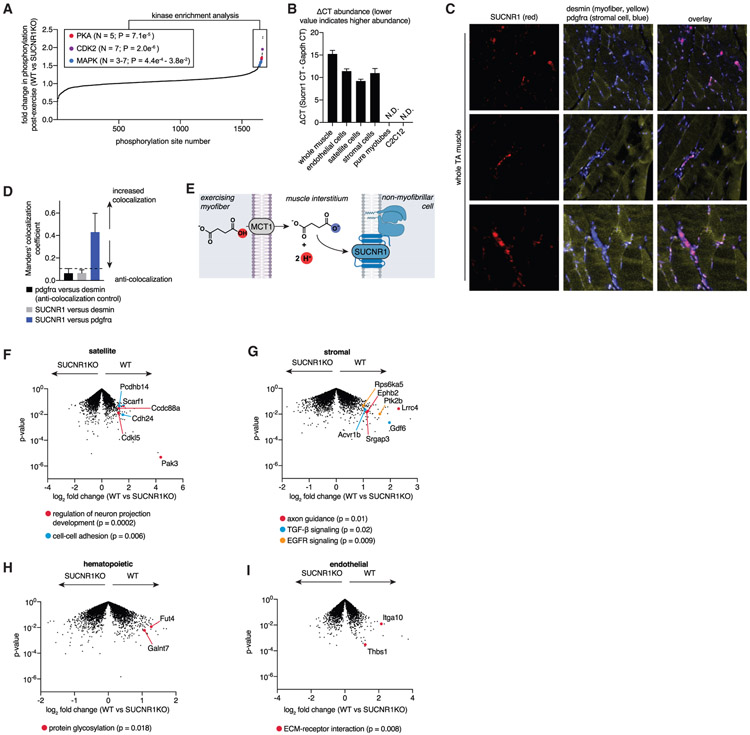
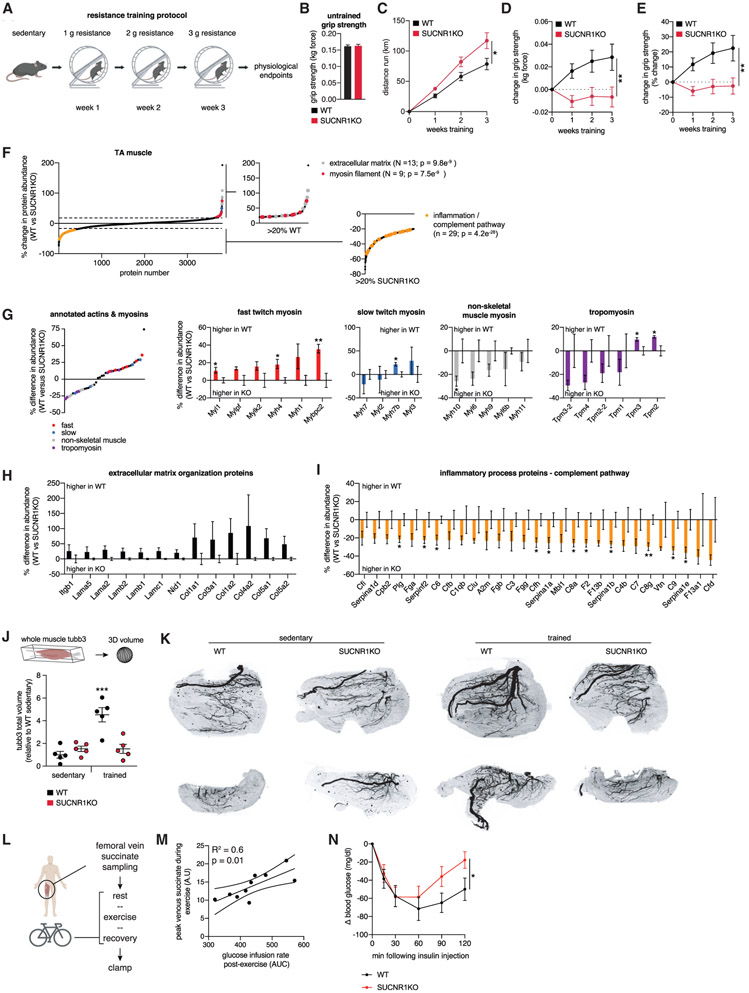
In response to skeletal muscle contraction during exercise, paracrine factors coordinate tissue remodeling, which underlies this healthy adaptation. Here we describe a pH-sensing metabolite signal that initiates muscle remodeling upon exercise. In mice and humans, exercising skeletal muscle releases the mitochondrial metabolite succinate into the local interstitium and circulation. Selective secretion of succinate is facilitated by its transient protonation, which occurs upon muscle cell acidification. In the protonated monocarboxylic form, succinate is rendered a transport substrate for monocarboxylate transporter 1, which facilitates pH-gated release. Upon secretion, succinate signals via its cognate receptor SUCNR1 in non-myofibrillar cells in muscle tissue to control muscle-remodeling transcriptional programs. This succinate-SUCNR1 signaling is required for paracrine regulation of muscle innervation, muscle matrix remodeling, and muscle strength in response to exercise training. In sum, we define a bioenergetic sensor in muscle that utilizes intracellular pH and succinate to coordinate tissue adaptation to exercise.

Keywords: SUCNR1; exercise; innervation; muscle; succinate.


Conflict of interest statement

Declaration of Interests E.T.C. has filed for a patent based on data describing the role of SUCNR1 agonism in regulation of muscle remodeling in this work.

Figures

Figure 1.
Figure 1.. Succinate Is Released Selectively by Exercising Muscle in Mice and Humans
(A) Comparative metabolomics approach to identify exercise-responsive metabolites released locally by muscle. Extracellular fluids are a combination of interstitial fluids and local circulation. (B–D) Summary results from the comparative approach, illustrating all annotated metabolites (gray), metabolites fulfilling each individual criterion (black), and metabolites fulfilling all criteria (red). (B) Metabolites accumulated in muscle extracellular fluid after exercise were defined as fold change > 2 and −log10p>3 versus sedentary extracellular fluid (n = 8). (C) Metabolites enriched post-exercise in extracellular fluid compared with whole muscle (n = 8). (D) Metabolites selectively enriched in local muscle extracellular fluid post-exercise were defined as fold change > 2 and −log10p > 3 versus post-exercise bulk plasma (n = 8). (E) Local release of succinate post-exercise occurs in tibialis anterior (TA) and gastrocnemius (GA) muscle. A selective increase in muscle extracellular fluid is observed in both muscle groups but not in whole muscle (n = 8). (F) Selective accumulation of succinate in muscle extracellular fluid post-exercise. The relative change in abundance in muscle and interstitial fluid when sedentary and post-exercise is determined separately. Then, to query relative accumulation in extracellular fluid versus muscle, the ratio of relative differences is plotted (n = 8). (G) Local accumulation of succinate in muscle extracellular fluid post-exercise. The relative change in abundance in plasma and interstitial fluid when sedentary and post-exercise is determined separately. Then, to query relative accumulation in extracellular fluid versus bulk plasma, the ratio of relative differences is plotted (n = 8). (H) Experimental design to quantify succinate release by human exercising muscle. (I) Femoral artery and vein succinate concentration during human exercise (n = 10). (J) Femoral artery-vein difference in succinate concentration during human exercise (n = 10). (K) Comparison of post-exercise enrichment of mitochondrial TCA cycle metabolites in extracellular fluid compared with whole muscle (n = 8). The relative change in abundance in muscle and extracellular fluid when sedentary and post-exercise is determined separately. Then, to query relative accumulation in interstitial fluid versus muscle, the ratio of relative differences is plotted. Data are represented as mean ± SEM. *p < 0.05, **p < 0.01, ***p < 0.005 (two-tailed Student’s t test for pairwise comparisons, one-way ANOVA for multiple comparisons involving one independent variable).
Figure 2.
Figure 2.. pH-Gated Secretion of Succinate
(A) Monocarboxylic pKa characteristics of TCA cycle metabolites. Distinctly, succinate exists in the monocarboxylic form at physiological acidic pH. (B) Relationship between the TCA cycle metabolite monocarboxylic pKa and post-exercise enrichment in interstitial fluid (n = 8). (C) A model for pH-gated release of the monocarboxylic form of succinate during exercise. (D) C2C12 myotube hypoxia drives selective succinate secretion (n = 6). (E) Promotion of glycolytic flux through acute inhibition of mitochondrial oxidative phosphorylation drives intracellular acidification in C2C12 myotubes. (n = 4). (F) Promotion of glycolytic flux through acute inhibition of mitochondrial oxidative phosphorylation with antimycin A drives selective succinate secretion in C2C12 myotubes (n = 6). (G) Promotion of glycolytic flux through acute inhibition of mitochondrial oxidative phosphorylation with atpenin A5 drives selective succinate secretion in C2C12 myotubes (n = 6). (H) Monensin equilibrates intracellular pH with extracellular pH through H+/Na+ antiport. (I) Monensin prevents intracellular acidification by acute inhibition of mitochondrial oxidative phosphorylation in C2C12 myotubes (n = 4). (J) Monensin-driven cytosolic alkalinization prevents succinate secretion initiated by acute inhibition of mitochondrial oxidative phosphorylation in C2C12 myotubes (n = 6). (K) Monensin-driven cytosolic alkalinization prevents succinate secretion initiated by hypoxia in C2C12 myotubes. pH values denote clamped extracellular pH (n = 6). (L) Promotion of glycolytic flux through acute inhibition of mitochondrial oxidative phosphorylation with atpenin A5 drives succinate secretion from intact EDL muscle, which is prevented by monensin (n = 5). Data are represented as mean ± SEM. *p or #p < 0.05, **p < 0.01, ***p < 0.005 (two-tailed Student’s t test for pairwise comparisons, one-way ANOVA for multiple comparisons involving one independent variable).
Figure 3.
Figure 3.. pH-Gated Secretion of Succinate through MCT1
(A) Muscle proteomics identified the MCT transporter family as abundant plasma membrane carboxylic acid transporters in TA and GA muscle. (B) A model of pH-gated release of the monocarboxylic form of succinate through MCT1. (C) Depletion of MCT1 inhibits secretion of succinate in C2C12 myotubes initiated by pharmacological acidification. All samples are normalized to the scr. vehicle condition, so siMCT1 does not affect basal succinate release (n = 6). (D–F) Pharmacological inhibition of MCT1 inhibits secretion of succinate in C2C12 myotubes initiated by pharmacological acidification. All inhibitors were added in parallel with atpenin A5. AZD3965 and AR-C155858 are specific MCT1 inhibitors, whereas α-CHCA inhibits all MCTs (n = 6). (G) Depletion of MCT1 prevents hypoxic secretion of succinate by C2C12 myotubes (n = 6). (H) Recombinant human MCT1 facilitates pH-dependent succinate transport in Xenopus oocytes. All rates were obtained in the first 10 min following succinate addition, which corresponds to the linear phase of uptake (n = 6). (I) Succinate transport by recombinant human MCT1 is inhibited by AZD3965. All rates were obtained in the first 10 min following succinate addition, which corresponds to the linear phase of uptake (n = 5–8). Data are represented as mean ± SEM. *p or #p < 0.05, **p < 0.01, ***p < 0.005 (two-tailed Student’s t test for pairwise comparisons, one-way ANOVA for multiple comparisons involving one independent variable).
Figure 4.
Figure 4.. Succinate-SUCNR1 Signaling Controls Non-cell-autonomous Transcriptional Responses to Acute Exercise
(A) Phosphoproteomics analysis of TA muscle immediately following exercise, comparing the relative abundance of phosphorylation of the WT and SUCNR1 KO. Sites exhibiting over 50% elevation in the WT versus SUCNR1 KO are highlighted and were subjected to kinase enrichment analysis. Top enriched pathways and those known to be downstream of SUCNR1 agonism are highlighted. A full list is provided in Table S3 (n = 4). (B) SUCNR1 is expressed in muscle tissue but not mature myotubes or immortalized C2C12 myoblasts, whereas non-myofibrillar cells resident in muscle tissue express SUCNR1 (n = 3–4). (C) TA muscle RNAScope ISH to establish cellular localization of SUCNR1. Red, SUCNR1; pdgfrα stromal cell marker; yellow, desmin myofiber marker. SUCNR1 exhibits strong colocalization with PDGFRα and anti-localization with desmin. Three representative fields of view are shown. (D) Manders’ colocalization coefficient of TA muscle RNAScope ISH data from (C). Coefficients of less than 0.1 are considered completely anti-colocalized, which is validated by the anti-colocalization control of pdgfrα and desmin (distinct cell type markers). SUCNR1 is completely anti-colocalized with desmin (myofibers) and colocalizes with pdgfrα (stromal cells) (n = 3). (E) A model of non-cell-autonomous regulation of muscle remodeling post-exercise via SUCNR1. (F) The SUCNR1-dependent transcriptional landscape post exercise in muscle satellite cells (CD45, CD31, Sca1, Vcam). Example significant pathways show decreased expression in SUCNR1 KO (highlighted). See Table S4 for a full list. (G) The SUCNR1-dependent transcriptional landscape after exercise in stromal cells (CD45, CD31, Sca1+, PDGFRa+). Example significant pathways show decreased expression in SUCNR1 KO (highlighted). See Table S4 for a full list. (H) The SUCNR1-dependent transcriptional landscape after exercise in muscle hematopoietic cells (CD45). Example significant pathways show decreased expression in SUCNR1 KO (highlighted). See Table S4 for a full list. (I) The SUCNR1-dependent transcriptional landscape after exercise in endothelial cells (CD45, CD31+). Example significant pathways show decreased expression in SUCNR1 KO (highlighted). See Table S4 for a full list. Data are represented as mean ± SEM.
Figure 5.
Figure 5.. Muscle Adaptation to Exercise Training Requires Succinate-SUCNR1 Signaling
(A) Resistance wheel training protocol. (B) Grip strength of untrained WT and SUCNR1 KO mice (n = 15 WT, n = 12 KO). (C) Distance run by WT and SUCNR1 KO mice throughout the training regimen (n = 15 WT, n = 12 KO). (D and E) Absolute (D) and percentage (E) change in grip strength during resistance wheel training (n = 15 WT, n = 12 KO). (F) Protein abundance differences between WT and SUCNR1 KO trained TA muscle. Pathways enriched in proteins exhibiting more than 20% differences between genotypes are highlighted (n = 4). (G) Actin and myosin chain protein abundance differences between WT and SUCNR1 KO trained TA muscle (n = 4). Fast-twitch myosin chains are depleted in SUCNR1 KO trained TA muscle. (H) ECM protein pathway members exhibiting decreased abundance in trained SUCNR1 KO TA muscle (n = 4). (I) Inflammatory complement pathway members exhibiting increased abundance in trained SUCNR1 KO TA muscle (n = 4). (J) Quantification of innervation in whole TA muscle by 3D tubb3 staining (n = 5). (K) Representative compressed 2D projections of muscle tubb3 volume. The top row and bottom row are representative top view and side view projections, respectively. (L) Experimental design to correlate maximal succinate release by human exercising muscle and post-exercise insulin sensitivity. (M) Correlation between maximal femoral venous succinate concentration in human exercising muscle and post-exercise insulin sensitivity (n = 10). (N) Insulin tolerance test of WT and SUCNR1 KO mice 3 h following acute treadmill running (n = 6–7). Data are represented as mean ± SEM. *p or #p < 0.05, **p < 0.01, ***p < 0.005 (two-tailed Student’s t test for pairwise comparisons, one-way ANOVA for multiple comparisons involving one independent variable).

Comment in

Similar articles

Cited by

References

    1. Andrienko TN, Pasdois P, Pereira GC, Ovens MJ, and Halestrap AP (2017). The role of succinate and ROS in reperfusion injury - A critical appraisal. J. Mol. Cell. Cardiol 110, 1–14. - PMC - PubMed
    1. Ariza AC, Deen PM, and Robben JH (2012). The succinate receptor as a novel therapeutic target for oxidative and metabolic stress-related conditions. Front. Endocrinol. (Lausanne) 3, 22. - PMC - PubMed
    1. Barker D, and Saito M (1981). Autonomic innervation of receptors and muscle fibres in cat skeletal muscle. Proc. R. Soc. Lond. B Biol. Sci 212,317–332. - PubMed
    1. Beitzel F, Gregorevic P, Ryall JG, Plant DR, Sillence MN, and Lynch GS (2004). Beta2-adrenoceptor agonist fenoterol enhances functional repair of regenerating rat skeletal muscle after injury. J. Appl. Physiol 96, 1385–1392. - PubMed
    1. Bright CM, and Ellis D (1992). Intracellular pH changes induced by hypoxia and anoxia in isolated sheep heart Purkinje fibres. Exp. Physiol 77, 165–175. - PubMed

Publication types