

How socio-economic and atmospheric variables impact COVID-19 and influenza outbreaks in tropical and subtropical regions of Brazil
- PMID: 32946893
- PMCID: PMC7492183
- DOI: 10.1016/j.envres.2020.110184
How socio-economic and atmospheric variables impact COVID-19 and influenza outbreaks in tropical and subtropical regions of Brazil
Abstract
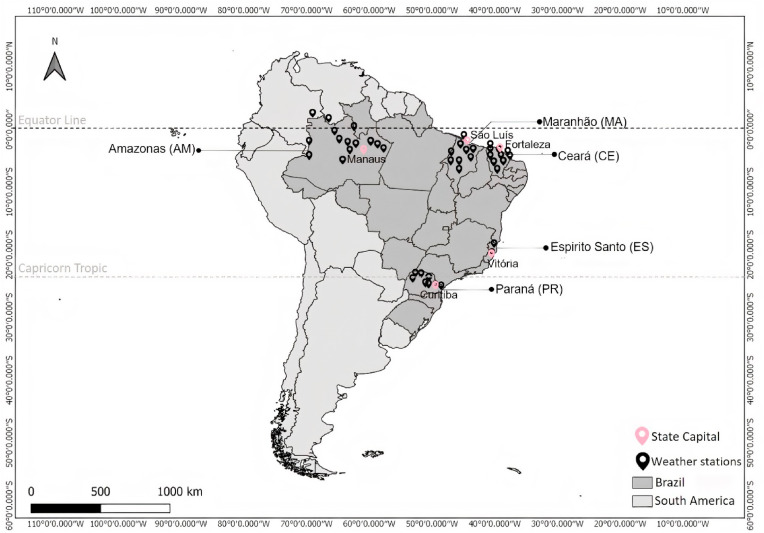
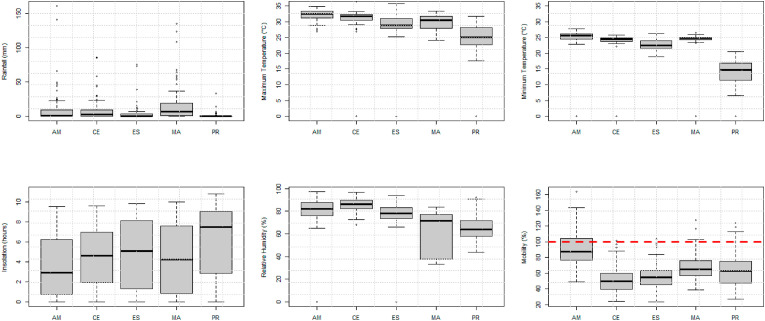
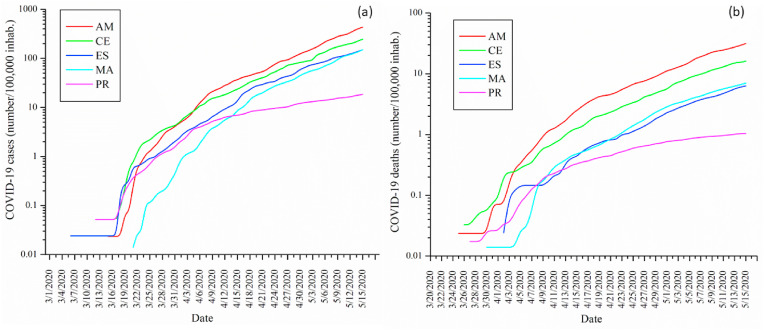
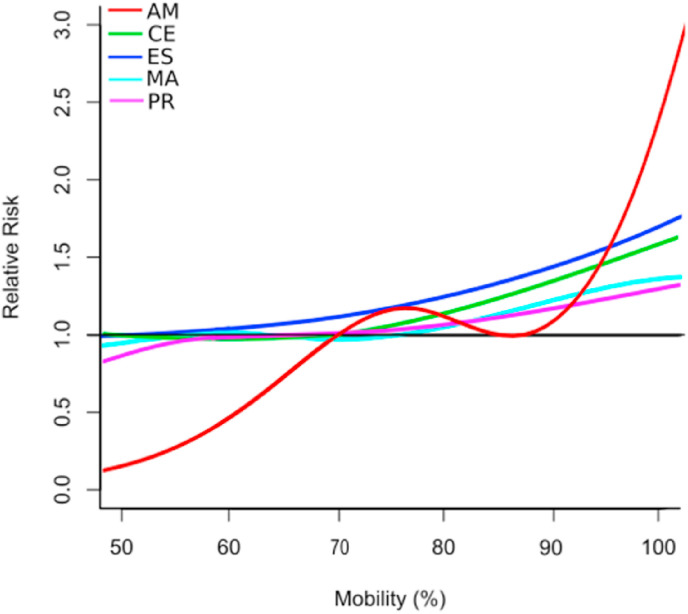
COVID-19 has been disturbing human society with an intensity never seen since the Influenza epidemic (Spanish flu). COVID-19 and Influenza are both respiratory viruses and, in this study, we explore the relations of COVID-19 and Influenza with atmospheric variables and socio-economic conditions for tropical and subtropical climates in Brazil. Atmospheric variables, mobility, socio-economic conditions and population information were analyzed using a generalized additive model for daily COVID-19 cases from March 1st to May 15th, 2020, and for daily Influenza hospitalizations (2017-2019) in Brazilian states representing tropical and subtropical climates. Our results indicate that temperature combined with humidity are risk factors for COVID-19 and Influenza in both climate regimes, and the minimum temperature was also a risk factor for subtropical climate. Social distancing is a risk factor for COVID-19 in all regions. For Influenza and COVID-19, the highest Relative Risks (RR) generally occurred in 3 days (lag = 3). Altogether among the studied regions, the most important risk factor is the Human Development Index (HDI), with a mean RR of 1.2492 (95% CI: 1.0926-1.6706) for COVID-19, followed by the elderly fraction for both diseases. The risk factor associated with socio-economic inequalities for Influenza is probably smoothed by Influenza vaccination, which is offered free of charge to the entire Brazilian population. Finally, the findings of this study call attention to the influence of socio-economic inequalities on human health.
Keywords: Climate; Respiratory diseases; SARS-CoV-2; Transmission diseases; Virus.
Copyright © 2020 Elsevier Inc. All rights reserved.
Conflict of interest statement
The authors declare that they have no known competing financial interests or personal relationships that could have appeared to influence the work reported in this paper.
Figures
References
-
- Alvares C.A., Stape J.L., Sentelhas P.C., De Moraes Gonçalves J.L., Sparovek G. Köppen’s climate classification map for Brazil. Meteorol. Z. 2013;22:711–728. doi: 10.1127/0941-2948/2013/0507. - DOI
-
- Auler A.C., Cássaro F.A.M., da Silva V.O., Pires L.F. Evidence that high temperatures and intermediate relative humidity might favor the spread of COVID-19 in tropical climate: a case study for the most affected Brazilian cities. Sci. Total Environ. 2020;729 doi: 10.1016/j.scitotenv.2020.139090. - DOI - PMC - PubMed
-
- Banerjee A., Pasea L., Harris S., Gonzalez-Izquierdo A., Torralbo A., Shallcross L., Noursadeghi M., Pillay D., Sebire N., Holmes C., Pagel C., Wong W.K., Langenberg C., Williams B., Denaxas S., Hemingway H. Estimating excess 1-year mortality associated with the COVID-19 pandemic according to underlying conditions and age: a population-based cohort study. Lancet. 2020;395:1715–1725. doi: 10.1016/s0140-6736(20)30854-0. - DOI - PMC - PubMed
MeSH terms
LinkOut - more resources
Full Text Sources
Medical
Miscellaneous
