

Differentiating High-Grade Gliomas from Brain Metastases at Magnetic Resonance: The Role of Texture Analysis of the Peritumoral Zone
- PMID: 32947822
- PMCID: PMC7565295
- DOI: 10.3390/brainsci10090638
Differentiating High-Grade Gliomas from Brain Metastases at Magnetic Resonance: The Role of Texture Analysis of the Peritumoral Zone
Abstract
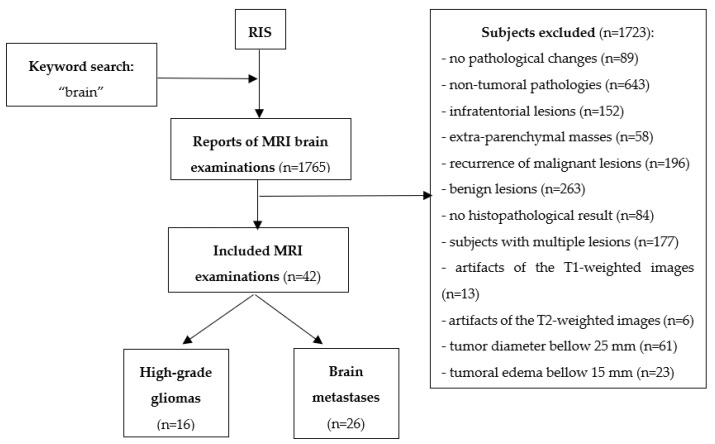
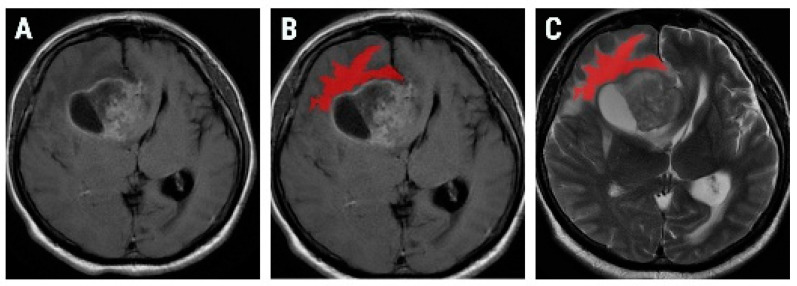
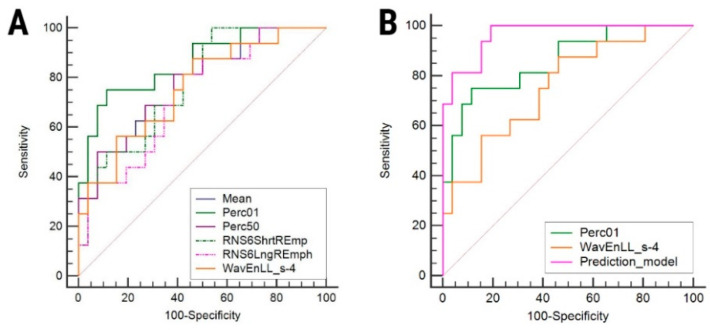
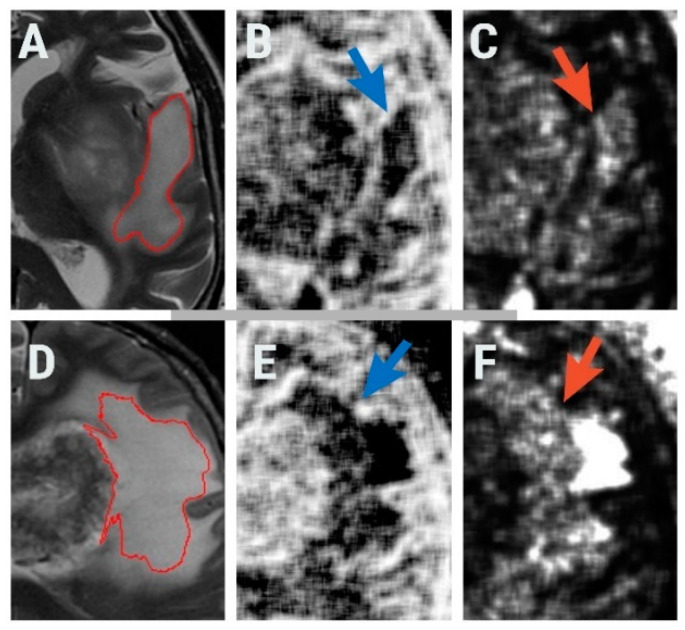
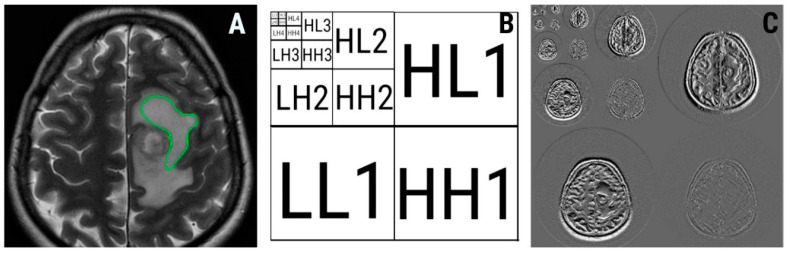
High-grade gliomas (HGGs) and solitary brain metastases (BMs) have similar imaging appearances, which often leads to misclassification. In HGGs, the surrounding tissues show malignant invasion, while BMs tend to displace the adjacent area. The surrounding edema produced by the two cannot be differentiated by conventional magnetic resonance (MRI) examinations. Forty-two patients with pathology-proven brain tumors who underwent conventional pretreatment MRIs were retrospectively included (HGGs, n = 16; BMs, n = 26). Texture analysis of the peritumoral zone was performed on the T2-weighted sequence using dedicated software. The most discriminative texture features were selected using the Fisher and the probability of classification error and average correlation coefficients. The ability of texture parameters to distinguish between HGGs and BMs was evaluated through univariate, receiver operating, and multivariate analyses. The first percentile and wavelet energy texture parameters were independent predictors of HGGs (75-87.5% sensitivity, 53.85-88.46% specificity). The prediction model consisting of all parameters that showed statistically significant results at the univariate analysis was able to identify HGGs with 100% sensitivity and 66.7% specificity. Texture analysis can provide a quantitative description of the peritumoral zone encountered in solitary brain tumors, that can provide adequate differentiation between HGGs and BMs.
Keywords: computer-aided diagnosis; glioblastoma; magnetic resonance imaging; texture analysis.
Conflict of interest statement
The authors declare no conflict of interest.
Figures
Similar articles
-
CT in the Differentiation of Gliomas from Brain Metastases: The Radiomics Analysis of the Peritumoral Zone.Brain Sci. 2022 Jan 14;12(1):109. doi: 10.3390/brainsci12010109. Brain Sci. 2022. PMID: 35053852 Free PMC article.
-
Diagnostic value of apparent diffusion coefficient in differentiating between high-grade gliomas and brain metastases.Acta Radiol. 2018 May;59(5):599-605. doi: 10.1177/0284185117727787. Epub 2017 Aug 23. Acta Radiol. 2018. PMID: 28835111
-
Quantitative apparent diffusion coefficients in the characterization of brain tumors and associated peritumoral edema.Acta Radiol. 2009 Jul;50(6):682-9. doi: 10.1080/02841850902933123. Acta Radiol. 2009. PMID: 19449234
-
Multiple high-grade gliomas: epidemiology, management, and outcome. A systematic review and meta-analysis.Neurosurg Rev. 2019 Jun;42(2):263-275. doi: 10.1007/s10143-017-0928-7. Epub 2017 Nov 14. Neurosurg Rev. 2019. PMID: 29138949
-
Differentiating Glioblastomas from Solitary Brain Metastases: An Update on the Current Literature of Advanced Imaging Modalities.Cancers (Basel). 2021 Jun 13;13(12):2960. doi: 10.3390/cancers13122960. Cancers (Basel). 2021. PMID: 34199151 Free PMC article. Review.
Cited by
-
Peritumoral Brain Zone in Astrocytoma: Morphology, Molecular Aspects, and Clinical Manifestations (Review).Sovrem Tekhnologii Med. 2024;16(2):79-88. doi: 10.17691/stm2024.16.2.08. Epub 2024 Apr 27. Sovrem Tekhnologii Med. 2024. PMID: 39539752 Free PMC article. Review.
-
Differentiating Enchondromas and Atypical Cartilaginous Tumors in Long Bones with Computed Tomography and Magnetic Resonance Imaging.Diagnostics (Basel). 2022 Sep 9;12(9):2186. doi: 10.3390/diagnostics12092186. Diagnostics (Basel). 2022. PMID: 36140587 Free PMC article.
-
CT-Based Radiomic Analysis May Predict Bacteriological Features of Infected Intraperitoneal Fluid Collections after Gastric Cancer Surgery.Healthcare (Basel). 2022 Jul 10;10(7):1280. doi: 10.3390/healthcare10071280. Healthcare (Basel). 2022. PMID: 35885807 Free PMC article.
-
Discrimination Between Glioblastoma and Solitary Brain Metastasis Using Conventional MRI and Diffusion-Weighted Imaging Based on a Deep Learning Algorithm.J Digit Imaging. 2023 Aug;36(4):1480-1488. doi: 10.1007/s10278-023-00838-5. Epub 2023 May 8. J Digit Imaging. 2023. PMID: 37156977 Free PMC article.
-
High-Resolution 3D versus Standard-Resolution 2D T2-Weighted Turbo Spin Echo MRI for the Assessment of Lumbar Nerve Root Compromise.Tomography. 2022 Jan 24;8(1):257-266. doi: 10.3390/tomography8010020. Tomography. 2022. PMID: 35202186 Free PMC article.
References
-
- Oh J., Cha S., Aiken A.H., Han E.T., Crane J.C., Stainsby J.A., Wright G.A., Dillon P.D., Nelson S.J. Quantitative apparent diffusion coefficients and T2 relaxation times in characterizing contrast enhancing brain tumors and regions of peritumoral edema. J. Magn. Reason. Imaging. 2005;21:701–708. doi: 10.1002/jmri.20335. - DOI - PubMed
LinkOut - more resources
Full Text Sources
