. 2020 Sep 16;25(18):4254.
doi: 10.3390/molecules25184254.

Antiproliferative and Pro-Apoptotic Effect of Uvaol in Human Hepatocarcinoma HepG2 Cells by Affecting G0/G1 Cell Cycle Arrest, ROS Production and AKT/PI3K Signaling Pathway

Affiliations

Antiproliferative and Pro-Apoptotic Effect of Uvaol in Human Hepatocarcinoma HepG2 Cells by Affecting G0/G1 Cell Cycle Arrest, ROS Production and AKT/PI3K Signaling Pathway

Gloria C Bonel-Pérez et al. Molecules. .

Abstract

Natural products have a significant role in the development of new drugs, being relevant the pentacyclic triterpenes extracted from Olea europaea L. Anticancer effect of uvaol, a natural triterpene, has been scarcely studied. The aim of this study was to understand the anticancer mechanism of uvaol in the HepG2 cell line. Cytotoxicity results showed a selectivity effect of uvaol with higher influence in HepG2 than WRL68 cells used as control. Our results show that uvaol has a clear and selective anticancer activity in HepG2 cells supported by a significant anti-migratory capacity and a significant increase in the expression of HSP-60. Furthermore, the administration of this triterpene induces cell arrest in the G0/G1 phase, as well as an increase in the rate of cell apoptosis. These results are supported by a decrease in the expression of the anti-apoptotic protein Bcl2, an increase in the expression of the pro-apoptotic protein Bax, together with a down-regulation of the AKT/PI3K signaling pathway. A reduction in reactive oxygen species (ROS) levels in HepG2 cells was also observed. Altogether, results showed anti-proliferative and pro-apoptotic effect of uvaol on hepatocellular carcinoma, constituting an interesting challenge in the development of new treatments against this type of cancer.

Keywords: AKT/PI3K signaling pathway; ROS level; apoptosis; human hepatocarcinoma HepG2 cells; migration activity; oxidative stress; proliferation; uvaol.


Conflict of interest statement

The authors declare no conflict of interest. The funders had no role in the design of the study; in the collection, analyses, or interpretation of data; in the writing of the manuscript, or in the decision to publish the results.

Figures
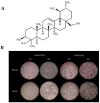
Figure 1
Figure 1
Chemical structure of uvaol (PubChem) (A). Morphological changes in response to uvaol treatment incubated at IC50 after 24 h in the WRL68 (IC50: 54.3 µg/mL) and HepG2 (IC50: 25.2 µg/mL) cell lines (B).
Figure 2
Figure 2
Cytotoxicity curves of uvaol during 24, 48 and 72 h in WRL68 (A) and HepG2 cells (B). IC20, IC50 and IC80 values for the WRL68 and HepG2 lines after 24, 48 and 72 h of incubation with uvaol (C). These values are represented by mean ± SEM (n = 9).
Figure 3
Figure 3
Representative image from wound healing assay of cells treated and no treated with uvaol at IC50 concentration (0, 6, 18, 30 and 42 h) in WRL68 and HepG2 cells. In the graph, quantification of the cell-free region is showed during the time of wound healing assay (AU: arbitrary units).
Figure 4
Figure 4
Cell cycle analysis obtained according to the Muse™ cell cycle kit. Panel (A) correspond to WRL68 cells and panel (B) to HepG2 cells. The cells were treated with IC50 of uvaol for 24 h. Top: histograms from a representative experiment show the effect of uvaol on cell cycle profile. Bottom: percentage of cells in each cellular cycle phase. Values are expressed as mean ± SEM (n = 12). Different letters indicate significant differences (p < 0.05) between control and uvaol treatment within each phases of the cell cycle for WRL168 or HepG2 cells. The inclusion of asterisks indicates significant differences (p < 0.05) between the different cells lines (WRL168 vs. HepG2), under the same treatment (control or uvaol) and phase of cell cycle.
Figure 5
Figure 5
Apoptosis analysis obtained according to the Muse™ apoptosis kit. Panel (A) corresponds to the WRL68 cells and panel (B) to the HepG2 cells. Treatments included cells not treated (negative control) and cells incubated with staurosporine (1 μg/mL, positive control) or IC50 of uvaol for 24 h. Top: dot plots show a representative experiment of the different treatments. Bottom: percentage of lived, apoptotic and necrotic cells for each treatment. Values are expressed as mean ± SEM (n = 12). Different letters indicate significant differences (p < 0.05) between control and uvaol treatment within apoptosis stage (viable, apoptosis or necrosis) for WRL168 or HepG2 cells. The inclusion of asterisks indicates significant differences (p < 0.05) between different cells lines (WRL168 vs. HepG2), under the same treatment (control or uvaol) and apoptosis stage.
Figure 6
Figure 6
Reactive oxygen species (ROS) quantification was performed according to the Muse™ Oxidative stress kit. Panel (A) corresponds to the WRL68 cells and panel (B) to the HepG2 cells. Treatments included cells not treated and cells incubated with IC50 of uvaol for 24 h. Top: dot plots show a representative experiment of the different treatments. Bottom: percentage of ROS negative (ROS−) and ROS positive (ROS+) values observed for each treatment. Values are expressed as mean ± SEM (n = 12). Different letters indicate significant differences between ROS levels for each treatment and an asterisk indicates significant differences between cell lines for each treatment and ROS levels (p < 0.05).
Figure 7
Figure 7
Western-blot analysis of p53, c-Myc, Bcl-2, SOD, HSP-60 and Bax protein levels in WRL68 and HepG2 cells, untreated (WC and HC) and exposed to IC50 of uvaol for 24 h (WT and HT). The quantification of protein levels by densitometric analysis is shown in bar graphs. The results are the means ± SEM (n = 9) and are expressed as percentage of expression compared to actin. WRL68 values were used as 100% of expression and the rest of treatments were referred to them. Different letters indicate significant differences between treatments for each cell line and an asterisk indicates significant differences between cell lines for each treatment (p < 0.05).
Figure 8
Figure 8
AKT/PI3K and ERK/1/2/MAPK dual pathway determination was performed according to the Muse™ PI3K/MAPK Dual Pathway activation kit. Panel (A) correspond to WRL68 cells and panel (B) to HepG2 cells. Treatments included cells not treated and cells incubated with IC50 of uvaol for 24 h. Top: dot plots show a representative experiment of the different treatments. Bottom: percentage of non-activated cells and cells with PI3K, MAPK and Dual pathway activated for each treatment. Values are expressed as mean ± SEM (n = 12). Different letters indicate significant differences between treatments for each activated pathway and an asterisk indicates significant differences between cell lines for each treatment and activated pathway (p < 0.05).

References

    1. Bray F., Ferlay J., Soerjomataram I., Siegel R.L., Torre L.A., Jemal A. Global Cancer Statistics 2018: GLOBOCAN Estimates of incidence and mortality worldwide for 36 cancers in 185 countries. CA Cancer J. Clin. 2018;68:394–424. doi: 10.3322/caac.21492. - DOI - PubMed
    1. European Association for the Study of the Liver EASL Clinical practice guidelines: Management of hepatocellular carcinoma. J. Hepatol. 2018;69:182–236. doi: 10.1016/j.jhep.2018.03.019. - DOI - PubMed
    1. Shin J.W., Chung Y.H. Molecular targeted therapy for hepatocellular carcinoma: Current and future. World J. Gastroenterol. 2013;19:6144–6155. doi: 10.3748/wjg.v19.i37.6144. - DOI - PMC - PubMed
    1. Justman Q.A. Looking beyond the stop sign: Cell-cycle checkpoints reconsidered. Cell Syst. 2017;5:438–440. doi: 10.1016/j.cels.2017.11.004. - DOI - PubMed
    1. Chen J.D. The cell-cycle arrest and apoptotic functions of p53 in tumor initiation and progression. Csh. Perspect Med. 2016;6:a026104. doi: 10.1101/cshperspect.a026104. - DOI - PMC - PubMed

MeSH terms