. 2020 Sep 16;21(18):6802.
doi: 10.3390/ijms21186802.

A Screening of Antineoplastic Drugs for Acute Myeloid Leukemia Reveals Contrasting Immunogenic Effects of Etoposide and Fludarabine

Affiliations

A Screening of Antineoplastic Drugs for Acute Myeloid Leukemia Reveals Contrasting Immunogenic Effects of Etoposide and Fludarabine

Darina Ocadlikova et al. Int J Mol Sci. .

Abstract

Background: Recent evidence demonstrated that the treatment of acute myeloid leukemia (AML) cells with daunorubicin (DNR) but not cytarabine (Ara-C) results in immunogenic cell death (ICD). In the clinical setting, chemotherapy including anthracyclines and Ara-C remains a gold standard for AML treatment. In the last decade, etoposide (Eto) and fludarabine (Flu) have been added to the standard treatment for AML to potentiate its therapeutic effect and have been tested in many trials. Very little data are available about the ability of these drugs to induce ICD.

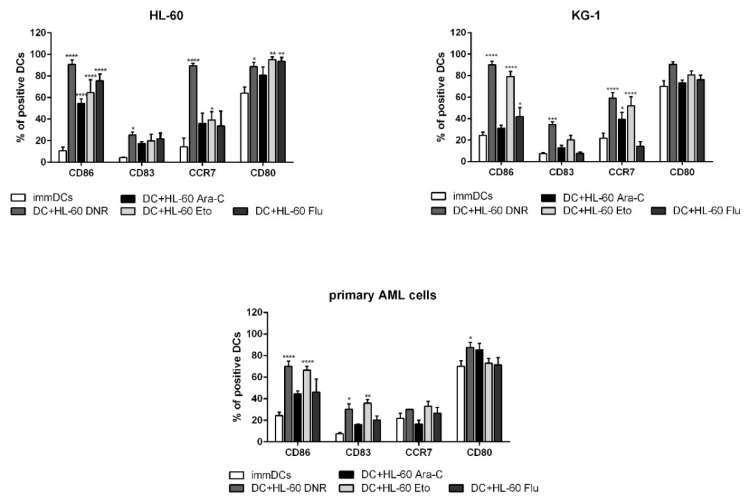
Methods: AML cells were treated with all four drugs. Calreticulin and heat shock protein 70/90 translocation, non-histone chromatin-binding protein high mobility group box 1 and adenosine triphosphate release were evaluated. The treated cells were pulsed into dendritic cells (DCs) and used for in vitro immunological tests.

Results: Flu and Ara-C had no capacity to induce ICD-related events. Interestingly, Eto was comparable to DNR in inducing all ICD events, resulting in DC maturation. Moreover, Flu was significantly more potent in inducing suppressive T regulatory cells compared to other drugs.

Conclusions: Our results indicate a novel and until now poorly investigated feature of antineoplastic drugs commonly used for AML treatment, based on their different immunogenic potential.

Keywords: acute myeloid leukemia; chemotherapy; etoposide; fludarabine; immunogenic cell death.


Conflict of interest statement

The authors declare no conflict of interest.

Figures

Figure 1
Figure 1
Flow cytometry analysis of acute myeloid leukemia (AML) cell apoptosis after chemotherapy treatment. The HL-60, KG-1 and primary AML cells were treated with daunorubicin (DNR) (500 ng/mL), cytarabine (Ara-C) (20 µg/mL), etoposide (Eto) (20 µg/mL) or fludarabine (Flu) (70 µg/mL) for 24 h. The percentage of apoptotic Ann-V+ cells was assessed by flow cytometry. The values are calculated as differences between treated and un-treated cells and represented as mean ± SEM of 5 independent experiments.
Figure 2
Figure 2
Flow cytometry analysis of calreticulin (CRT) and heat-shock protein (HSP) translocation on the cell-surface of acute myeloid leukemia (AML) cells after chemotherapy treatment. The HL-60, KG-1 and primary AML cells were treated with daunorubicin (DNR) (500 ng/mL), cytarabine (Ara-C) (20 µg/mL), etoposide (Eto) (20 µg/mL) and fludarabine (Flu) (70 µg/mL) for 24 h. The percentage of CRT+, HSP70+ and HSP90+ cells (gated on apoptotic Ann-V+ cells) was analyzed by flow cytometry. Un-treated cells (no treatment; NT) were used as a negative control. The values are represented as mean ± SEM of 5 independent experiments. * p <0.05; ** p < 0.01; *** p < 0.001; **** p < 0.0001 compared to un-treated cells.
Figure 3
Figure 3
Immunofluorescence analysis of calreticulin (CRT) translocation on the cell-surface of HL-60 cell lines after chemotherapy treatment. The HL-60 cells were treated or not (no treatment; NT) with daunorubicin (DNR) (500 ng/mL), cytarabine (Ara-C) (20 µg/mL), etoposide (Eto) (20 µg/mL) and fludarabine (Flu) (70 µg/mL) for 24 h. (A) The localization of CRT (FITC-conjugated) at cell membrane level with respect to the nucleus (DAPI-conjugated) was evaluated by immunofluorescence microscopy. One representative experiment for each drug is reported. Bar 20 µm. (B) Quantitative analysis of CRT+ cells by immunofluorescence. A total of 100 cells were used for the quantification. ** p < 0.01; *** p < 0.001.
Figure 4
Figure 4
Immunofluorescence analysis of non-histone chromatin-binding protein high mobility group box 1 (HMGB1) release from the nucleus of HL-60 cell lines after chemotherapy treatment. The HL-60 cells were treated or not (no treatment; NT) with daunorubicin (DNR) (500 ng/mL), cytarabine (Ara-C) (20 µg/mL), etoposide (Eto) (20 µg/mL) and fludarabine (Flu) (70 µg/mL) for 24 h. (A) The release of HMGB1 (FITC-conjugated) from nucleus (DAPI-conjugated) to cytoplasm and then extracellular space was visualized by immunofluorescence microscopy. One representative experiment for each drug is reported. Bar 20 µm. (B) Quantitative analysis of HMGB1 fluorescence intensity outside the nucleus in un-treated and treated HL-60 cells. A representative field was used for quantification. The signal outside the nucleus was measured by densitometry (n = 21; randomly selected cells). The cells are grouped in classes of fluorescence intensity and plotted relative to HMGB1 expression.
Figure 5
Figure 5
Luminescence analysis of adenosine triphosphate (ATP) release from HL-60, KG-1 and primary AML cells treated with chemotherapy. Indirect measurement of ATP by quantification of emitted bioluminescence in supernatants of HL-60, KG-1 and primary AML cells treated or not (no treatment; NT) with daunorubicin (DNR) (500 ng/mL), cytarabine (Ara-C) (20 µg/mL), etoposide (Eto) (20 µg/mL) and Fludarabine (Flu) (70 µg/mL) for 24 h, was expressed as fold change. The values of un-treated cells were equal to 1. The values are represented as mean ± SEM of 5/3/3 independent experiments for HL-60/KG-1/primary AML cells, respectively. * p < 0.05; compared to un-treated cells.
Figure 6
Figure 6
Flow cytometry analysis of dendritic cell (DC) maturation mediated by HL-60, KG-1 and primary AML cells treated with chemotherapy. The HL-60, KG-1 and primary AML cells were treated with daunorubicin (DNR) (500 ng/mL), cytarabine (Ara-C) (20 µg/mL), etoposide (Eto) (20 µg/mL) and fludarabine (Flu) (70 µg/mL) for 4 h and loaded in immature (imm) DCs for another 20 h. The DC phenotype was evaluated by flow cytometry. Un-loaded immature immDCs were used as a negative control. The values are represented as mean ± SEM of 5/3/3 independent experiments for HL-60/KG-1/primary AML cells, respectively. * p < 0.05; ** p < 0.01; *** p < 0.001; **** p < 0.0001 compared to immDCs.
Figure 7
Figure 7
Flow cytometry analysis of CD3+ T-cell proliferation mediated by dendritic cells (DCs) loaded with chemotherapy-treated HL-60, KG-1 and primary AML cells. The HL-60, KG-1 and primary AML cells were treated with daunorubicin (DNR) (500 ng/mL), cytarabine (Ara-C) (20 µg/mL), etoposide (Eto) (20 µg/mL) and fludarabine (Flu) (70 µg/mL) for 4 h and loaded in immature DCs (immDCs) for 24 h. After 24 h, un-loaded immDCs or DCs loaded with treated HL-60, KG-1 and primary AML cells were used as a stimulus for CD3+ T cells for 5 days. The proliferation index of CD3+ T cells was then analyzed by flow cytometry and expressed as fold change. Un-stimulated CD3+ T cells were used as reference and set as 1. The values are represented as mean ± SEM of 5/3/3 independent experiments for HL-60/KG-1/primary AML cells, respectively. * p < 0.05; ** p < 0.01; **** p < 0.0001 compared to un-stimulated CD3+ T cells.
Figure 8
Figure 8
Flow cytometry analysis of T regulatory cells (Tregs) induced by dendritic cells (DCs) loaded with chemotherapy-treated HL-60, KG-1 and primary AML cells. The HL-60, KG-1 and primary AML cells were treated or not (no treatment; NT) with daunorubicin (DNR) (500 ng/mL), cytarabine (Ara-C) (20 µg/mL), etoposide (Eto) (20 µg/mL) and fludarabine (Flu) (70 µg/mL) for 4 h and loaded in immature DCs (immDCs) for 24 h. After 24 h, un-loaded immDCs or DCs loaded with treated HL-60, KG-1 and primary AML cells were mixed with CD3+ T cells for 5 days. The Tregs phenotype was then analyzed by flow cytometry. (A) Induction of total Tregs was characterized as CD3+CD4+CD25+/highCD127−/low T cells and expressed as fold change. (B) Induction of suppressive subtype of Tregs was characterized as CD3+CD4+CD25highCD127−/low CD45RA/FOXP3+/high T cells and expressed as fold change. (C) Mean of fluorescence intensity (MFI) of programmed cell death protein 1 (PD-1) expressed on suppressive Tregs was expressed as fold change. The values are represented as mean ± SEM of 5/3/3 independent experiments for HL-60/KG-1/primary AML cells, respectively. CD3 cells stimulated with unloaded immDCs were used as reference and set as 1. * p < 0.05; ** p < 0.01; *** p < 0.001; **** p < 0.0001 compared to CD3 cells stimulated with un-loaded immDCs.

References

    1. Lecciso M., Ocadlikova D., Sangaletti S., Trabanelli S., De Marchi E., Orioli E., Pegoraro A., Portararo P., Jandus C., Bontadini A., et al. ATP Release from Chemotherapy-Treated Dying Leukemia Cells Elicits an Immune Suppressive Effect by Increasing Regulatory T Cells and Tolerogenic Dendritic Cells. Front. Immunol. 2017;8:1918. doi: 10.3389/fimmu.2017.01918. - DOI - PMC - PubMed
    1. Fucikova J., Kralikova P., Fialova A., Brtnicky T., Rob L., Bartunkova J., Spísek R. Human tumor cells killed by anthracyclines induce a tumor-specific immune response. Cancer Res. 2011;71:4821–4833. doi: 10.1158/0008-5472.CAN-11-0950. - DOI - PubMed
    1. Fucikova J., Truxova I., Hensler M., Becht E., Kasikova L., Moserova I., Vosahlikova S., Klouckova J., Church S.E., Cremer I., et al. Calreticulin exposure by malignant blasts correlates with robust anticancer immunity and improved clinical outcome in AML patients. Blood. 2016;128:3113–3124. doi: 10.1182/blood-2016-08-731737. - DOI - PMC - PubMed
    1. Wemeau M., Kepp O., Tesnière A., Panaretakis T., Flament C., De Botton S., Zitvogel L., Kroemer G., Chaput N. Calreticulin exposure on malignant blasts predicts a cellular anticancer immune response in patients with acute myeloid leukemia. Cell Death Dis. 2010;1:e104. doi: 10.1038/cddis.2010.82. - DOI - PMC - PubMed
    1. Kroemer G., Galluzzi L., Kepp O., Zitvogel L. Immunogenic cell death in cancer therapy. Annu. Rev. Immunol. 2013;31:51–72. doi: 10.1146/annurev-immunol-032712-100008. - DOI - PubMed

MeSH terms