

Geostatistical analysis and mapping: social and environmental determinants of under-five child mortality, evidence from the 2014 Ghana demographic and health survey
- PMID: 32948152
- PMCID: PMC7501707
- DOI: 10.1186/s12889-020-09534-3
Geostatistical analysis and mapping: social and environmental determinants of under-five child mortality, evidence from the 2014 Ghana demographic and health survey
Abstract
Background: Under-five mortality (U5M) rates are among the health indicators of utmost importance globally. It is the goal 3 target 2.1 of the Sustainable Development Goals that is expected to be reduced to at least 25 per 1000 livebirths by 2030. Despite a considerable reduction in U5M observed globally, several countries especially those in sub-Saharan Africa (SSA) like Ghana are struggling to meet this target. Evidence-based targeting and utilization of the available limited public health resources are critical for effective design of intervention strategies that will enhance under-five child survival. We aimed to estimate and map U5M risk, with the ultimate goal of identifying communities at high risk where interventions and further research can be targeted.
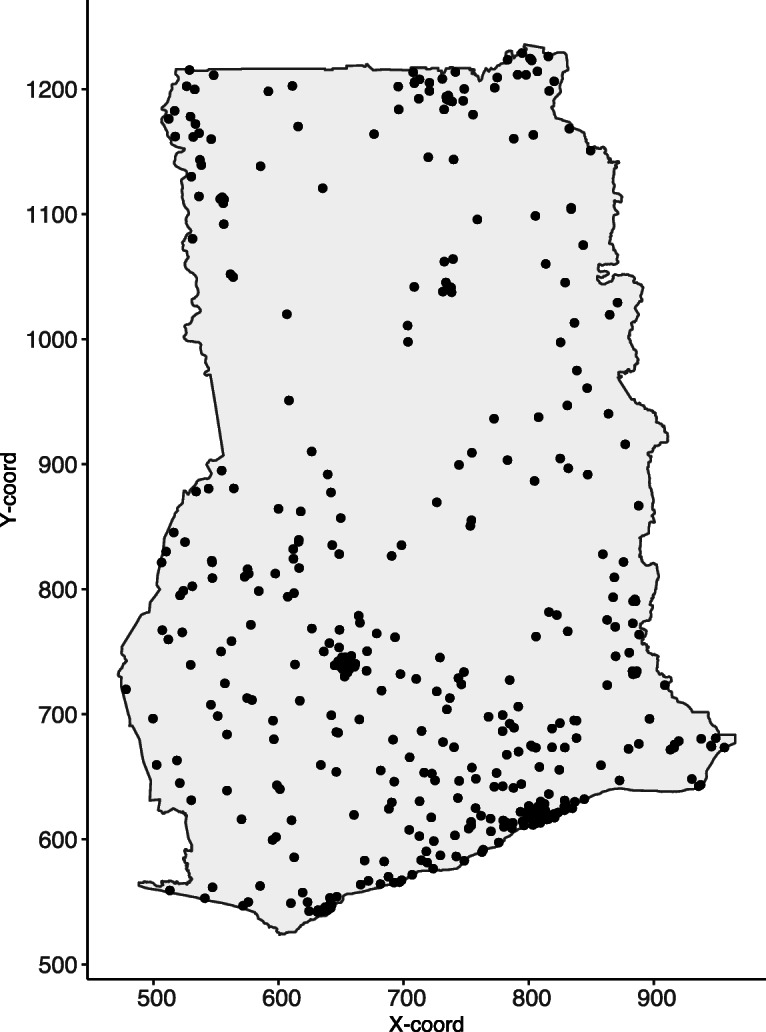
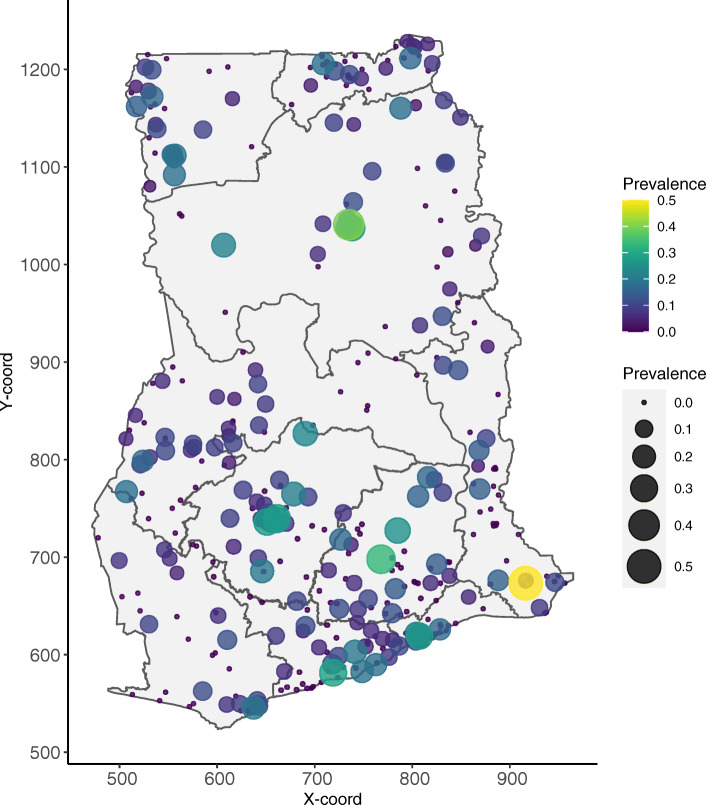
Methods: The 2014 Ghana Demographic and Health Survey data was used in this study. Geostatistical analyses were conducted on 5884 children residing in 423 geographical clusters. The outcome variable is child survival status (alive or dead). We employed a geostatistical generalised linear mixed model to investigate both measured and unmeasured child specific and spatial risk factors for child survival. We then visualise child mortality by mapping the predictive probability of survival.
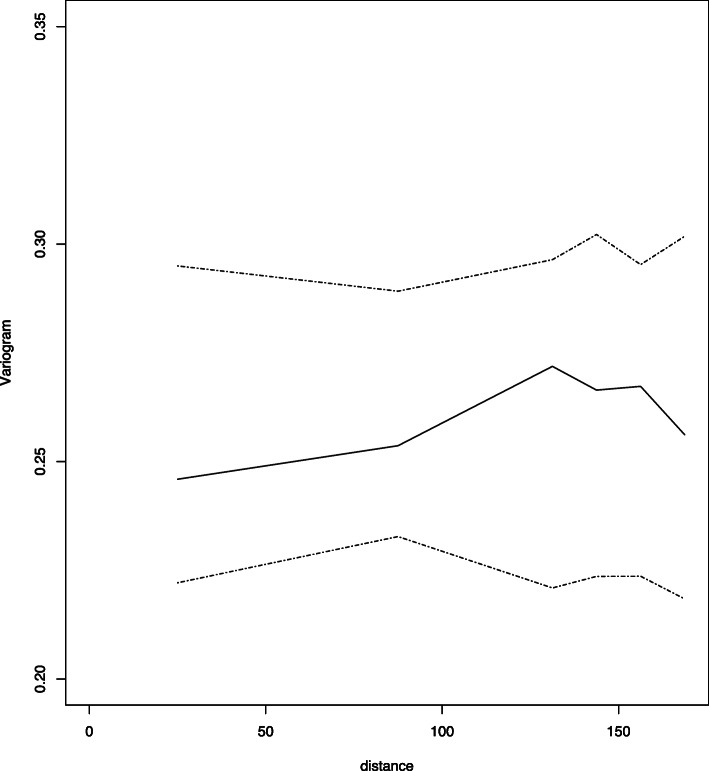
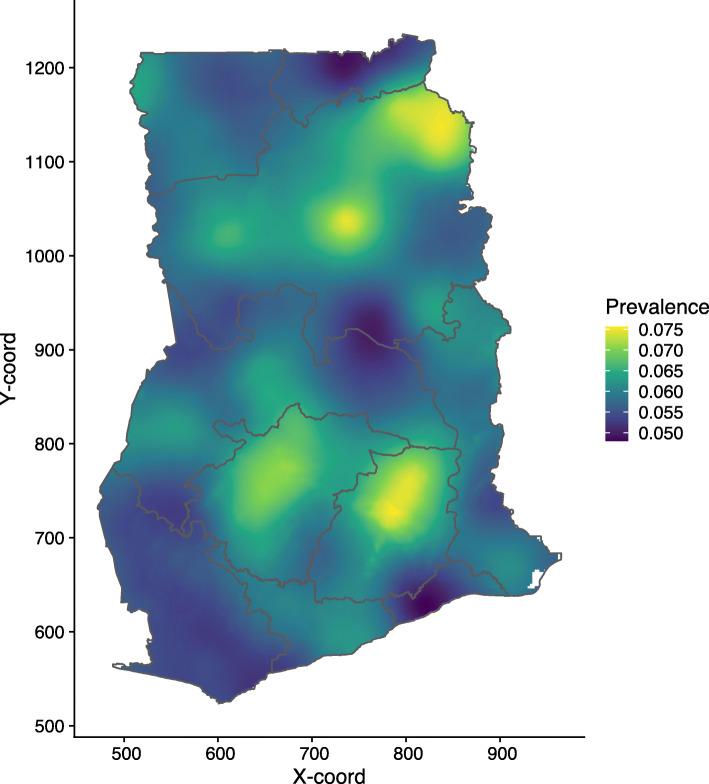
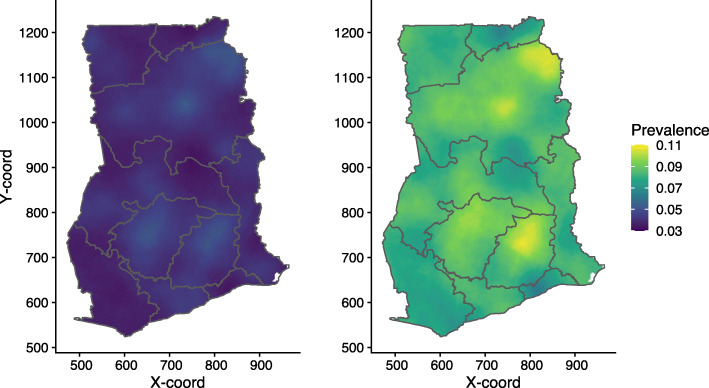
Results: Of the total sampled under 5 children, 289 (4.91%) experienced the outcome of interest. Children born as multiple births were at increased risk of mortality with an adjusted odds ratio (aOR) (aOR: 8.2532, 95% CI: [5.2608-12.9477]) compared to singletons. Maternal age increased risk of mortality (aOR: 1.0325, 95% CI: [1.0128-1.0527]). Child's age (aOR: 0.2277, 95% CI: [0.1870-0.2771]) and number of children under 5 within each household (aOR: 0.3166, 95% CI: [0.2614-0.3835]) were shown to have a protective effect. Additionally, mothers with secondary education level (aOR: 0.6258, 95% CI: [0.4298-0.9114]) decreased the risk of U5M. The predicted U5M risk in 2014 was at 5.98%. Substantial residual spatial variations were observed in U5M.
Conclusion: The analysis found that multiple births is highly associated with increased U5M in Ghana. The high-resolution maps show areas and communities where interventions and further research for U5M can be prioritised to have health impact.
Keywords: Child deaths; Developing countries; Geostatistical analysis; Ghana; Mapping under-five mortality; Risk factors; Sub-Saharan Africa; Under-five mortality.
Conflict of interest statement
The author declared no conflicts of interest with regard to this article.
Figures
Similar articles
-
Predictive model and determinants of under-five child mortality: evidence from the 2014 Ghana demographic and health survey.BMC Public Health. 2019 Jan 14;19(1):64. doi: 10.1186/s12889-019-6390-4. BMC Public Health. 2019. PMID: 30642313 Free PMC article.
-
Geographic variation and factors associated with under-five mortality in Ethiopia. A spatial and multilevel analysis of Ethiopian mini demographic and health survey 2019.PLoS One. 2022 Oct 13;17(10):e0275586. doi: 10.1371/journal.pone.0275586. eCollection 2022. PLoS One. 2022. PMID: 36227894 Free PMC article.
-
Quantifying within-city inequalities in child mortality across neighbourhoods in Accra, Ghana: a Bayesian spatial analysis.BMJ Open. 2022 Jan 13;12(1):e054030. doi: 10.1136/bmjopen-2021-054030. BMJ Open. 2022. PMID: 35027422 Free PMC article.
-
Mapping under-5 and neonatal mortality in Africa, 2000-15: a baseline analysis for the Sustainable Development Goals.Lancet. 2017 Nov 11;390(10108):2171-2182. doi: 10.1016/S0140-6736(17)31758-0. Epub 2017 Sep 25. Lancet. 2017. PMID: 28958464 Free PMC article. Review.
-
Inequality of child mortality among ethnic groups in sub-Saharan Africa.Bull World Health Organ. 2000;78(1):30-41. Bull World Health Organ. 2000. PMID: 10686731 Free PMC article. Review.
Cited by
-
Mapping under-five child malaria risk that accounts for environmental and climatic factors to aid malaria preventive and control efforts in Ghana: Bayesian geospatial and interactive web-based mapping methods.Malar J. 2022 Dec 15;21(1):384. doi: 10.1186/s12936-022-04409-x. Malar J. 2022. PMID: 36522667 Free PMC article.
-
Caregivers' perception and acceptance of malaria vaccine for Children.PLoS One. 2023 Jul 26;18(7):e0288686. doi: 10.1371/journal.pone.0288686. eCollection 2023. PLoS One. 2023. PMID: 37494408 Free PMC article.
-
Sustainable Surveillance of Neglected Tropical Diseases for the Post-Elimination Era.Clin Infect Dis. 2021 Jun 14;72(Suppl 3):S210-S216. doi: 10.1093/cid/ciab211. Clin Infect Dis. 2021. PMID: 33977302 Free PMC article.
-
Under-five mortality and social determinants in africa: a systematic review.Eur J Pediatr. 2025 Jan 24;184(2):150. doi: 10.1007/s00431-024-05966-w. Eur J Pediatr. 2025. PMID: 39849277 Free PMC article.
-
Community awareness, knowledge and perception about malaria vaccine in the Kassena-Nankana East Municipality: A descriptive cross-sectional survey.Nurs Open. 2024 Sep;11(9):e70025. doi: 10.1002/nop2.70025. Nurs Open. 2024. PMID: 39223744 Free PMC article.
References
-
- UNICEF . Levels & Trends in child mortality: estimates developed by the UN inter-agency Group for Child Mortality Estimation. In. New York: UN Inter-agency Group for Child Mortality Estimation; 2017.
MeSH terms
LinkOut - more resources
Full Text Sources
Research Materials
