

National physical activity and sedentary behaviour policies in 76 countries: availability, comprehensiveness, implementation, and effectiveness
- PMID: 32948193
- PMCID: PMC7501705
- DOI: 10.1186/s12966-020-01022-6
National physical activity and sedentary behaviour policies in 76 countries: availability, comprehensiveness, implementation, and effectiveness
Abstract
Background: Evidence on current, national physical activity (PA) and sedentary behaviour (SB) policies is limited. We, therefore, analysed availability, comprehensiveness, implementation, and effectiveness of PA and SB policies internationally.
Methods: In this cross-sectional study, Global Observatory for Physical Activity (GoPA!) Country Contacts from 173 countries were asked to provide data on their national PA and SB policies by completing GoPA! Policy Inventory. Data were collected for 76 countries (response rate = 44%).
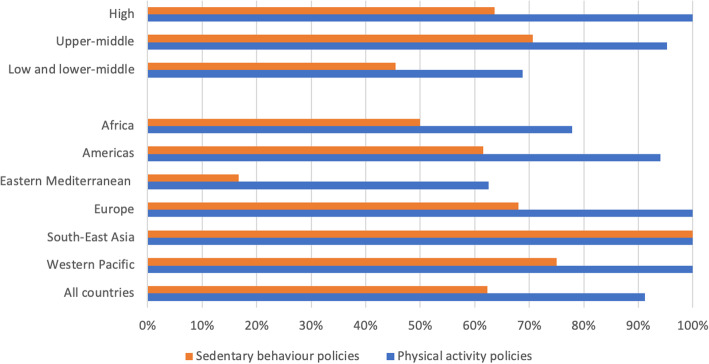
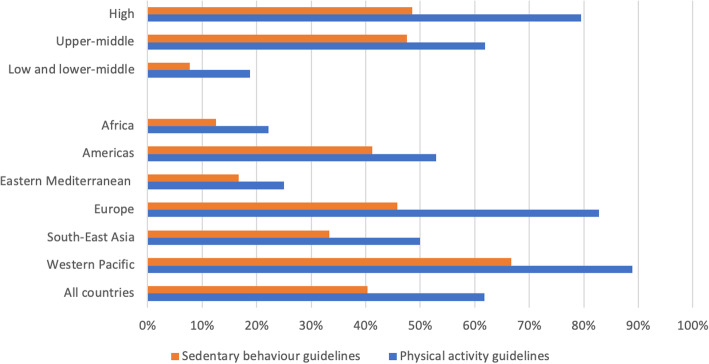
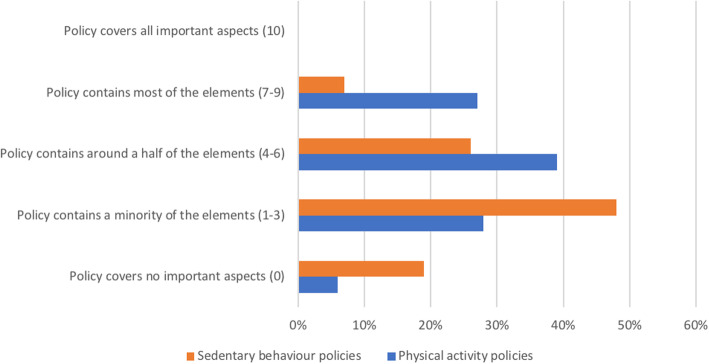
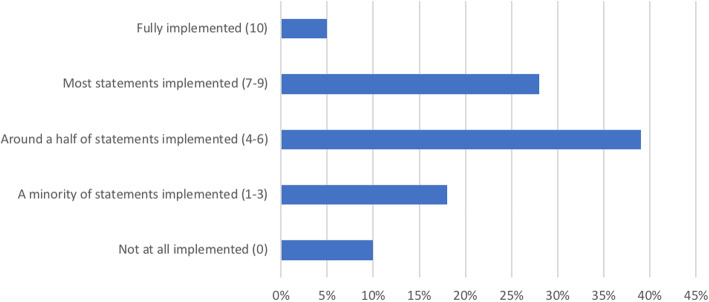
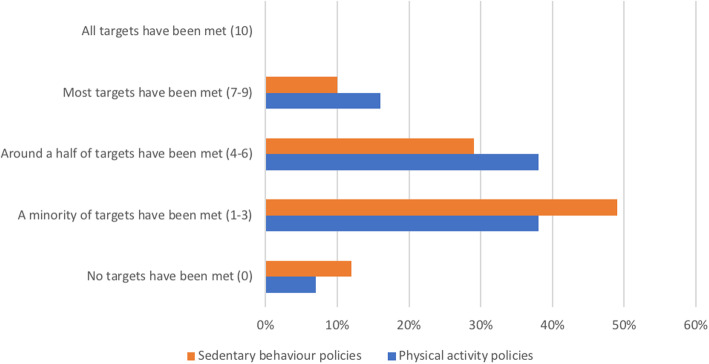
Results: Formal written policies for PA and SB were found in 92% (95% confidence interval [CI]: 86, 98) and 62% (95% CI: 50, 75) of countries, respectively. Sixty-two percent (95% CI: 51, 73) of countries have national PA guidelines, while 40% (95% CI: 29, 52) have SB guidelines. Fifty-two (95% CI: 40, 64) and 11% (95% CI: 3, 19) of countries have quantifiable national targets for PA and SB, respectively. The most represented ministries/departments involved in the promotion of more PA and/or less SB were in the sport (reported by 99% countries; 95% CI: 96, 100), health (97%; 95% CI: 94, 100), education (94%; 95% CI: 88, 100), and recreation and leisure (85%; 95% CI: 71, 99) sectors. The median score (0-10) for the comprehensiveness of PA and SB policies was 4 (95% CI: 4, 5) and 2 (95% CI: 2, 3), respectively. For PA and SB policy implementation it was 6 (95% CI: 5, 6). For the effectiveness of PA and SB policies it was 4 (95% CI: 3, 5) and 3 (95% CI: 2, 4), respectively. PA and SB policies were generally best developed in high-income countries and countries of European and Western-Pacific regions.
Conclusions: Most of the included countries have PA policies, but their comprehensiveness, implementation, and effectiveness are generally low-to-moderate. SB policies are less available, comprehensive, implemented, and effective than PA policies. PA and SB policies are better developed in high-income countries, compared with low- and lower-middle-income countries, and in countries of European and Western-Pacific regions, compared with other world regions. More investment is needed in development and implementation of comprehensive and effective PA and SB policies, particularly in low- and lower-middle-income countries.
Keywords: Assessment; Audit; Global; Physical activity; Policies; Sedentary behaviour.
Conflict of interest statement
The authors declare that they have no competing interests.
Figures
References
-
- World Health Organization . Ten years in public health 2007–2017, Report by Dr. Margaret Chan, director general. Geneva: WHO; 2017.
-
- Ding D, et al. The economic burden of physical inactivity: a global analysis of major non-communicable diseases. Lancet. 2016;388(10051):1311–1324. - PubMed
MeSH terms
LinkOut - more resources
Full Text Sources
Medical
