. 2020 Sep 18;11(1):405.
doi: 10.1186/s13287-020-01897-z.

Facilitating islet transplantation using a three-step approach with mesenchymal stem cells, encapsulation, and pulsed focused ultrasound

Affiliations

Facilitating islet transplantation using a three-step approach with mesenchymal stem cells, encapsulation, and pulsed focused ultrasound

Mehdi Razavi et al. Stem Cell Res Ther. .

Erratum in

Abstract

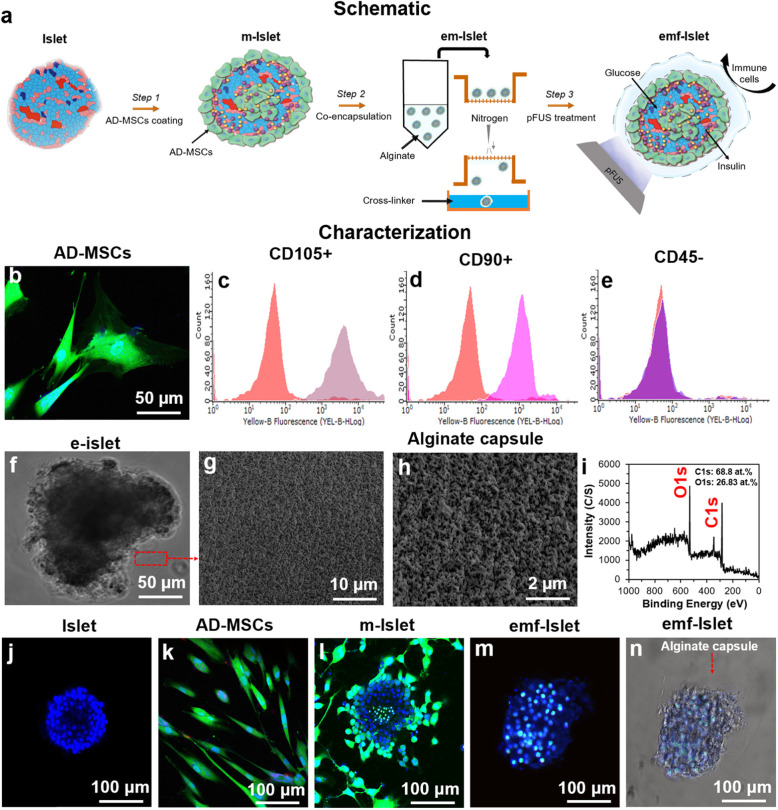
Background: The aim of this study was to examine the effect of a three-step approach that utilizes the application of adipose tissue-derived mesenchymal stem cells (AD-MSCs), encapsulation, and pulsed focused ultrasound (pFUS) to help the engraftment and function of transplanted islets.

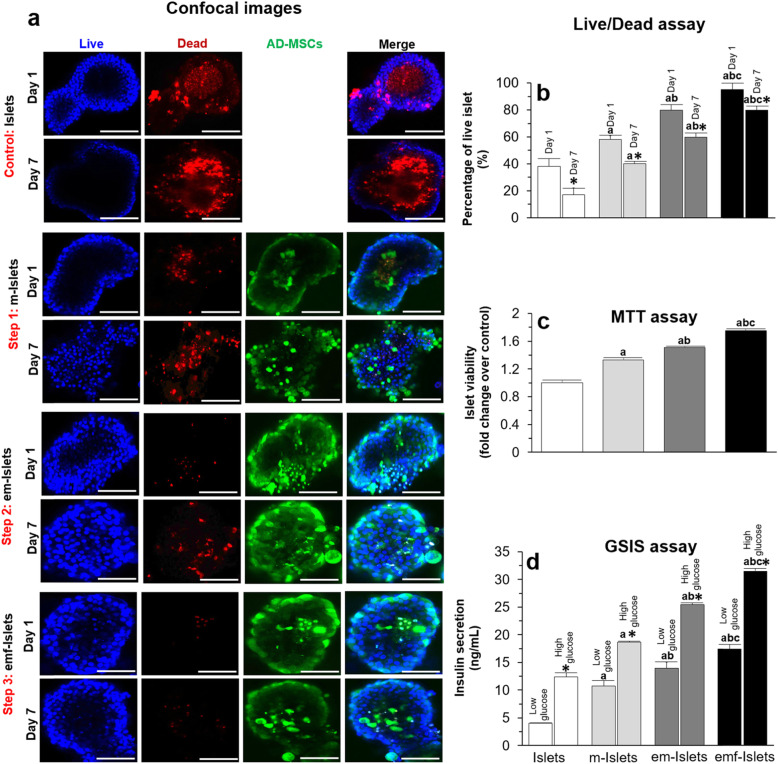
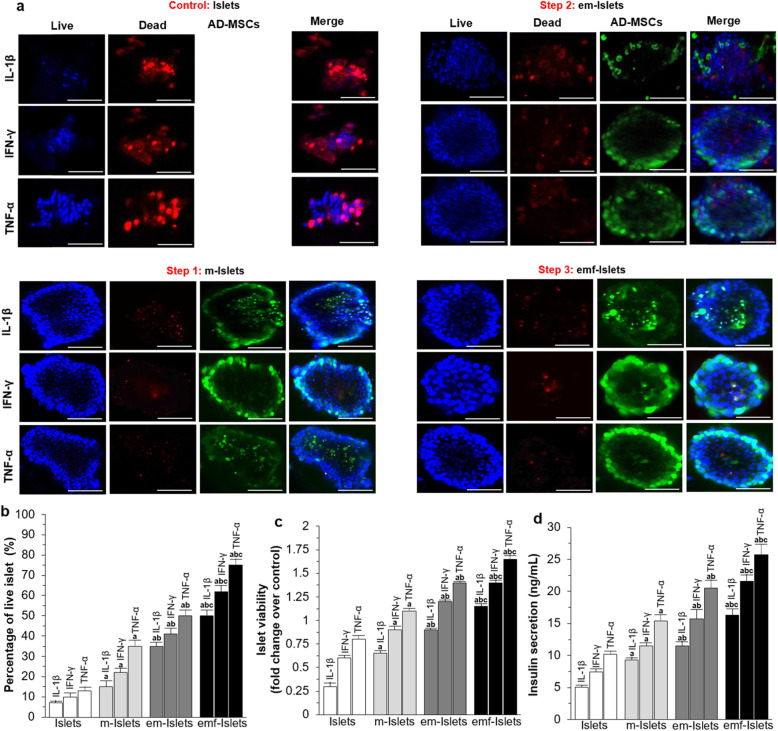
Methods: In step 1, islets were co-cultured with AD-MSCs to form a coating of AD-MSCs on islets: here, AD-MSCs had a cytoprotective effect on islets; in step 2, islets coated with AD-MSCs were conformally encapsulated in a thin layer of alginate using a co-axial air-flow method: here, the capsule enabled AD-MSCs to be in close proximity to islets; in step 3, encapsulated islets coated with AD-MSCs were treated with pFUS: here, pFUS enhanced the secretion of insulin from islets as well as stimulated the cytoprotective effect of AD-MSCs.

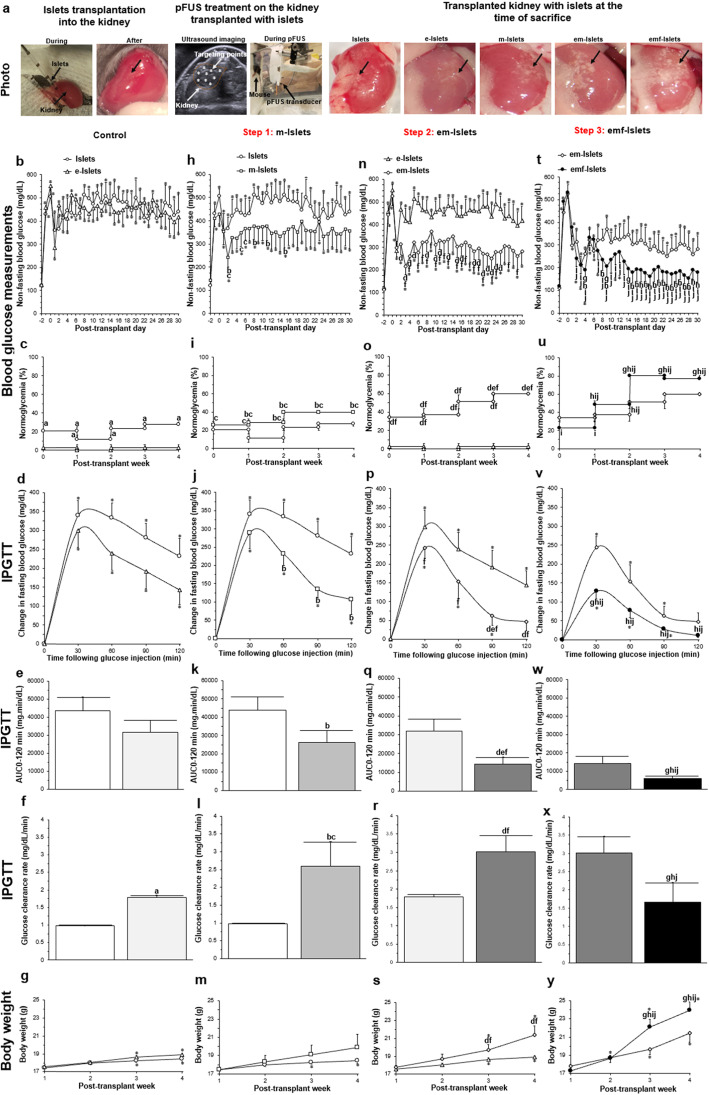
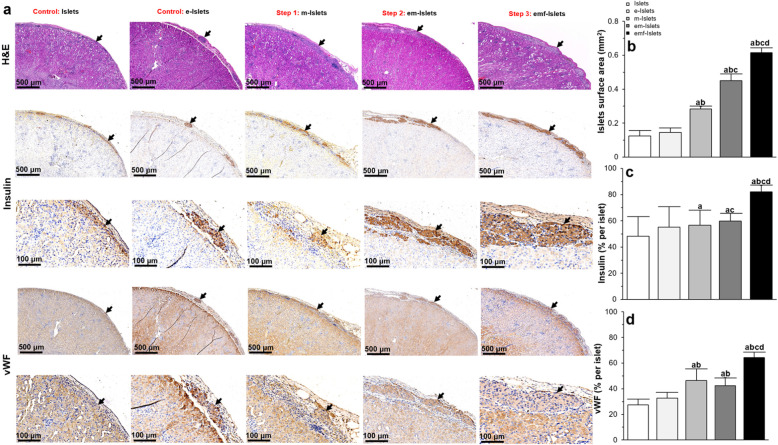
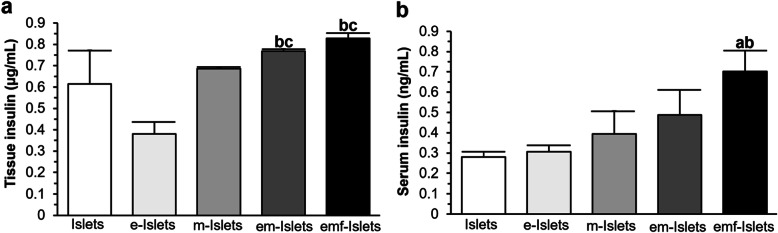
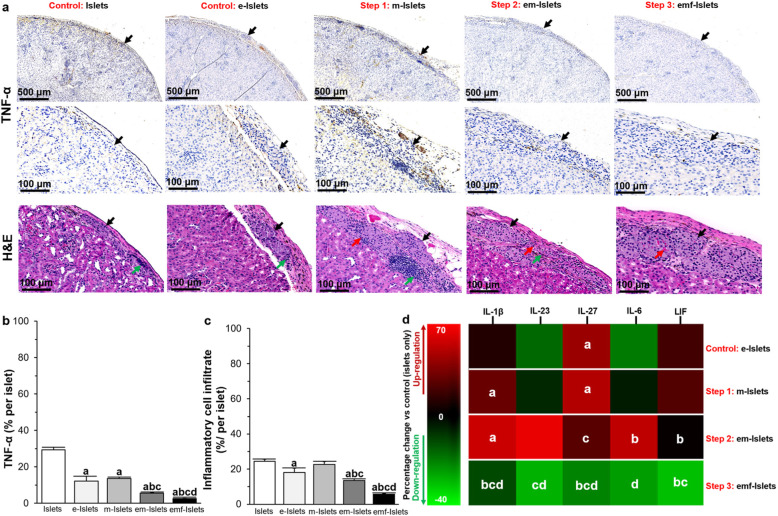
Results: Our approach was shown to prevent islet death and preserve islet functionality in vitro. When 175 syngeneic encapsulated islets coated with AD-MSCs were transplanted beneath the kidney capsule of diabetic mice, and then followed every 3 days with pFUS treatment until day 12 post-transplantation, we saw a significant improvement in islet function with diabetic animals re-establishing glycemic control over the course of our study (i.e., 30 days). In addition, our approach was able to enhance islet engraftment by facilitating their revascularization and reducing inflammation.

Conclusions: This study demonstrates that our clinically translatable three-step approach is able to improve the function and viability of transplanted islets.

Keywords: Diabetes; Encapsulation; Islets transplantation; Mesenchymal stem cells; Pulsed focused ultrasound.


Conflict of interest statement

The authors declare that they have no competing interests.

Figures

Fig. 1
Fig. 1
Experimental overview and characterization of islets encapsulated with AD-MSCs: a Schematic representation of our three-step approach: step 1: AD-MSC coating, step 2: encapsulation, and step 3: pFUS treatment; characterization of be AD-MSCs (b confocal image and ce FACS analysis), fi alginate capsule (photographic, SEM images, and XPS scans), and jn confocal images of an j islet, k AD-MSCs, l islet coated with AD-MSCs, and mn encapsulated with alginate followed by pFUS treatment. Blue: live cells stained with Hoechst. Green: AD-MSCs stained with FDA
Fig. 2
Fig. 2
In vitro analysis of islet survival and function in normal conditions: a Representative confocal images, and results of b live/dead, c MTT, and d GSIS assays of tested groups (i.e., Islets, e-Islets, m-Islets, em-Islets, and emf-Islets). Confocal images and live/dead assay have been performed at days 1 and 7, and MTT and GSIS assays at day 7, in culture. Blue: live cells stained with Hoechst. Red: dead cells stained with PI. Green: AD-MSCs stained with FDA. Scale bar = 50 μm. Significant differences: bd aP < 0.05: Islets vs. m-Islets or em-Islets or emf-Islets; bP < 0.05: m-Islets vs. em-Islets or emf-Islets; dP < 0.05: em-Islets vs. emf-Islets (one-way ANOVA post hoc Tukey test). b *P < 0.05: day 1 vs. day 7; d *P < 0.05: high glucose vs. low glucose (two (b, d) or one (c)-way ANOVA post hoc Tukey test)
Fig. 3
Fig. 3
In vitro analysis of islet survival and function following exposure to pro-inflammatory cytokines: a representative confocal images and results of b live/dead, c MTT, and d high-glucose-stimulated insulin secretion assays of tested groups (i.e., Islets, e-Islets, m-Islets, em-Islets, and emf-Islets). Blue: live cells stained with Hoechst. Red: dead cells stained with PI. Green: AD-MSCs stained with FDA. Scale bar = 50 μm. Significant differences: bd aP < 0.05: Islets vs. m-Islets or em-Islets or emf-Islets; bP < 0.05: m-Islets vs. em-Islets or emf-Islets; dP < 0.05: em-Islets vs. emf-Islets (one-way ANOVA post hoc Tukey test)
Fig. 4
Fig. 4
In vivo analysis of islet survival and function (metabolic analysis): a islet transplantation using a kidney subcapsular approach; pFUS treatment on the kidney transplanted with islets; transplanted kidney with different experimental groups (i.e., Islets, e-Islets, m-Islets, em-Islets, and emf-Islets) at the time of euthanasia (black arrows indicate transplanted islets); results of be BG measurements, fi normoglycemia percentage, jm IPGTT, nq area under the IPGTT curve (AUC0-120min), ru BG clearance rates calculated from slope of IPGTT curves from 30 to 90 min and vy body weight of mice post-transplant measured at various time points over 30 days. Results shows the effect of b, f, j, n, r, v islet encapsulation by comparing Islets with e-Islets, c, g, k, o, s, w AD-MSC coating on islets by comparing Islets with m-Islets, d, h, l, p, t, x encapsulating islets with AD-MSCs by comparing e-Islets with em-Islets, e, i, m, q, u, y and pFUS treatment by comparing em-Islets with emf-Islets groups. Significant differences: by aP < 0.05: e-Islets vs. Islets; bP < 0.05: m-Islets vs. Islets; cP < 0.05: m-Islets vs. e-Islets; dP < 0.05: em-Islets vs. e-Islets; eP < 0.05: em-Islets vs. m-Islets; fP < 0.05: em-Islets vs. Islets; gP < 0.05: emf-Islets vs. em-Islets; hP < 0.05: emf-Islets vs. m-Islets; iP < 0.05: emf-Islets vs. e-Islets; jP < 0.05: emf-Islets vs. Islets; *P < 0.05: baseline vs. all other time-points (two (b, h, n, t, d, j, p, v, g, m, s, y) or one (k, q, w, l, r, x)-way ANOVA post hoc Tukey test or unpaired Student’s t test (e, f))
Fig. 5
Fig. 5
In vivo analysis of islet survival and function (histological analysis): a representative images following H&E, insulin, and vWF immunohistochemical staining of islets in tested groups (i.e., Islets, e-Islets, m-Islets, em-Islets, and emf-Islets) that were transplanted under the kidney capsule. Black arrows indicate islets present within the representative images and red arrows indicate blood vessels within the islets; b quantification of surface area occupied by islets; ce quantification of positive c insulin and d vWF staining. Results were analyzed with at least 15–20 islets from 5 different sections through the kidney of each animal. Significant differences: aP < 0.05: Islets vs. e-Islets or m-Islets or em-Islets or emf-Islets; bP < 0.05: e-Islets vs. m-Islets or em-Islets or emf-Islets; cP < 0.05: m-Islets vs. em-Islets or emf-Islets; dP < 0.05: em-Islets vs. emf-Islets (one-way ANOVA post hoc Tukey test)
Fig. 6
Fig. 6
In vivo analysis of islet survival and function (molecular analysis): the level of insulin within a the kidney and b blood serum of mice transplanted with islets (measured with insulin ELISA). The c cytokine expression profile in the kidney of mice transplanted with islets (measured with multiplex ELISA) in following tested groups: Islets, e-Islets, m-Islets, em-Islets, and emf-Islets. Significant differences: aP < 0.05: Islets vs. e-Islets or m-Islets or em-Islets or emf-Islets; bP < 0.05: e-Islets vs. m-Islets or em-Islets or emf-Islets; cP < 0.05: m-Islets vs. em-Islets or emf-Islets; dP < 0.05: em-Islets vs. emf-Islets (one-way ANOVA post hoc Tukey test)
Fig. 7
Fig. 7
a Representative images following TNF-α immunohistochemical staining and H&E staining of islets that were transplanted under the kidney capsule. Black arrows indicate islets present within the representative images; quantification of b positive TNF-α staining, c inflammatory cell infiltrate; and d the cytokine expression profile in the kidney of mice transplanted with islets (measured with multiplex ELISA) in following tested groups: Islets, e-Islets, m-Islets, em-Islets, and emf-Islets. Significant differences: bd aP < 0.05: Islets vs. e-Islets or m-Islets or em-Islets or emf-Islets; bP < 0.05: e-Islets vs. m-Islets or em-Islets or emf-Islets; cP < 0.05: m-Islets vs. em-Islets or emf-Islets; dP < 0.05: em-Islets vs. emf-Islets (one-way ANOVA post hoc Tukey test)

Similar articles

Cited by

References

    1. S ELA, Mager I, Breakefield XO, Wood MJ. Extracellular vesicles: biology and emerging therapeutic opportunities. Nat Rev Drug Discov 2013;12(5):347–357. - PubMed
    1. Aguayo-Mazzucato C, Bonner-Weir S. Stem cell therapy for type 1 diabetes mellitus. Nat Rev Endocrinol. 2010;6(3):139. - PubMed
    1. Ryan EA, Lakey JR, Rajotte RV, Korbutt GS, Kin T, Imes S, et al. Clinical outcomes and insulin secretion after islet transplantation with the Edmonton protocol. Diabetes. 2001;50(4):710–719. - PubMed
    1. Gillies M, Mandel T. The evolution of function and response to arginine challenge and pregnancy of portally and systemically placed islet cell grafts in streptozotocin diabetic mice. Metabolism. 1990;39(12):1253–1258. - PubMed
    1. Van Der Windt DJ, Bottino R, Casu A, Campanile N, Cooper DK. Rapid loss of intraportally transplanted islets: an overview of pathophysiology and preventive strategies. Xenotransplantation. 2007;14(4):288–297. - PubMed

Publication types