. 2020 Sep 18;6(38):eaba0398.
doi: 10.1126/sciadv.aba0398. Print 2020 Sep.

Unraveling why we sleep: Quantitative analysis reveals abrupt transition from neural reorganization to repair in early development

Affiliations

Unraveling why we sleep: Quantitative analysis reveals abrupt transition from neural reorganization to repair in early development

Junyu Cao et al. Sci Adv. .

Abstract

Sleep serves disparate functions, most notably neural repair, metabolite clearance and circuit reorganization. Yet the relative importance remains hotly debated. Here, we create a novel mechanistic framework for understanding and predicting how sleep changes during ontogeny and across phylogeny. We use this theory to quantitatively distinguish between sleep used for neural reorganization versus repair. Our findings reveal an abrupt transition, between 2 and 3 years of age in humans. Specifically, our results show that differences in sleep across phylogeny and during late ontogeny (after 2 or 3 years in humans) are primarily due to sleep functioning for repair or clearance, while changes in sleep during early ontogeny (before 2 or 3 years) primarily support neural reorganization and learning. Moreover, our analysis shows that neuroplastic reorganization occurs primarily in REM sleep but not in NREM. This developmental transition suggests a complex interplay between developmental and evolutionary constraints on sleep.


Figures

Fig. 1
Fig. 1. Scaling of brain metabolism and connections with brain mass (kilogram) and age before transition.
(A) Plot of the logarithm of cerebral metabolic rate versus the logarithm of brain mass before transition with measured slope of 1.60. (B) Plot of the logarithm of number of synapses versus the logarithm of brain mass before transition with measured slope of 1.23. (C) Plot of the logarithm of white matter volume versus the logarithm of brain mass before transition with measured slope of 1.21. Also, shown on the top horizontal axes is the corresponding age in years.
Fig. 2
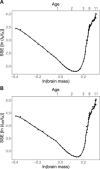
Fig. 2. Identification of transition from reorganization to repair.
Plots of the sum of squared errors for the residuals of the two best-fit lines to data for (A) ln (tS/tA) and (B) ln (tNR/tA) on either side of a break point in the lines that corresponds to that value of the logarithm of brain mass (Mb). The minimum of each curve is identified as the transition point that divides sleep function into early and late developmental stages as described by our theory. These minima are unique and have values of Mb = 1.14 kg for the transition in tS/tA and Mb = 1.15 kg for the transition in tNR/tA, corresponding to ages of 2.4 to 2.5 years old, respectively. Also, shown on the top horizontal axes is the corresponding age in years. SSEs, sum of squared errors.
Fig. 3
Fig. 3. Scaling and transition points for sleep time ratios.
(A) Plot of the logarithm of the ratio of total sleep time to total awake time per day versus the logarithm of brain mass with measured slope of −0.33 before transition and −3.50 after. (B) Plot of the logarithm of the ratio of REM sleep time to total sleep time per day versus the logarithm of brain mass with measured slope of −0.60 before transition and −0.01 after. (C) Plot of the logarithm of the ratio of REM sleep time to total awake time per day versus the logarithm of brain mass with measured slope of −1.00 before transition and −5.10 after. (D) Plot of the logarithm of the ratio of NREM sleep time to total awake time per day versus the logarithm of brain mass with measured slope of 0.09 before transition and −3.16 after. Also, shown on the top horizontal axes is the corresponding age in years.

References

    1. Siegel J. M., Clues to the functions of mammalian sleep. Nature 437, 1264–1271 (2005). - PMC - PubMed
    1. Xie L., Kang H., Xu Q., Chen M. J., Liao Y., Thiyagarajan M., O’Donnell J., Christensen D. J., Nicholson C., Iliff J. J., Takano T., Deane R., Nedergaard M., Sleep drives metabolite clearance from the adult brain. Science 342, 373–377 (2013). - PMC - PubMed
    1. Bateman R. J., Munsell L. Y., Morris J. C., Swarm R., Yarasheski K. E., Holtzman D. M., Human amyloid-β synthesis and clearance rates as measured in cerebrospinal fluid in vivo. Nat. Med. 12, 856–861 (2006). - PMC - PubMed
    1. Herculano-Houzel S., Decreasing sleep requirement with increasing numbers of neurons as a driver for bigger brains and bodies in mammalian evolution. Proc. Biol. Sci. 282, 20151853 (2015). - PMC - PubMed
    1. Zada D., Bronshtein I., Lerer-Goldshtein T., Garini Y., Appelbaum L., Sleep increases chromosome dynamics to enable reduction of accumulating DNA damage in single neurons. Nat. Commun. 10, 895 (2019). - PMC - PubMed

Publication types