. 2020 Nov;30(11):1618-1632.
doi: 10.1101/gr.264473.120. Epub 2020 Sep 18.

Whole-genome analysis of noncoding genetic variations identifies multiscale regulatory element perturbations associated with Hirschsprung disease

Affiliations

Whole-genome analysis of noncoding genetic variations identifies multiscale regulatory element perturbations associated with Hirschsprung disease

Alexander Xi Fu et al. Genome Res. 2020 Nov.

Abstract

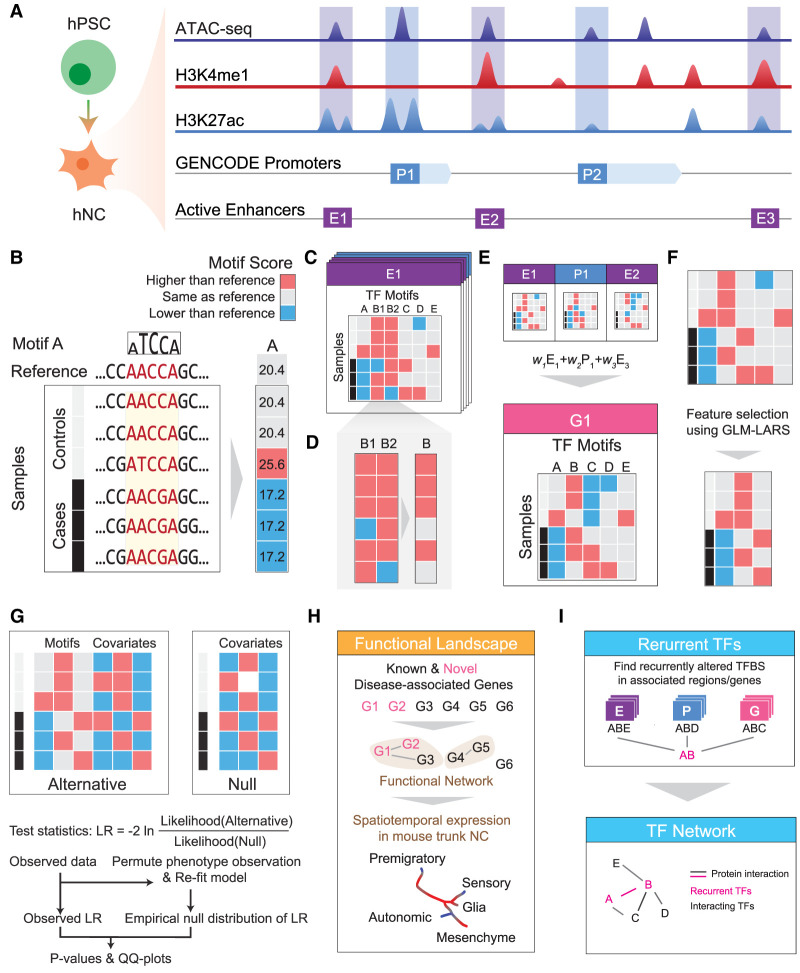
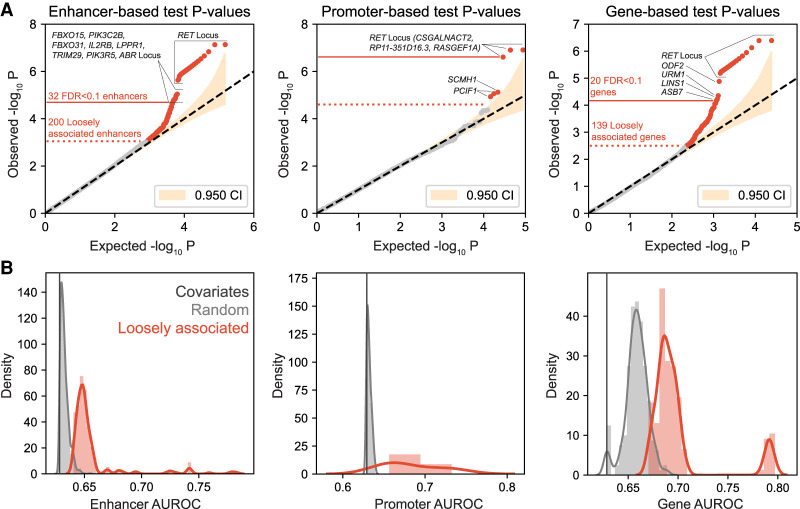
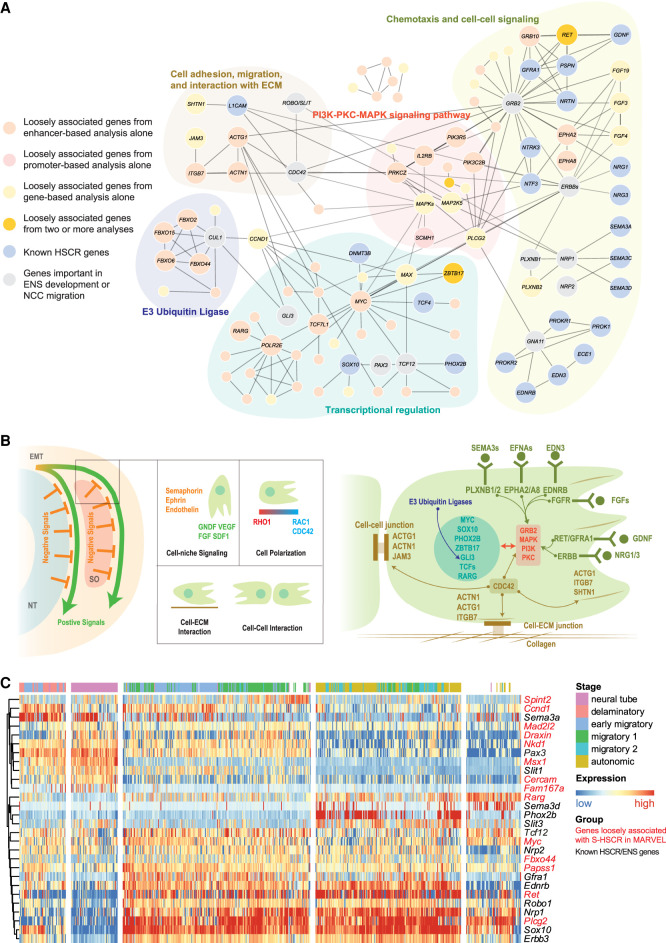
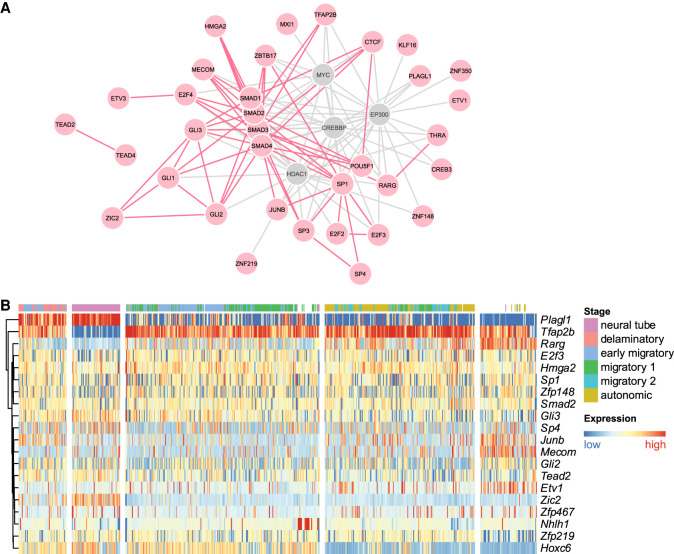
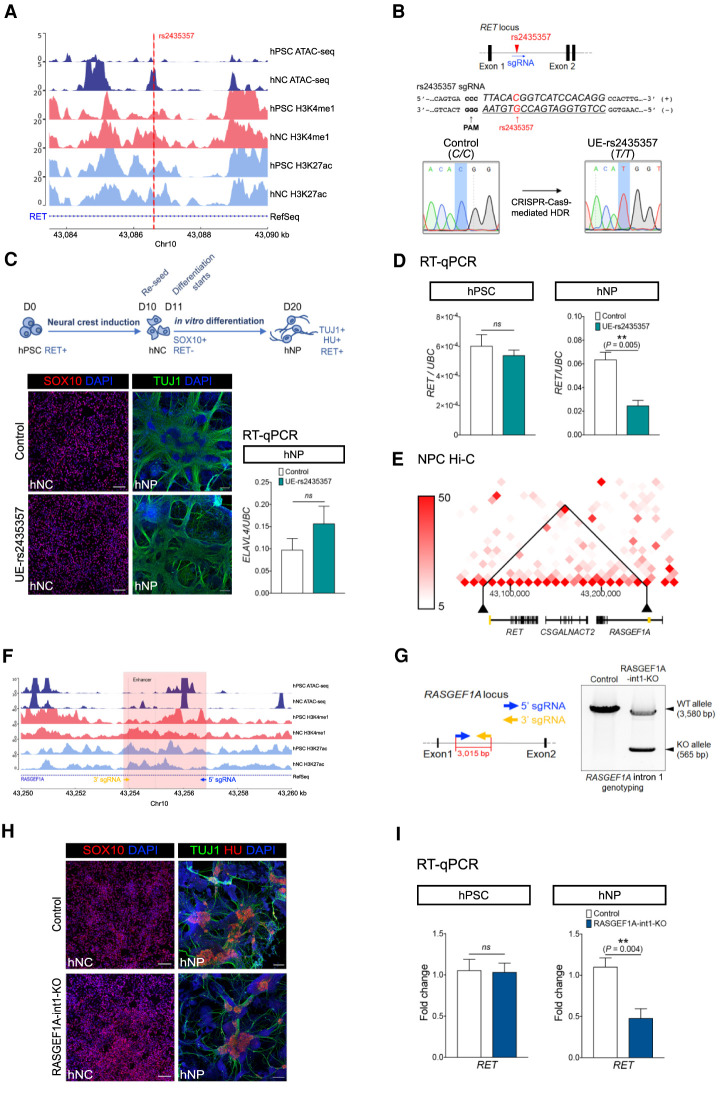
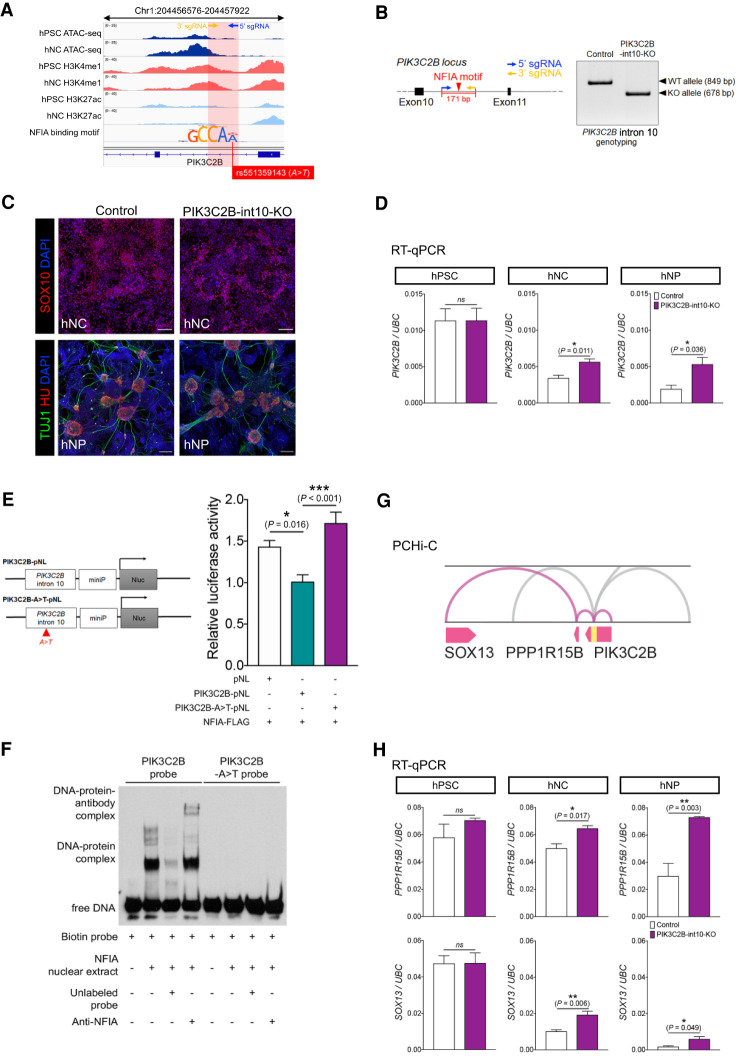
It is widely recognized that noncoding genetic variants play important roles in many human diseases, but there are multiple challenges that hinder the identification of functional disease-associated noncoding variants. The number of noncoding variants can be many times that of coding variants; many of them are not functional but in linkage disequilibrium with the functional ones; different variants can have epistatic effects; different variants can affect the same genes or pathways in different individuals; and some variants are related to each other not by affecting the same gene but by affecting the binding of the same upstream regulator. To overcome these difficulties, we propose a novel analysis framework that considers convergent impacts of different genetic variants on protein binding, which provides multiscale information about disease-associated perturbations of regulatory elements, genes, and pathways. Applying it to our whole-genome sequencing data of 918 short-segment Hirschsprung disease patients and matched controls, we identify various novel genes not detected by standard single-variant and region-based tests, functionally centering on neural crest migration and development. Our framework also identifies upstream regulators whose binding is influenced by the noncoding variants. Using human neural crest cells, we confirm cell stage-specific regulatory roles of three top novel regulatory elements on our list, respectively in the RET, RASGEF1A, and PIK3C2B loci. In the PIK3C2B regulatory element, we further show that a noncoding variant found only in the patients affects the binding of the gliogenesis regulator NFIA, with a corresponding up-regulation of multiple genes in the same topologically associating domain.


Figures

Figure 1.
Figure 1.
Schematic overview of MARVEL. (A) Epigenomic data of relevant cell types (hNC in the case of HSCR) are integrated with a gene annotation set to identify the active regulatory elements relevant to the phenotype of interest. (B) In each regulatory element, the functional significance of genetic variants is evaluated by their perturbation to TF sequence motifs. (C) Since the perturbation effects of multiple genetic variants may not add up linearly, they are considered together to reconstruct the sample-specific sequences, based on which the overall change of TF motif match scores is determined. (D) For motifs with multiple appearances within the same regulatory element, their match scores are aggregated to give a single score. (E) At a higher level, if a gene involves multiple regulatory elements, the aggregated match scores of a motif in the different elements can be further aggregated into a single score. This is done in the gene-based analysis. (F,G) The aggregated match score matrix of all the motifs for a regulatory element/gene is used as the input of an association test, which selects a subset of the most informative motif features (F) and compares a model involving both these selected features and the covariates with a null model that involves only the covariates using likelihood ratio (LR) test (G). (H) The regulatory elements and genes identified to be significantly associated with the phenotype can be further studied by other downstream analyses, such as gene set enrichment and single-cell expression analyses. (I) TFs with recurrently perturbed match scores in different regulatory elements are collected to infer a network that highlights the phenotype-associated perturbations.
Figure 2.
Figure 2.
Association test results. (A) Q-Q plots of association P-values in the enhancer-based, promoter-based, and gene-based tests. In each plot, the yellow shaded area shows the 95% confidence interval. The dotted red line marks the demarcation point of the loosely associated regions, above which all the regions are outside the 95% confidence interval. The solid red line marks the threshold for significantly associated regions, above which all regions have an FDR Q-value < 0.1. The significantly associated regions are a subset of the loosely associated regions. (B) Comparison of the AUROC value distributions of the models of the loosely associated regions with those of the models of the background regions and the covariate-only model.
Figure 3.
Figure 3.
Functional landscape of S-HSCR-associated genes. (A) Functional interactions among genes loosely associated with S-HSCR, known HSCR genes, and genes important in ENS functions or NC migration. Each node corresponds to a gene and each edge corresponds to a functional interaction cataloged in Reactome. Genes of particular interest are shown in bigger nodes, labeled with their names. (B) Schematic illustration of some biological processes and genes involved in NC migration (Szabó and Mayor 2018). Colors of gene names follow their functional categories in panel A. (NT) Neural tube, (SO) somites. (C) Spatiotemporal expression profiles of mouse trunk NCs. Each row corresponds to the stage-specific expression pattern of a mouse homolog of a human gene shown in panel A. Genes identified by MARVEL as loosely associated with S-HSCR are shown in red. Each column corresponds to a single cell with the predicted stage label taken from the original publication (Soldatov et al. 2019). Both the rows and the columns were clustered using hierarchical clustering with Pearson's correlation as the similarity measure, and the columns are divided into five partitions according to the clustering results.
Figure 4.
Figure 4.
Analysis of the recurrent TFs. (A) PPIs among the recurrent TFs (red) and several other proteins frequently interacting with them (gray). Direct interactions among the recurrent TFs are shown in red, while direct interactions involving the other proteins are shown in gray. Recurrent TFs that have no interactions with other proteins in this figure are excluded. (B) Spatiotemporal expression of recurrent TFs with stage-specific expression profiles in mouse trunk NCs. The heat map was produced in the same way as in Figure 3C, with the same order of columns.
Figure 5.
Figure 5.
Functional impacts of a HSCR-associated SNP (rs2435357) and the deletion of a novel S-HSCR enhancer on RET expression. (A) ATAC-seq and ChIP-seq profiles of hPSC and hNC in intron 1 of RET show that rs2435357 is residing in a hNC-specific ATAC-seq peak. (B) Location of rs2435357 in the RET gene locus and in the sgRNA used for CRISPR-Cas9-mediated HDR for editing the C allele to the HSCR-associated risk allele T. The electrographs of Sanger sequencing show the successful introduction of the risk allele at rs2435357 in the UE-rs2435357 hPSC line. (C) Differentiation strategy to generate human neural crest (hNC) and neuronal progenitor (hNP). HU is encoded by the ELAVL4 gene. Immunostaining of SOX10 and TUJ1 in hNC and hNP of the control and the mutant (UE-rs2435357) lines. Scale bars: (hNC) 100 μm; (hNP) 200 μm. RT-qPCR analysis showing the comparable ELAVL4 expression level in hNP in the control (n = 5) and the mutant (UE-rs2435357) (n = 3) lines. t-test, (ns) not significant. (D) RT-qPCR analysis showing RET expression in the hPSC and hNP stages of the control (n = 5) and the mutant (UE-rs2435357) (n = 3). t-test, (ns) not significant. (E) Hi-C data from neural progenitor cells show that the enhancer in intron 1 of RASGEF1A (marked in yellow on the right) has physical interaction with the promoter of RET (marked in yellow on the left) at 10-kbp bin size. (F) ATAC-seq and ChIP-seq data from hPSC and hNC at the RASGEF1A intron 1 locus. (G) The design of sgRNAs used for the CRISPR-Cas9 system for deleting the DNA fragment in RASGEF1A intron 1. Genotyping reveals the specific deletion of RASGEF1A intron 1 in the UE-RASGEF1A-int1-KO hPSC line. (WT) Wild type, (KO) knockout. (H) Immunostaining of SOX10, TUJ1, and HU in hNC and hNP of the control and the mutant (RASGEF1A-int1-KO) lines, respectively. Scale bars: (hNC) 100 μm; (hNP) 200 μm. (I) RT-qPCR reveals the expression level of RET in the hPSC and hNP stages of the control (n = 4–5) and the mutant (RASGEF1A-int1-KO) (n = 6–7). t-test, (ns) not significant.
Figure 6.
Figure 6.
Characterization of a novel S-HSCR-associated regulatory element in intron 10 of PIK3C2B. (A) Overview of ATAC-seq and ChIP-seq profiles showing the putative hNC-specific regulatory element in PIK3C2B intron 10. The red shaded region indicates the location of the regulatory element and the line shows the A > T variant (rs551359143) found exclusively in the S-HSCR cases that disrupts the NFIA binding motif. The motif is not drawn to the same scale as the genomic signal tracks, with magnified characters. (B) Design of sgRNAs used for the CRISPR-Cas9 system for deleting the regulatory element. Genotyping reveals the specific deletion of the 171-bp fragment in intron 10 of PIK3C2B in the PIK3C2B-int10-KO hPSC line. (WT) Wild type, (KO) knockout. (C) Immunostaining shows that both the control and mutant (PIK3C2B-int1-KO) lines have comparable capability to make hNCs and hNPs. Scale bars: (hNC) 100 μm; (hNP) 200 μm. (D) RT-qPCR shows the changes in the expression of PIK3CB in different cell stages in the control and mutant lines. t-test, (ns) not significant. n = 3–4 per group. (E) Design of the constructs used for the luciferase assay. The bar chart shows the relative luciferase activities when the cells were transfected with different sets of constructs as indicated. Three independent assays were performed, each in triplicate. One-way ANOVA. (F) Gel mobility shift assays were performed with biotin-labeled probes containing the PIK3C2B intron 10 regulatory element with or without the A > T conversion and the nuclear extract from NFIA-overexpressing cells, in the presence of unlabeled probes or anti-NFIA antibody (0.1 µg). (G) Significant contacts (FDR < 0.05) in the promoter capture Hi-C data from GM12878 cells at the PIK3C2B locus. The putative regulatory element in intron 10 of PIK3C2B is marked in yellow. Contacts between the regulatory element and the TSSs of SOX13, PPP1R15B, and PIK3C2B are shown in purple curves, while contacts between the regulatory element and other promoters are shown in gray curves. Contacts that extend too far are trimmed. (H) RT-qPCR analysis shows the changes in the expression of PPP1R15B and SOX13 in the control and the mutant lines at different cell stages. t-test, (ns) not significant. n = 3–4 per group.

Similar articles

Cited by

References

    1. Alves MM, Sribudiani Y, Brouwer RWW, Amiel J, Antiñolo G, Borrego S, Ceccherini I, Chakravarti A, Fernández RM, Garcia-Barcelo MM, et al. 2013. Contribution of rare and common variants determine complex diseases—Hirschsprung disease as a model. Dev Biol 382: 320–329. 10.1016/j.ydbio.2013.05.019 - DOI - PubMed
    1. Amiel J, Attié T, Jan D, Pelet A, Edery P, Bidaud C, Lacombe D, Tam P, Simeoni J, Flori E, et al. 1996. Heterozygous endothelin receptor B (EDNRB) mutations in isolated Hirschsprung disease. Hum Mol Genet 5: 355–357. 10.1093/hmg/5.3.355 - DOI - PubMed
    1. Amiel J, Sproat-Emison E, Garcia-Barcelo M, Lantieri F, Burzynski G, Borrego S, Pelet A, Arnold S, Miao X, Griseri P, et al. 2008. Hirschsprung disease, associated syndromes and genetics: a review. J Med Genet 45: 1–14. 10.1136/jmg.2007.053959 - DOI - PubMed
    1. Badner JA, Sieber WK, Garver KL, Chakravarti A. 1990. A genetic study of Hirschsprung disease. Am J Hum Genet 46: 568–580. - PMC - PubMed
    1. Baroti T, Schillinger A, Wegner M, Stolt CC. 2016. Sox13 functionally complements the related Sox5 and Sox6 as important developmental modulators in mouse spinal cord oligodendrocytes. J Neurochem 136: 316–328. 10.1111/jnc.13414 - DOI - PubMed

Publication types

MeSH terms

Substances