. 2020 Sep 18;5(51):eabb8786.
doi: 10.1126/sciimmunol.abb8786.

Transcriptomic and clonal characterization of T cells in the human central nervous system

Affiliations

Transcriptomic and clonal characterization of T cells in the human central nervous system

Jenna L Pappalardo et al. Sci Immunol. .

Abstract

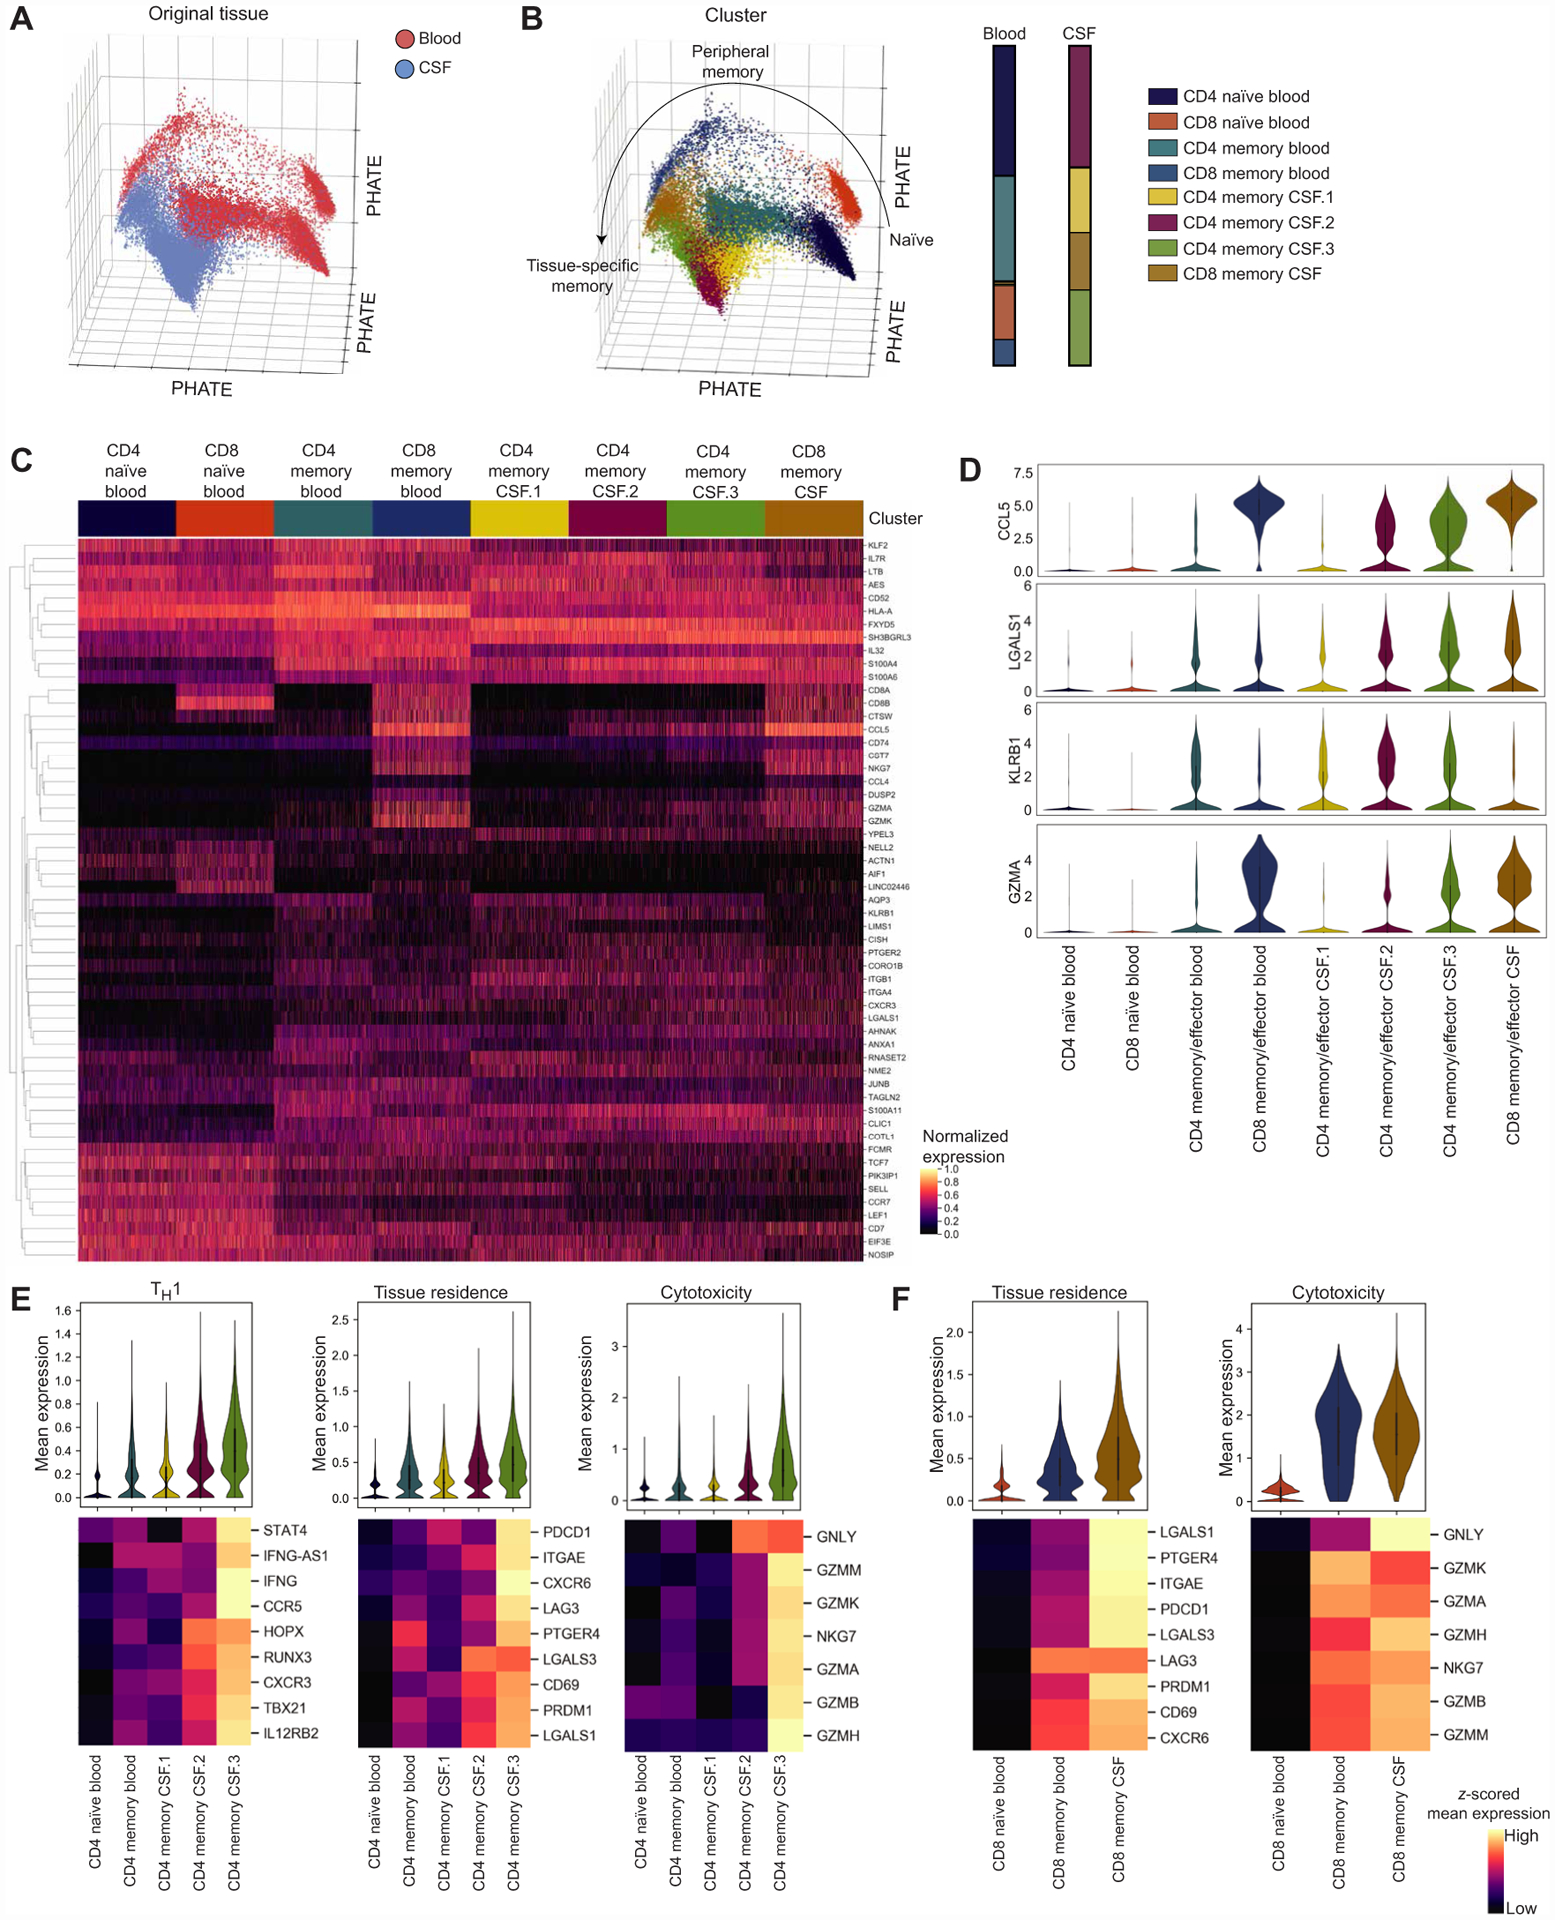
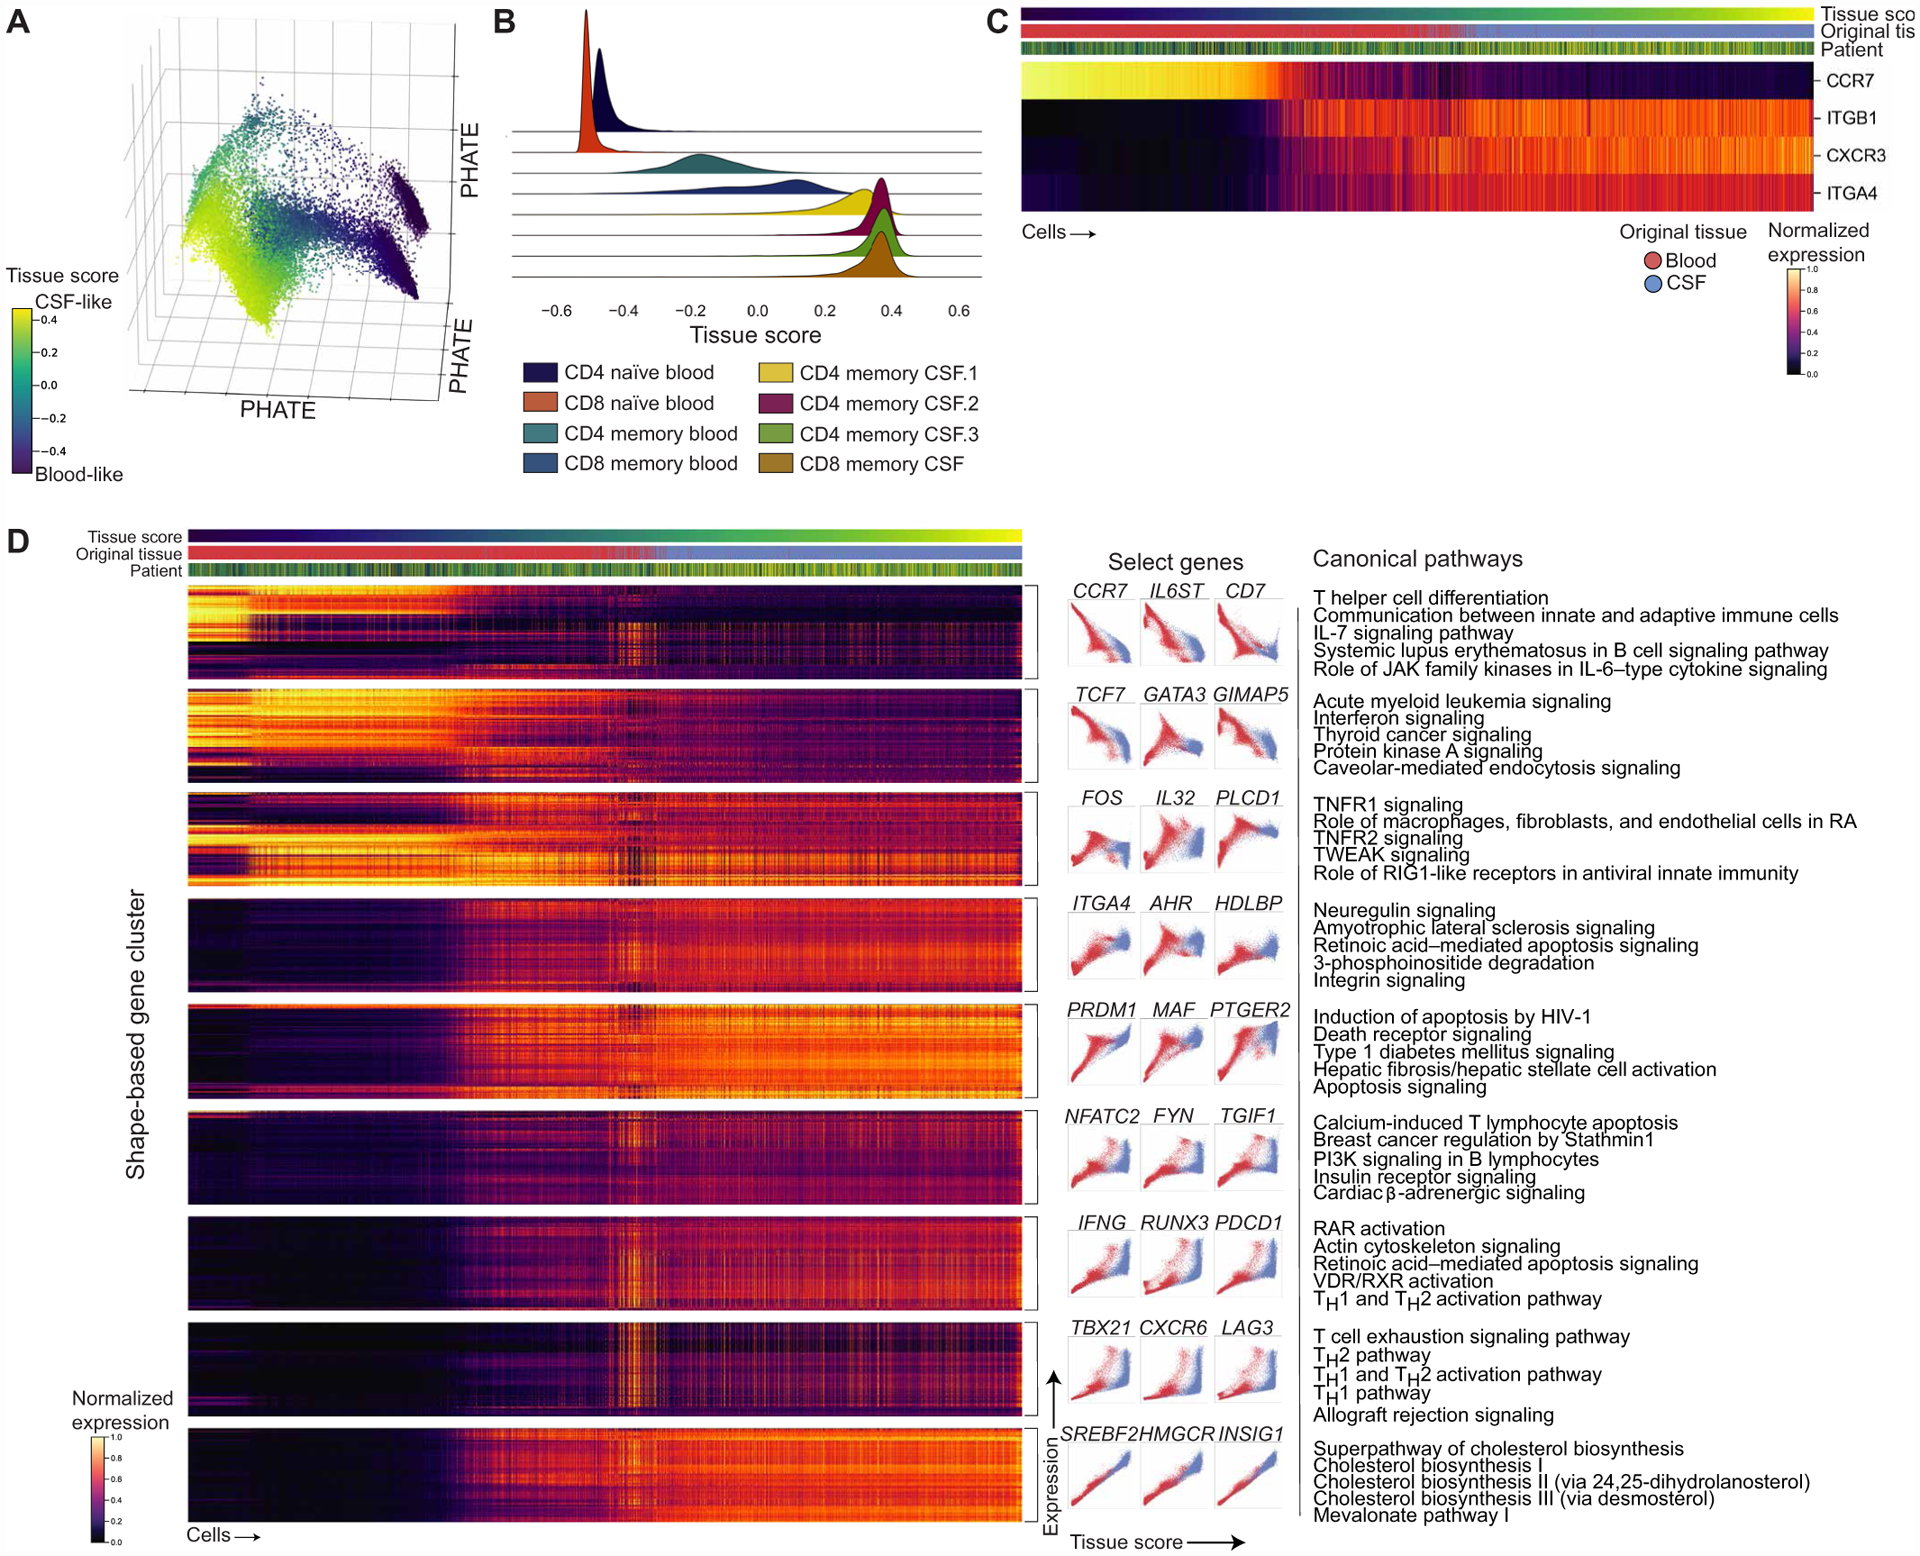
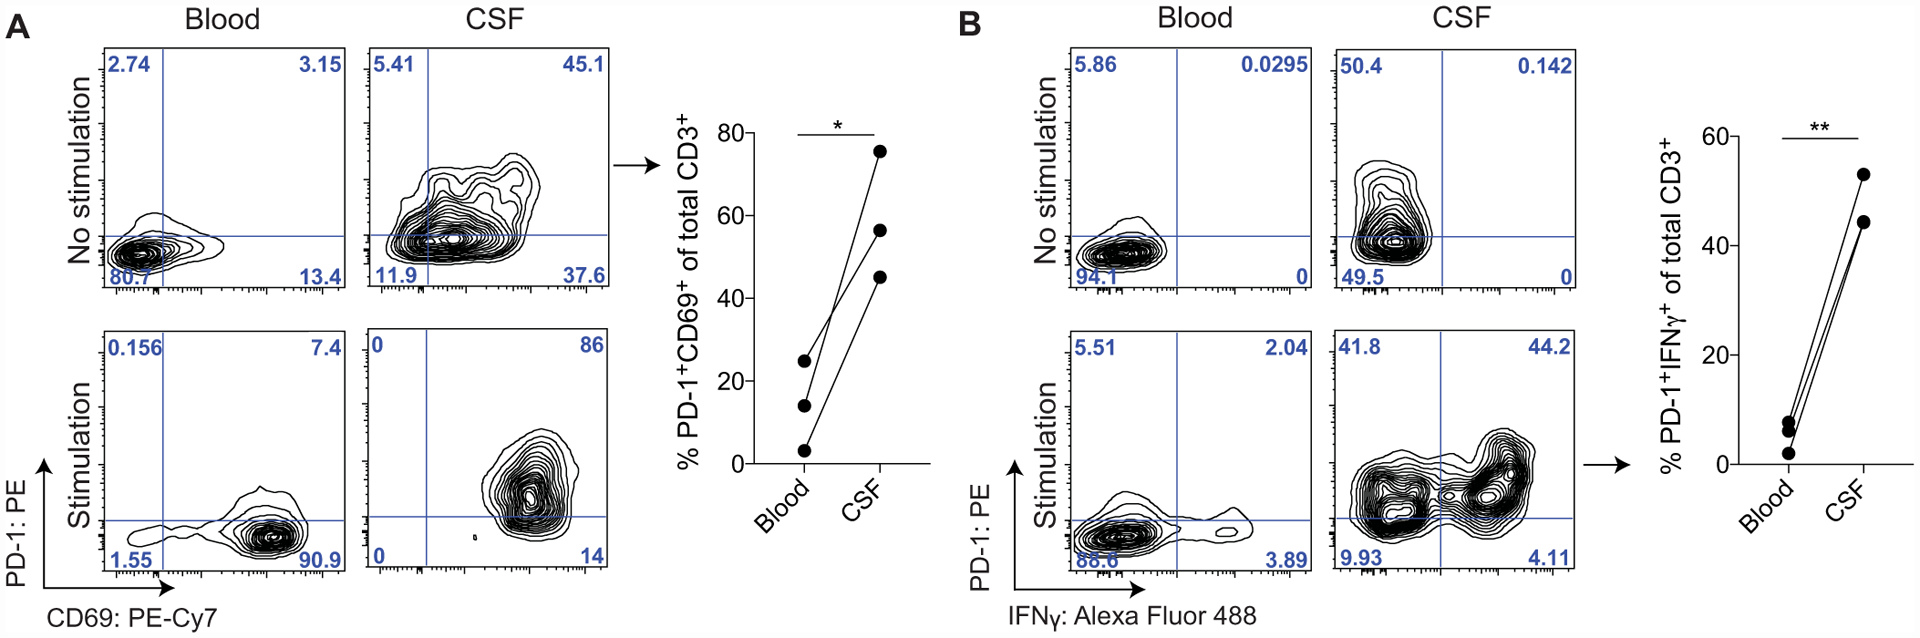
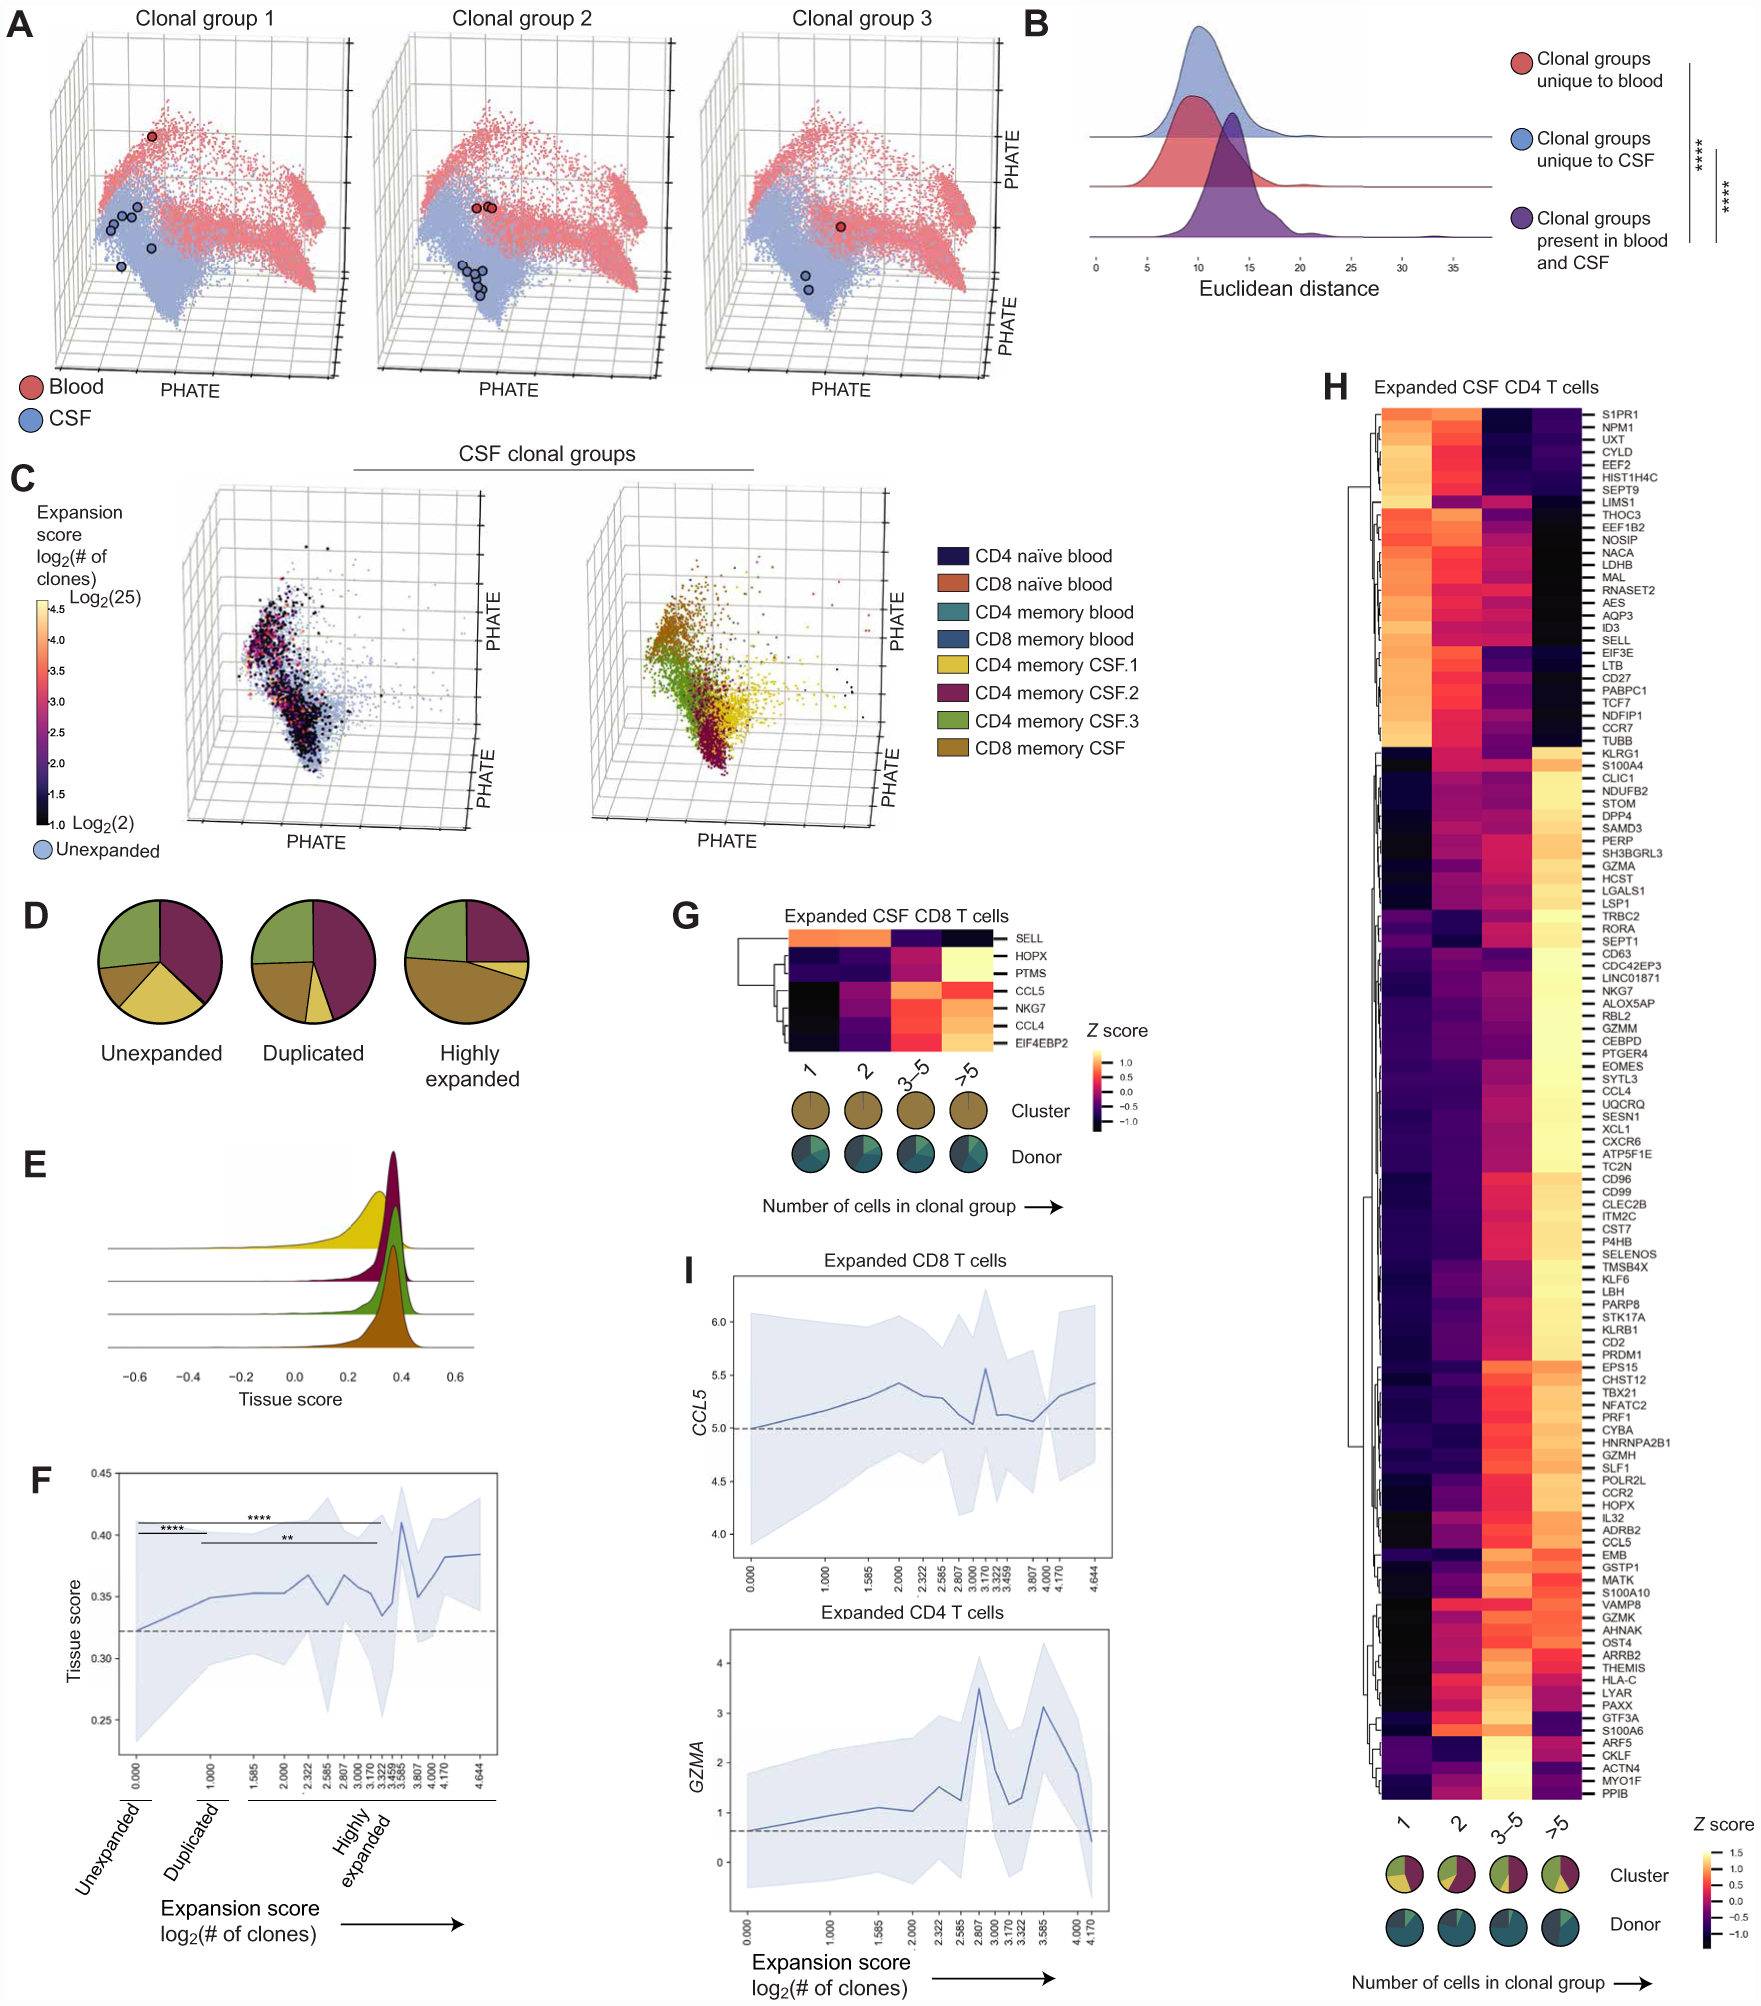
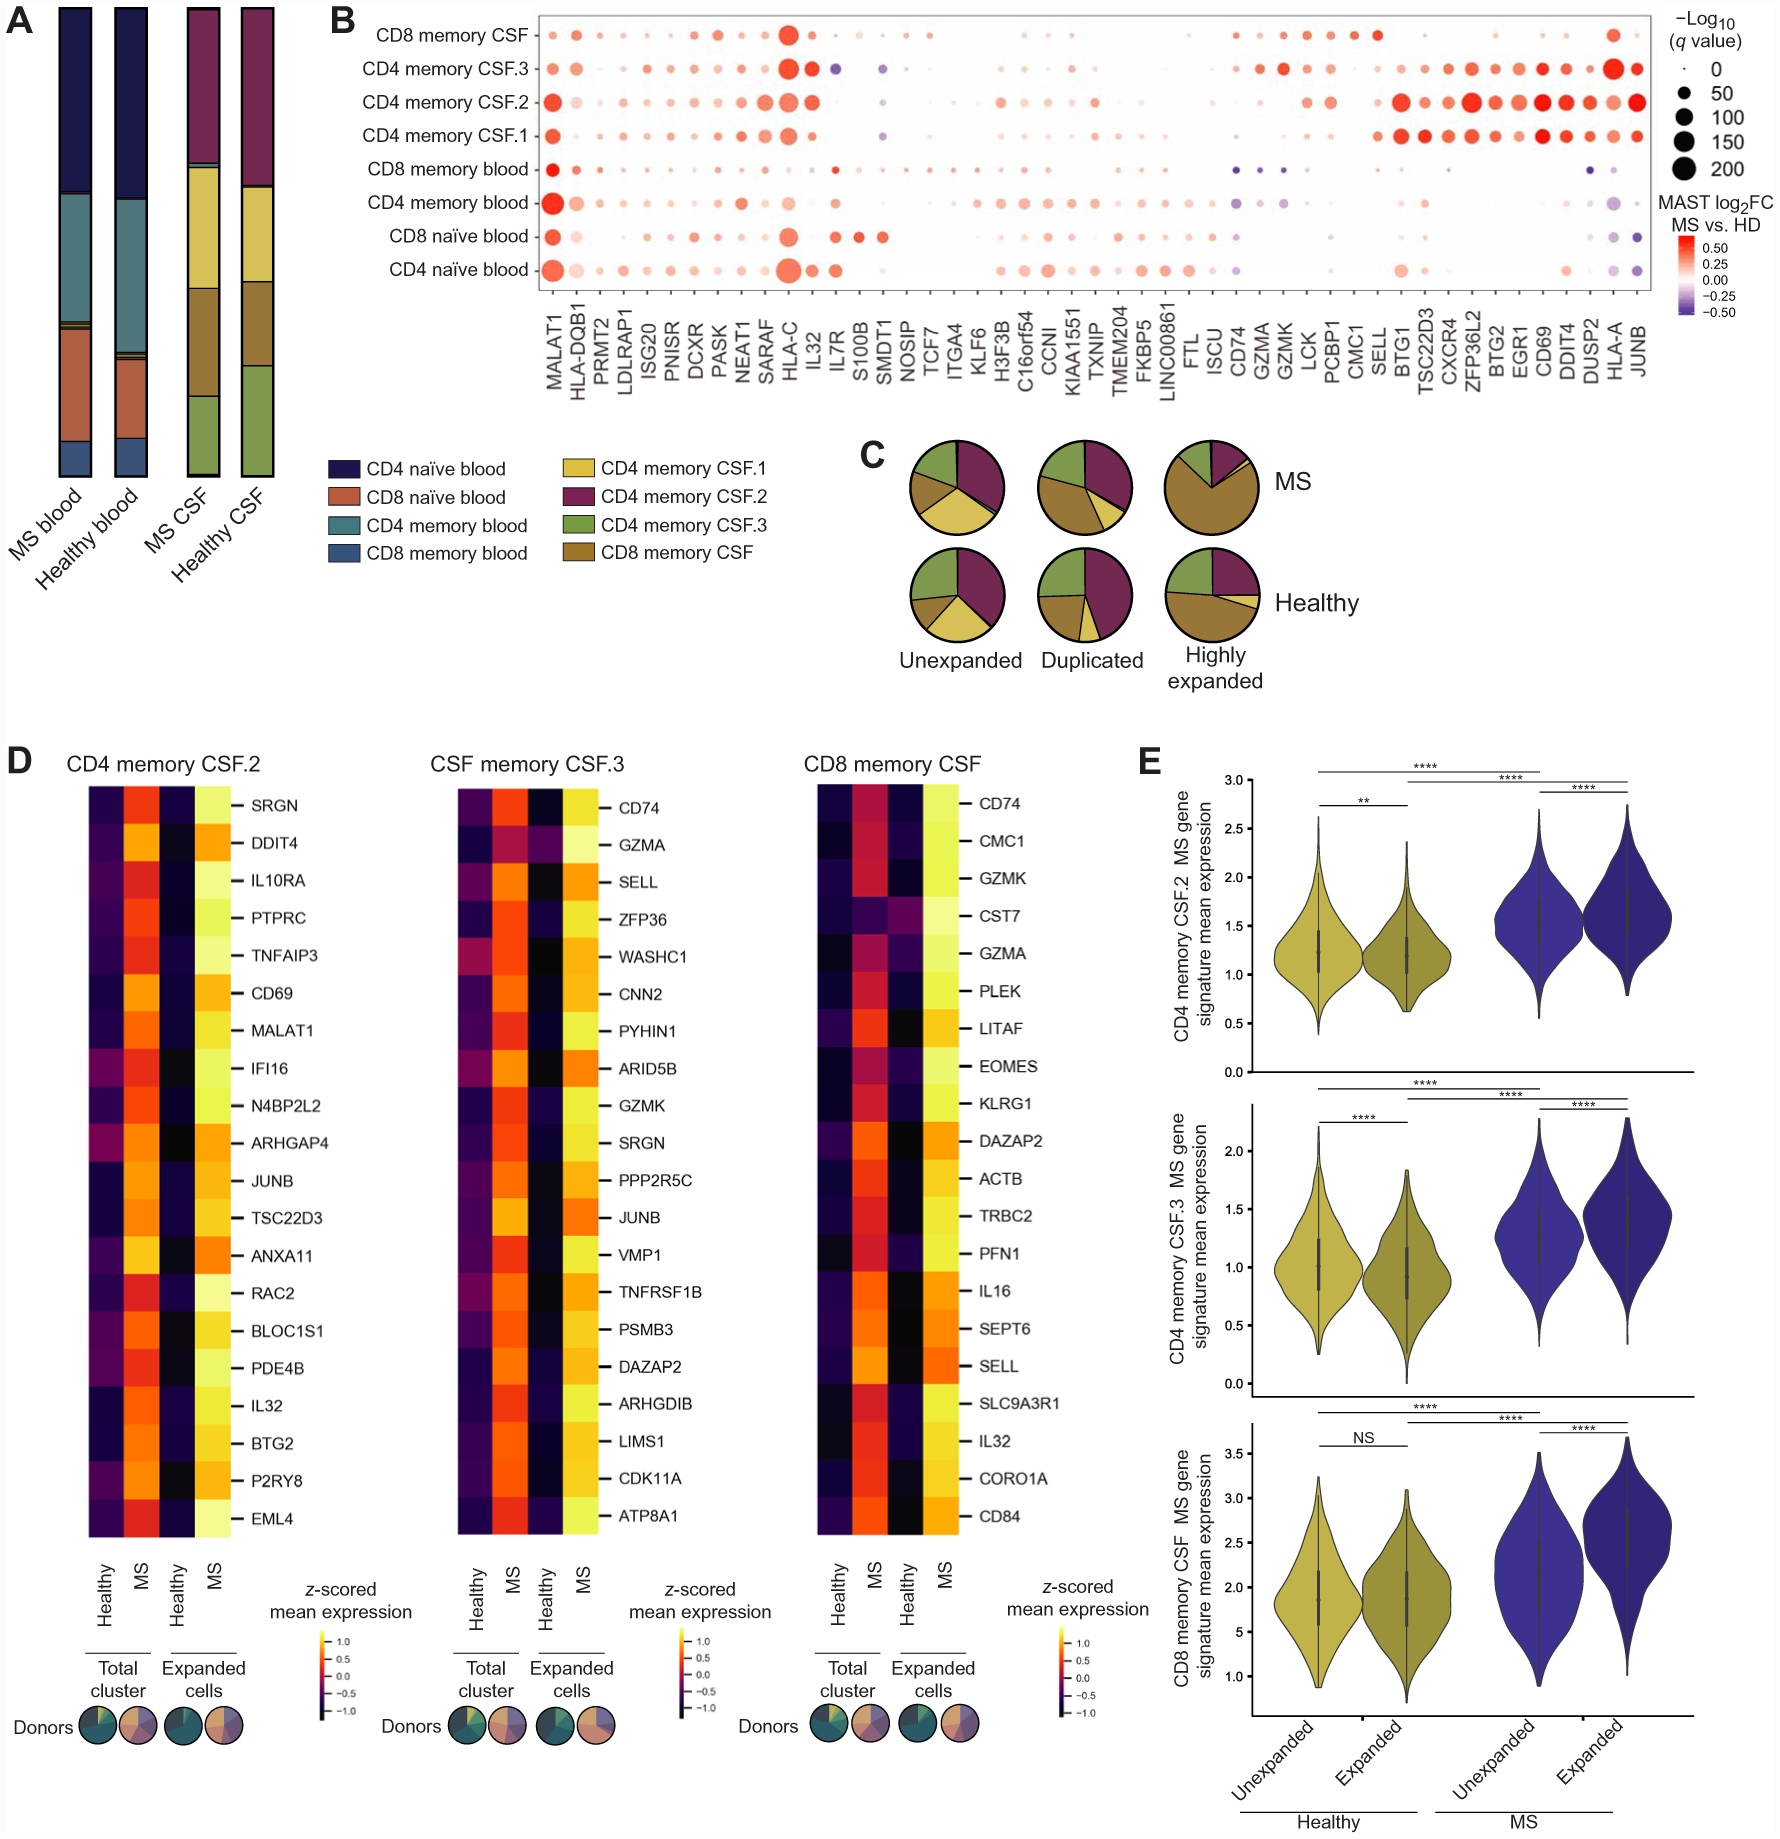
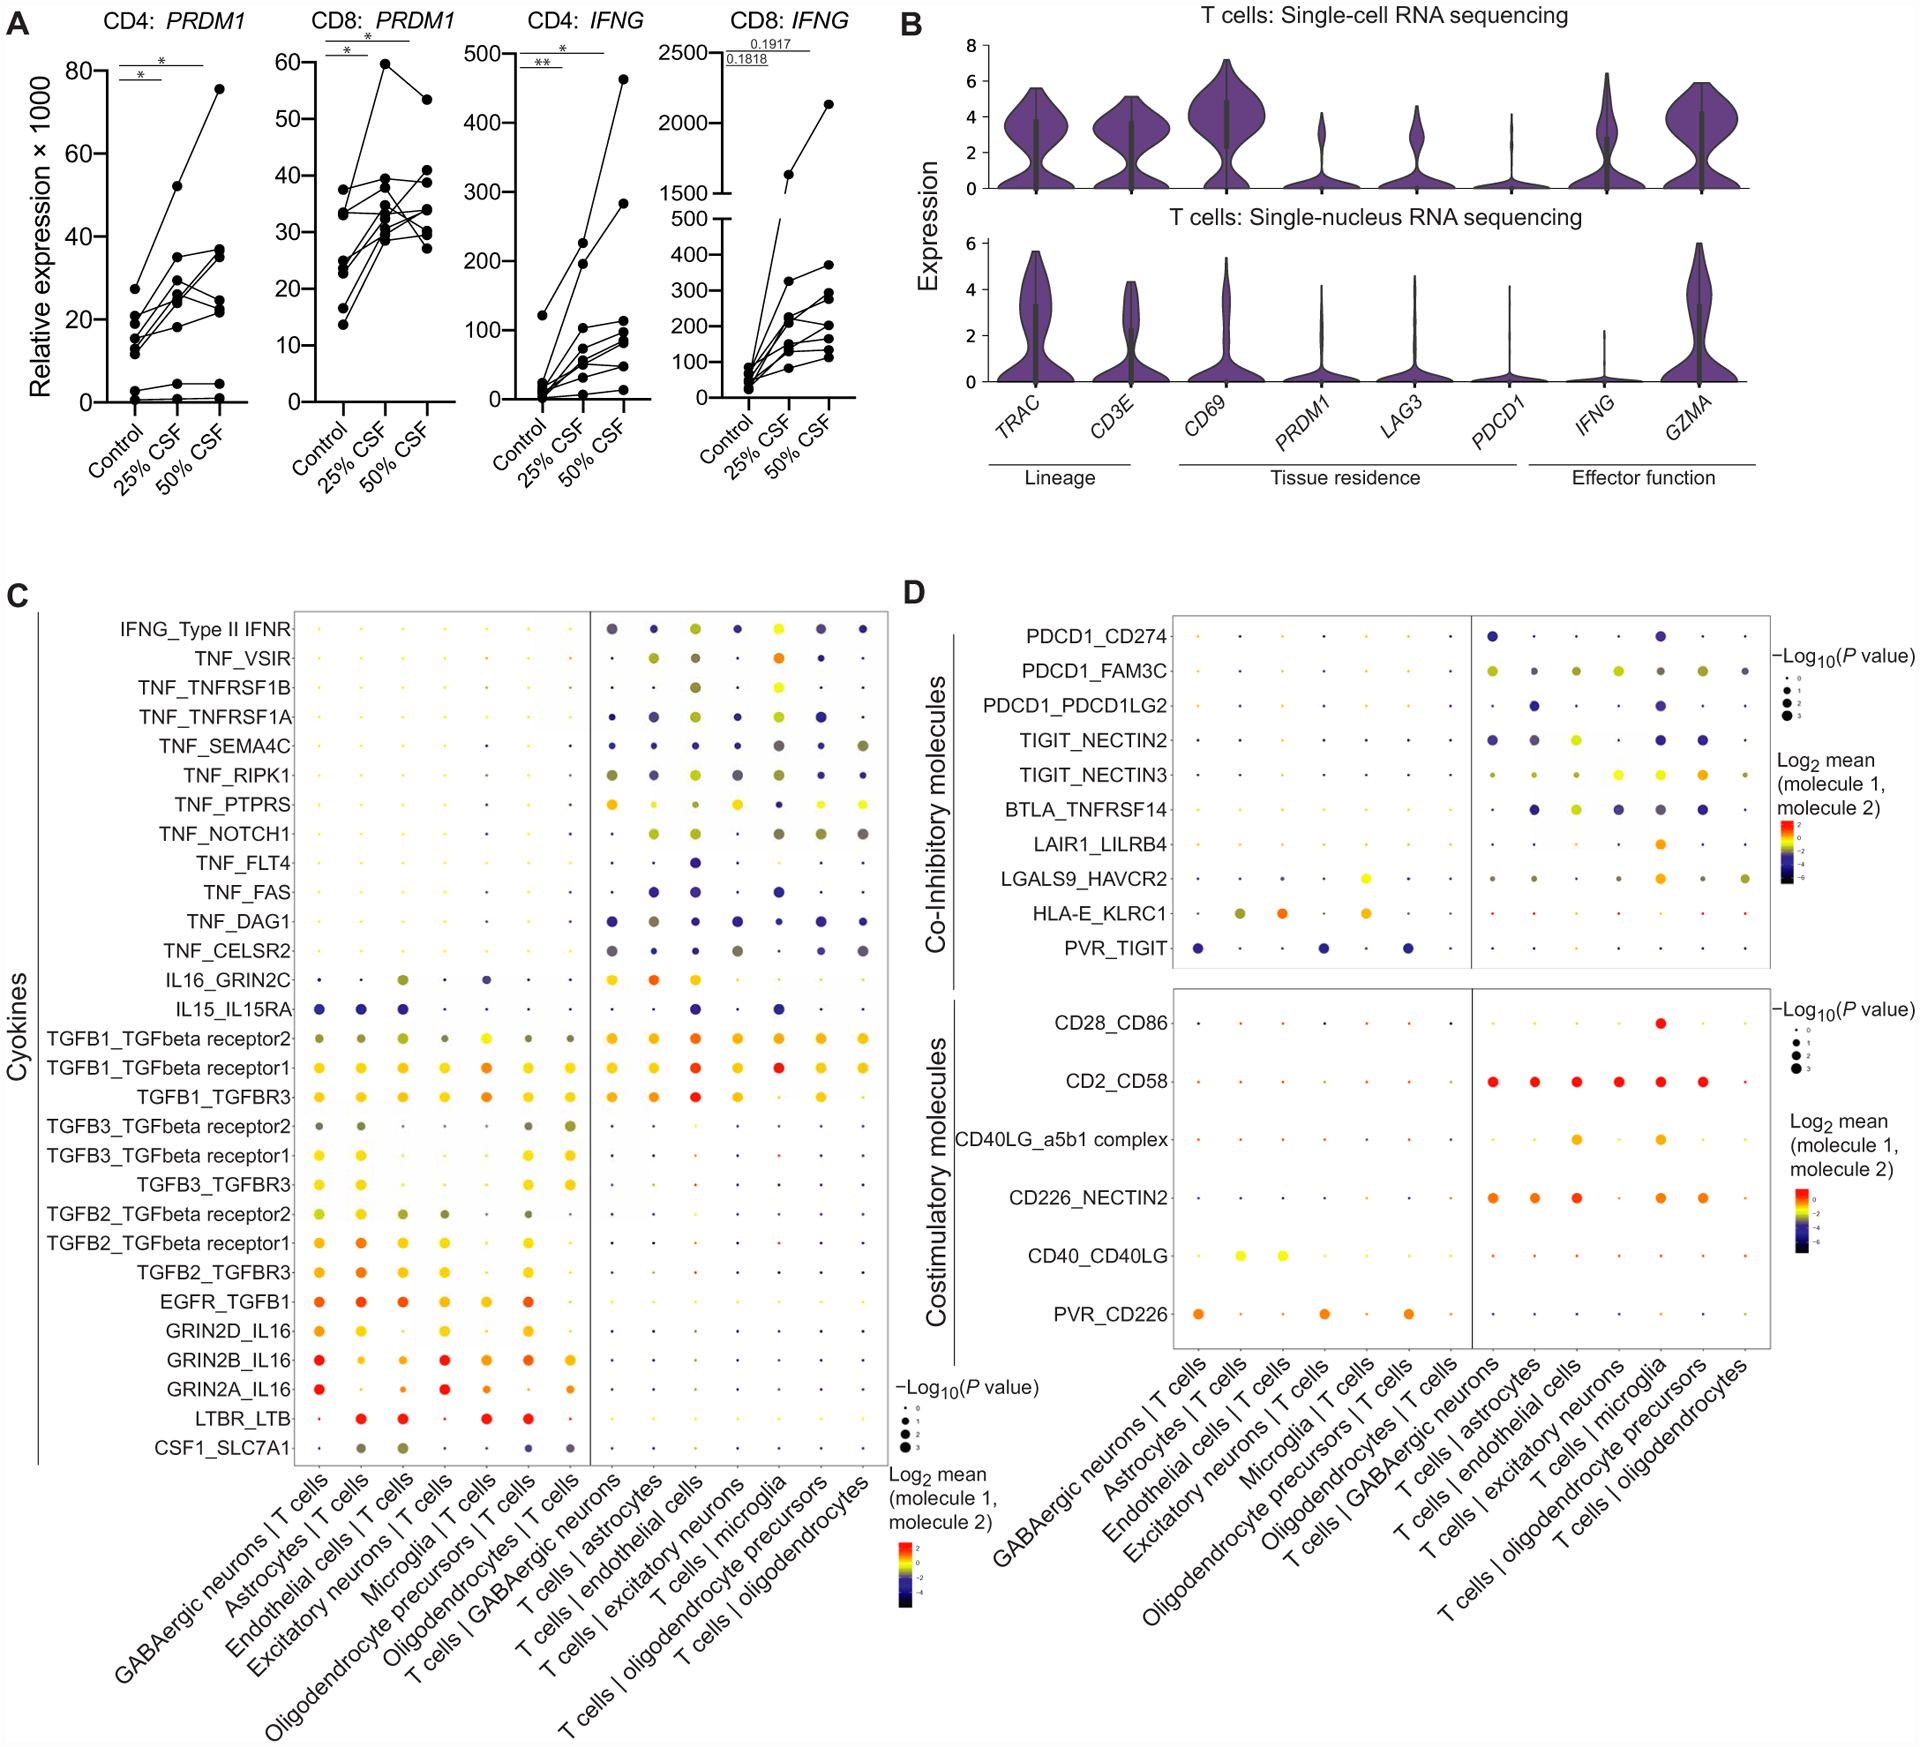
T cells provide critical immune surveillance to the central nervous system (CNS), and the cerebrospinal fluid (CSF) is thought to be a main route for their entry. Further characterization of the state of T cells in the CSF in healthy individuals is important for understanding how T cells provide protective immune surveillance without damaging the delicate environment of the CNS and providing tissue-specific context for understanding immune dysfunction in neuroinflammatory disease. Here, we have profiled T cells in the CSF of healthy human donors and have identified signatures related to cytotoxic capacity and tissue adaptation that are further exemplified in clonally expanded CSF T cells. By comparing profiles of clonally expanded T cells obtained from the CSF of patients with multiple sclerosis (MS) and healthy donors, we report that clonally expanded T cells from the CSF of patients with MS have heightened expression of genes related to T cell activation and cytotoxicity.


Conflict of interest statement

Competing interests: D.A.H. has received funding for his lab from Bristol Myers Squibb, Sanofi, and Genentech. All other authors declared that they have no competing interests.

Figures

Fig. 1.
Fig. 1.. Phenotypic continuum of T cell states between the blood and CSF.
(A) Progression-preserving PHATE visualization of 16,752 T cells from the blood and 14,043 T cells from the CSF of healthy individuals (n = 6 healthy donors) colored by the tissue of origin. (B) PHATE visualization of healthy T cells colored by PhenoGraph clusters with bar graphs showing the composition of T cell clusters in the blood and CSF. Clusters are named if it contains CD4 or CD8 and naïve or memory (antigen-experienced) cells and the tissue where the cluster was predominantly present. (C) Heatmap of standard-scaled expression of the top 10 differentially expressed genes in each cluster in 1000 randomly sampled cells per cluster. Each column is a cell, and genes were hierarchically clustered. (D) Violin plots of expression for select genes presented in (C). (E) Violin plots of mean expression of genes related to TH1 function, tissue residence, and cytotoxicity for each cell in CD4 T cell clusters. Heatmaps show z-scored mean for each gene included in the gene module for each cluster, and genes were hierarchically clustered. CD4 memory CSF.2 and CD4 memory CSF.3 were compared with each other and all other CD4 clusters using a Kruskal-Wallis test with Dunn’s multiple comparisons correction. Full statistics are shown in table S2. (F) Violin plots of mean expression of genes related to tissue residence and cytotoxicity for each cell in CD8 T cell clusters. Heatmaps show z-scored mean expression for each gene included in the gene module for each cluster, and genes were hierarchically clustered. CD8 memory CSF was compared with both other CD8 clusters using a Kruskal-Wallis test with Dunn’s multiple comparisons correction. Full statistics are shown in table S2.
Fig. 2.
Fig. 2.. Gene expression dynamics across the blood-CSF T cell axis.
(A) PHATE visualization (Fig. 1) colored by the continuous tissue score representing the most blood-like to CSF-like state (see Materials and Methods). (B) Joy plot of the distribution of tissue scores for each T cell cluster. (C) Heatmap of chemokine receptors and integrin subunits with reported expression patterns between the blood and CSF with cells ordered by tissue score after gene imputation with MAGIC (see Materials and Methods). Bars above the heatmap show the tissue score, tissue of origin, and donor for each cell. Colored by standard-scaled imputed expression for each gene. (D) Heatmap of shape-based gene clusters (see Materials and Methods) based on gene dynamics with relation to the tissue score clustered by PhenoGraph after MAGIC (left). Bars above the heatmap show the tissue score, tissue of origin, and donor for each cell. Colored by standard-scaled imputed expression for each gene. Example plots depicting the gene shape in each cluster are shown (center) with the top five canonical pathways by P value for each gene cluster (right) (table S3). Genes within clusters were hierarchically clustered, and clusters were manually ordered. JAK, Janus kinase; TNFR1, tumor necrosis factor receptor 1; PI3K, phosphatidylinositol 3-kinase. TWEAK, TNF-related weak inducer of apoptosis; RIG1, retinoic acid-inducible gene I; RAR, retinoic acid receptor; VDR/RXR, vitamin D receptor/retinoid X receptor; RA, Rheumatoid Arthritis.
Fig. 3.
Fig. 3.. CSF T cells retain effector function capacity.
(A) Representative staining of total T cells (CD3+) from one healthy donor PBMCs and CSF after 4 hours in the presence of GolgiStop with or without stimulation (+PMA/ionomycin, 4 hours). Summary plots from the blood and CSF of three healthy individuals show the percentage of the total CD3+ fraction that is PD-1+CD69+ without stimulation. The blood and CSF were compared using a paired two-tailed t test, *P = 0.0359 (fig. S4 and table S10). (B) Representative staining of total T cells (CD3+) from one healthy donor PBMCs and CSF after 4 hours in the presence of GolgiStop with or without stimulation (+PMA/ionomycin, 4 hours). Summary plots from the blood and CSF of three healthy individuals show the percentage of the total CD3+ fraction that is PD-1+IFNγ+ with stimulation (right). The blood and CSF were compared using a paired two-tailed t test, **P = 0.0023 (fig. S4 and table S10).
Fig. 4.
Fig. 4.. Characterization of clonally expanded T cells in healthy CSF.
(A) PHATE visualization with three representative groups from three different donors of clonal groups with cells present in both the blood and CSF (fig. S5). (B) Joy plot showing Euclidean distances between the first 20 PCs of cells in the same clonal group but present in different tissues (purple; 284 clonal groups, n = 6 donors) or cells from clonal groups only in the blood (red; 129 clonal groups, n = 6 donors) or CSF (blue; 448 clonal groups, n = 5 donors). Distances compared by the Kruskal-Wallis test with Dunn’s multiple comparisons correction. ****P < 0.0001. (C) PHATE visualization showing CSF T cells where a TCR (CDR3α/CDR3β) was recovered, including unexpanded cells and expanded cells colored by the expansion score or log2(number of clones) in each group (left). PHATE visualization showing CSF T cells where a TCR was recovered colored by cluster (right). (D) Cluster distribution of unexpanded (7199 CSF T cells), duplicated (2 cells per clonal group, 792 CSF T cells), and highly expanded (>2 cells per clonal group, 708 CSF T cells) CSF T cells in healthy individuals where clonally expanded cells were present (n = 5 donors; fig. S5). Two-way analysis of variance (ANOVA) with Tukey’s multiple comparison correction (adjusted P values): CD4 memory CSF.1 (unexpanded > duplicated, P = 0.0021; unexpanded > highly expanded, P = 0.0007), CD4 memoryCSF.2 (unexpanded > highly expanded, P = 0.0021; duplicated > highly expanded, P = 0.0028), CD8 memory CSF (unexpanded < duplicated, P = 0.0051; unexpanded < highly expanded, P < 0.0001; duplicated < highly expanded, P < 0.0001). (E) Subset of the joy plot shown in Fig. 2B of tissue scores for T cell clusters predominantly in the CSF. Kruskal-Wallis test with Dunn’s multiple comparisons correction between the tissue score for CD4 memory CSF.1 and three other clusters predominantly in the CSF. P < 0.0001 for all comparisons. (F) Line plot of the mean tissue score and SD for each expansion score (n = 5 healthy donors). Gray dashed line shows the mean for unexpanded T cells. Tissue scores of unexpanded, duplicated, and highly expanded cells were compared by the Kruskal-Wallis test with Dunn’s multiple comparisons correction. Unexpanded versus duplicated and unexpanded versus highly expanded, ****P < 0.0001; duplicated versus highly expanded, **P = 0.0014. (G) Heatmap of differentially expressed genes in highly expanded (>2 clones per clonal group, n = 4 donors, 312 cells) compared with unexpanded (n = 4 donors, 751 cells) CSF CD8 T cells in healthy individuals with a MAST-estimated log fold change over log2(1.1) (10% change) and an FDR of <0.05 (see Materials and Methods and table S4) excluding specific TCR genes. Colored by z-scored values of mean expression for each gene. Pie charts below the graph reflect the cluster and patient composition for each expansion group. (H) Heatmap of differentially expressed genes in highly expanded (>2 clones per clonal group, 344 cells) compared with unexpanded (4883 cells) CSF CD4 T cells in healthy individuals (n = 3 donors) with a MAST-estimated log fold change over log2(1.1) (10% change) and an FDR of <0.05 (see Materials and Methods and table S4) excluding specific TCR genes. Colored by z-scored values of mean expression for each gene. Pie charts below the graph reflect the cluster and patient composition for each expansion group. (I) Line plots of the mean expression and SD of GZMA in CD4 CSF T cells (n = 3 donors) and CCL5 in CD8 CSF T cells (n = 4 donors) in relation to the expansion score. Gray dashed line shows the mean expression for unexpanded cells.
Fig. 5.
Fig. 5.. Examining T cells during neuroinflammation in MS.
(A) T cell composition in the blood (15,482 cells) and CSF (19,252 cells) of patients with MS (n = donors) and healthy donors (Fig. 1). Composition in patients with MS and healthy individuals was compared by multiple t tests with FDR correction (desired FDR = 1%): no significant differences (table S5). (B) Dot plot of the top 10 differentially expressed genes by MAST-estimated log fold change (FC) between cells from patients with MS (n = 5) and healthy controls (n = 6) for each T cell cluster (table S6). Values are shown for all clusters where the gene was significantly differentially expressed (FDR < 0.05). Genes were hierarchically clustered. Dot size relates to −log10(q value), and color relates to MAST-estimated log fold change. (C) Cluster distribution of unexpanded (n = 5 patients with MS, 12,382 CSF T cells), duplicated (n = 5 patients with MS, 1,038 CSF T cells), and highly expanded CSF T cells (n = 5 patients with MS, 1170 CSF T cells) in MS. Compared with distribution in healthy individuals by multiple t tests with FDR correction (desired FDR = 1%): no significant differences (table S5). (D) Heat-maps of the top 20 genes differentially expressed genes between expanded cells in patients with MS (n = 5; CD4 memory CSF.2, 505 cells; CD4 memory CSF.3, 358 cells; CD8 memory CSF, 1207 cells) compared with healthy controls (n = 4; CD4 memory CSF.2, 528 cells; CD4 memory CSF.3, 363 cells; CD8 memory CSF, 496 cells) with the largest increase in MAST-estimated log fold change in expanded cells compared with patients with MS compared with healthy controls in the total cluster (n = 6 healthy donors; n = 5 patients with MS). Genes are ordered in descending order of difference in log fold change between MS versus healthy in expanded cells compared with total cluster. MAST-estimated log2 fold changes for the MS versus healthy donor comparison in expanded cells are all greater than a 15% [log2(1.15)] change. Analysis was performed for the three clusters that contained the majority of clonally expanded CSF T cells. Colored by z-scored values of mean expression for each gene. Pie charts below the graph reflect the patient composition for each expansion group. (E) Violin plots of mean expression for genes in the MS gene signature for each cell in each cluster for unexpanded and expanded CSF T cells in patients with MS (n = 5) and healthy donors (n = 4). Genes included in the gene score were the top 20 genes with the largest increase in MAST-estimated log2 fold change between patients with MS versus healthy individuals in expanded CSF T cells compared with the total cluster shown in Fig. 6D (fig. S5). Comparisons within each cluster were made by the Kruskal-Wallis test with Dunn’s multiple comparisons correction. **P = 0.0065, ****P < 0.0001, and NS = P > 0.9999.
Fig. 6.
Fig. 6.. Potential interactions between T cells and glia and neurons.
(A) qPCR results of CD4 or CD8 CD45RO+CXCR3+ T cells from the peripheral blood after they were stimulated with anti-CD3/anti-CD28 in XVIVO15 with or without the presence of healthy CSF supernatant for 48 hours (n = 9 healthy donors). Paired one-way ANOVA with Dunnett’s multiple comparisons test. PRDM1: *P = 0.0128 (CD4 25% CSF), *P = 0.0297 (CD4 50% CSF), *P = 0.0151 (CD8 25% CSF), and *P = 0.0351 (CD8 50% CSF); IFNG: **P = 0.0090 (CD4 25% CSF), **P = 0.0270 (CD4 50% CSF), P = 0.1818 (CD8 25% CSF), P = 0.1917 (CD8 50% CSF). (B) Violin plots of selected genes related to lineage, tissue residence, and functional gene expression in T cells within the brain parenchyma in scRNA-seq (top) (n = 3 donors, 319 T cells) and snRNA-seq (bottom) (n = 3 donors, 233 T cells) (table S8). (C) Dot plot of cell-cell interactions between T cells and glia/neurons from snRNA-seq data (n = 3, 233 T cells, 16,604 parenchymal cells) that involve cytokines calculated by CellPhoneDB (table S9). (D) Dot plot of cell-cell interactions between T cells and glia/neurons from snRNA-seq data (n = 3 donors, 233 T cells, 16,604 parenchymal cells) that involve coinhibitory and costimulatory molecules calculated by CellPhoneDB (table S9).

References

    1. Wilson EH, Weninger W, Hunter CA, Trafficking of immune cells in the central nervous system. J. Clin. Invest 120, 1368–1379 (2010). - PMC - PubMed
    1. Christensen JE, Nansen A, Moos T, Lu B, Gerard C, Christensen JP, Thomsen AR, Efficient T-cell surveillance of the CNS requires expression of the CXC chemokine receptor 3. J. Neurosci 24, 4849–4858 (2004). - PMC - PubMed
    1. Landrith TA, Harris TH, Wilson EH, Characteristics and critical function of CD8+ T cells in the Toxoplasma-infected brain. Semin. Immunopathol 37, 261–270 (2015). - PMC - PubMed
    1. Klein RS, Hunter CA, Protective and pathological immunity during central nervous system infections. Immunity 46, 891–909 (2017). - PMC - PubMed
    1. Warnke C, Menge T, Hartung HP, Racke MK, Cravens PD, Bennett JL, Frohman EM, Greenberg BM, Zamvil SS, Gold R, Hemmer B, Kieseier BC, Stüve O, Natalizumab and progressive multifocal leukoencephalopathy: What are the causal factors and can it be avoided? Arch. Neurol 67, 923–930 (2010). - PMC - PubMed

Publication types

MeSH terms