. 2020 Oct 6;117(40):25074-25084.
doi: 10.1073/pnas.2008013117. Epub 2020 Sep 18.

Transcription factor expression defines subclasses of developing projection neurons highly similar to single-cell RNA-seq subtypes

Affiliations

Transcription factor expression defines subclasses of developing projection neurons highly similar to single-cell RNA-seq subtypes

Whitney E Heavner et al. Proc Natl Acad Sci U S A. .

Abstract

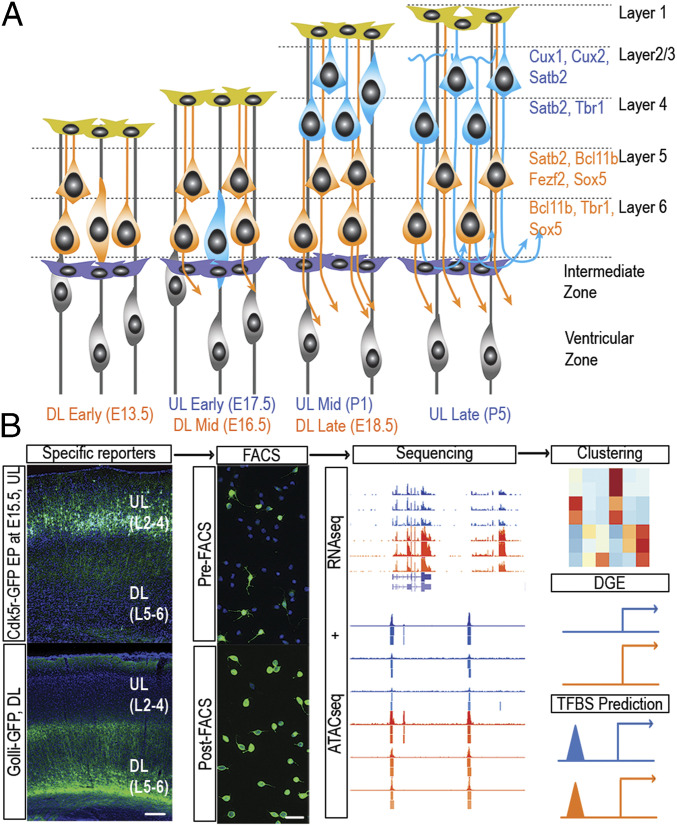
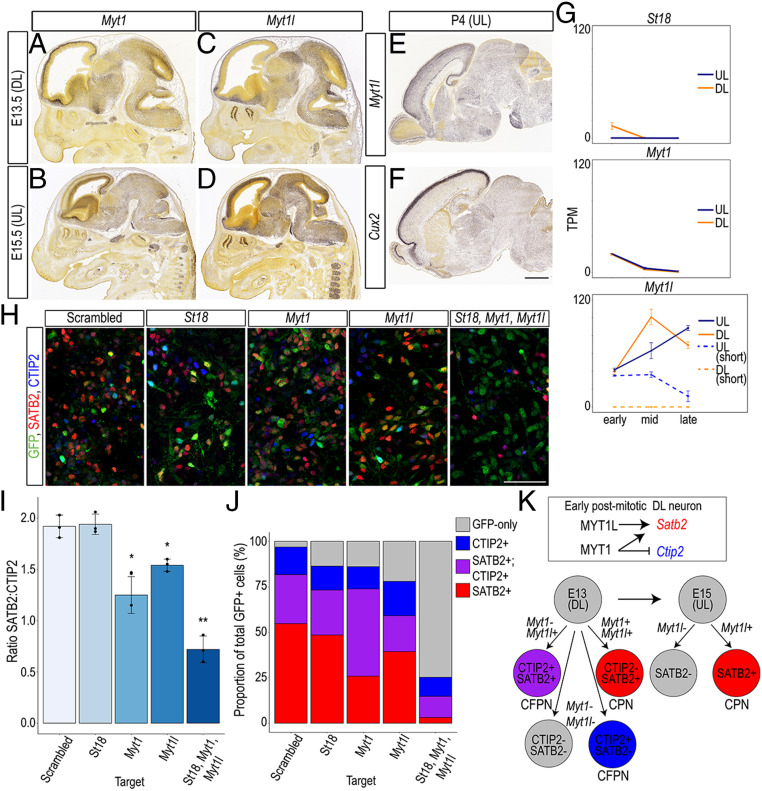
We are only just beginning to catalog the vast diversity of cell types in the cerebral cortex. Such categorization is a first step toward understanding how diversification relates to function. All cortical projection neurons arise from a uniform pool of progenitor cells that lines the ventricles of the forebrain. It is still unclear how these progenitor cells generate the more than 50 unique types of mature cortical projection neurons defined by their distinct gene-expression profiles. Moreover, exactly how and when neurons diversify their function during development is unknown. Here we relate gene expression and chromatin accessibility of two subclasses of projection neurons with divergent morphological and functional features as they develop in the mouse brain between embryonic day 13 and postnatal day 5 in order to identify transcriptional networks that diversify neuron cell fate. We compare these gene-expression profiles with published profiles of single cells isolated from similar populations and establish that layer-defined cell classes encompass cell subtypes and developmental trajectories identified using single-cell sequencing. Given the depth of our sequencing, we identify groups of transcription factors with particularly dense subclass-specific regulation and subclass-enriched transcription factor binding motifs. We also describe transcription factor-adjacent long noncoding RNAs that define each subclass and validate the function of Myt1l in balancing the ratio of the two subclasses in vitro. Our multidimensional approach supports an evolving model of progressive restriction of cell fate competence through inherited transcriptional identities.

Keywords: cortical development; gene regulation; next-generation sequencing; transcription.


Conflict of interest statement

The authors declare no competing interest.

Figures

Fig. 1.
Fig. 1.
Excitatory projection neurons of the mouse neocortex can be subdivided into two broad classes, here called upper layer (UL) and deep layer (DL), each identified by a specific combination of TFs and labeled by an exclusive fluorescent reporter. (A) Schematic representation of neocortical development illustrating the stereotypical “inside-first, outside-last” sequence of cell fate specification and differentiation: DL neurons are generated first and reach milestones of development prior to UL neurons. (B) Experimental pipeline showing in vivo expression of subclass-specific reporters, FACS purification, and computational analysis. (Lower Left) Mouse cortex at P25 expressing Golli-GFP in DL neurons, L6 apical dendrites terminating in L4. (Upper Left) mouse cortex at P9 expressing Cdk5r-GFP in UL neurons occupying L2/3. (Scale bars, 100 μm for in vivo expression and 20 μm for dissociated cells.)
Fig. 2.
Fig. 2.
HCPC and naive hierarchical clustering show that gene expression is able to distinguish cell subclass. (AD) HCPC of all transcripts (A and B) and of all TF transcripts (C and D) shows that variance between subclasses is captured in the first PC and variance between stage is captured in the second PC. (E) Unsupervised hierarchical clustering of the top 500 most variable Ensembl mm9 transcripts separates UL from DL neurons and identifies a cluster of UL-like or noisy transcripts in DL neurons. Clusters labeled to the right are listed in SI Appendix, Table S1. (F) Shared expression of subclass-defining genes identified by bulk RNA-seq or scRNA-seq. (G) Hypergeometric P values of the overlap of subclass-defining genes identified by bulk RNA-seq and stage-defining L4 genes identified by scRNA-seq. Color-filled cells indicate significance after correcting for multiple comparisons. Darker shades indicate more overlap. (H) Predicted cell types contained within each subclass.
Fig. 3.
Fig. 3.
Specific expression of a set of TFs throughout development distinguishes UL from DL populations. (A and B) Heatmaps of relative expression of TFs that are significantly higher in DL (A) or UL (B) neurons at all three stages of development. FL, full length. Transcripts with a black dot are shown in C. Underlined gene names are referenced in the human dataset in F. (C) In situ hybridization of the DL TF Zfp521 and the UL TF Bhlhe40 on sections through the embryonic mouse brain. High-magnification images of the boxed regions show restricted expression in the deep (Zfp521) or superficial (Bhlhe40) layers of the CP. (Scale bar, 800 μm for low-magnification images and 100 μm for high-magnification images.) Image credit: © 2009 and 2012 Allen Institute for Brain Science. Mouse Brain. Available from: developingmouse.brain-map.org. (D) Heatmap of relative expression of DL- and UL-specific early TFs. For all three heatmaps, each column represents the average TPM of two replicates. (E) FISH of the DL early TF St18 on sections through the mouse cortex showing enriched expression in L6 at E13.5 and reduced expression at E16.5. (Scale bar, 50 μm.) (F) Unsupervised hierarchical clustering of the top 500 most variable transcripts between embryonic and adult human motor cortex reveals expression of DL and UL TFs in the embryonic cluster and two UL TFs in the adult cluster. PCW, postconception weeks.
Fig. 4.
Fig. 4.
Satb2-lncRNA is differentially expressed in cortical neurons over time and space. (A) TF-lncRNAs show increased expression (in TPM) during the middle stage in DL neurons, and Satb2-lncRNA shows a similar spike in UL neurons. (BD′′) FISH showing parallel expression of Satb2-lncRNA (BD) and Satb2 (B′D′; merged channels in B′′D′′) in the mouse neocortex at E13.5, E16.5, and P0. (Scale bar in D′′ is 200 μm for BD′′) (EH) FISH of Satb2-lncRNA colabeled with Satb2 RNA at P3 (E and F), SATB2 protein (G), or CTIP2 protein (H) showing expression in UL nuclei (arrow) and cell bodies (arrowhead) (E), DL nuclei (arrow) (F), and most SATB2+ (arrowhead in G), but few CTIP2+ (arrowhead showing colabeling versus arrow showing CTIP+/lncRNA cell in H) in cultured mouse cortical cells. (Scale bar shown in H is 50 μm and applies to EH.) (I and J) Fewer DL cells express Satb2-lncRNA compared with UL cells (I) (n = 3), and only about a quarter of CTIP2+ cells express Satb2-lncRNA, while almost all SATB2+ cells express the lncRNA (J) (n = 6). Error bars represent SD. *P < 0.05. ***P < 0.0001.
Fig. 5.
Fig. 5.
Densely regulated TFs suggest subclass-specific transcriptional programs. (A) Fragment length density for each ATAC-seq library; two biological replicates per stage represented by solid and dotted lines of the same color. (B) ATAC-seq peaks significantly overlap previously identified cortical enhancers and repressors. (C) Top conserved P300-bound enhancers and putative target genes in each subclass. (D) Binomial test showing that a subclass-specific ATAC-seq peak is more likely to occur in the regulatory domain of a gene more highly expressed in the same subclass. (E) Enriched motifs and TF consensus sites in ATAC-seq peaks of densely regulated DL and UL genes. (F) Differentially expressed TFs between DL and UL neurons plotted by log2(fold-change) in expression (x axis) and binomial P value (y axis). Each comparison is UL/DL. TFs with the greatest change in binomial P value or referenced in Figs. 5 and 6 are labeled. (GJ′) In situ hybridization of select densely regulated TFs. Image credit: (Right to Left) © 2008 and 2009 Allen Institute for Brain Science. Mouse Brain. Available from: developingmouse.brain-map.org. The arrowhead in G′ indicates residual Nhlh2 expression in the hindbrain. (Scale bar in J′ is 700 μm for G and H, 1 mm for G′ and H′, and 1.1 mm for I–J′.)
Fig. 6.
Fig. 6.
MYT family TFs show stage- and subclass-specific expression in vivo and regulate subclass-specific genes in vitro. (AF) The MYT family TFs Myt1 and Myt1l show early expression in the mouse CP (A and C) but diverge at E15.5 such that Myt1 expression is excluded from the superficial CP (B), while Myt1l is enriched in superficial layers (D). Myt1l remains enriched in UL cells through P4 (E) similar to that of the UL TF Cux2 (F). (Scale bar in F is 800 μm for A and C, and 1.2 mm for B and DF.) Image credit: (Right to Left) © 2009 Allen Institute for Brain Science. Mouse Brain. Available from: developingmouse.brain-map.org. (G) St18 and Myt1 expression decline throughout neuron differentiation, while Myt1l expression increases throughout UL differentiation, and one isoform of Myt1l is consistently higher in UL cells. (H) pSico-GFP (green), SATB2 (red), and CTIP2 (blue) expression in cultured cortical neurons after lentiviral transfection of a shRNA targeting a scrambled control, St18, Myt1, Myt1l, or all three on E13.5 + 1 d in vitro. (Scale bar, 100 μm.) (I) shRNA KD of Myt1 or Myt1l but not of St18 significantly reduced the ratio of SATB2+ to CTIP2+ cortical neurons compared with KD of a scrambled control target. shRNA KD of all three Myt family TFs very significantly reduced the ratio of SATB2+ to CTIP+ neurons. *P < 0.02. **P < 0.001. n = 3 biological replicates. (J) The proportion of SATB2;CTIP2 double-positive cells was increased after Myt1 KD, causing a reduction in the proportion of SATB2-only cells (P = 0.02). The proportion of all SATB2+ cells was decreased after Myt1l KD (P = 0.05). KD of all three MYT family TFs resulted in a significant reduction of SATB2+ cells (P = 0.0005) and a very significant increase in GFP-only cells (P = 0.006). (K) Model of how MYT1 and MYT1L may coregulate Satb2 expression, and MYT1 may antagonize Ctip2 expression, in developing DL neurons, and how MYT1L may regulate Satb2 expression in developing UL neurons. Error bars represent SD.

Similar articles

Cited by

References

    1. Tasic B. et al. ., Shared and distinct transcriptomic cell types across neocortical areas. Nature 563, 72–78 (2018). - PMC - PubMed
    1. Rosenberg A. B. et al. ., Single-cell profiling of the developing mouse brain and spinal cord with split-pool barcoding. Science 360, 176–182 (2018). - PMC - PubMed
    1. Tasic B. et al. ., Adult mouse cortical cell taxonomy revealed by single cell transcriptomics. Nat. Neurosci. 19, 335–346 (2016). - PMC - PubMed
    1. Bakken T. E. et al. ., A comprehensive transcriptional map of primate brain development. Nature 535, 367–375 (2016). - PMC - PubMed
    1. Zeng H., Sanes J. R., Neuronal cell-type classification: Challenges, opportunities and the path forward. Nat. Rev. Neurosci. 18, 530–546 (2017). - PubMed

Publication types

Substances

LinkOut - more resources