. 2020 Sep 18;10(1):15318.
doi: 10.1038/s41598-020-72273-3.

Pressure overload by suprarenal aortic constriction in mice leads to left ventricular hypertrophy without c-Kit expression in cardiomyocytes

Affiliations

Pressure overload by suprarenal aortic constriction in mice leads to left ventricular hypertrophy without c-Kit expression in cardiomyocytes

Amy M Nicks et al. Sci Rep. .

Abstract

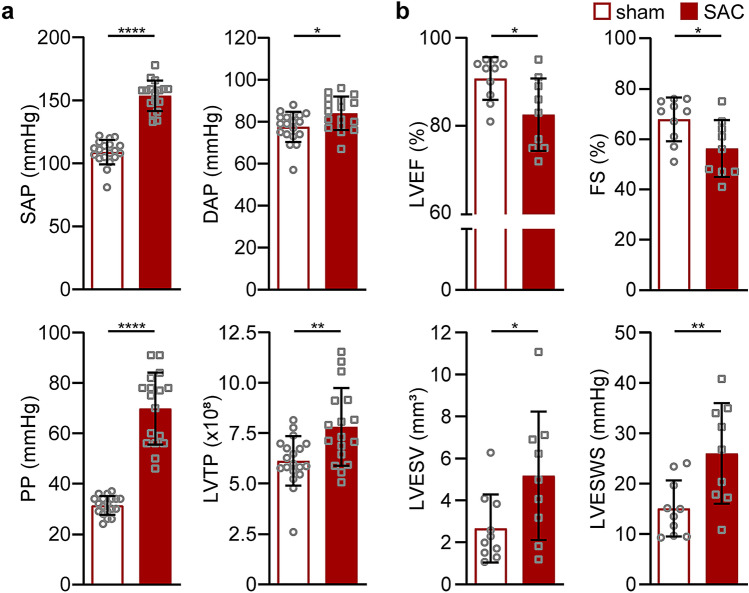
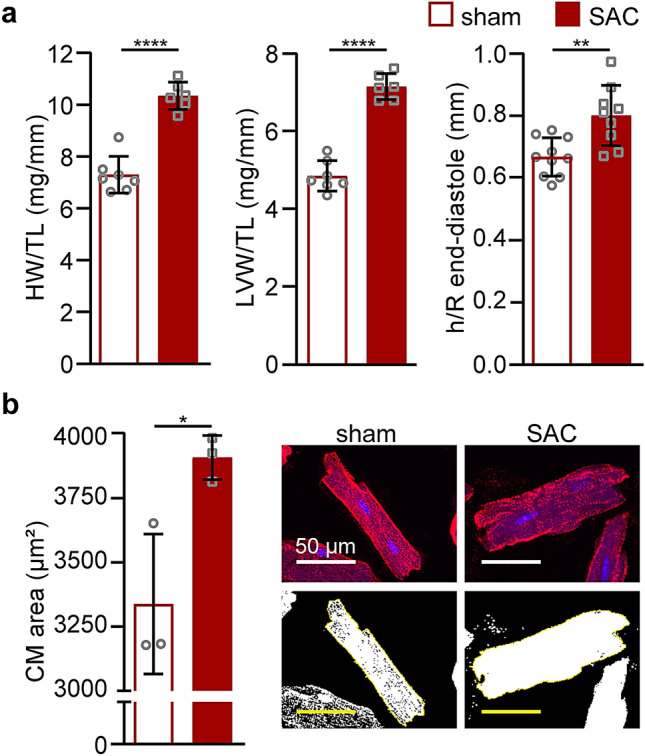
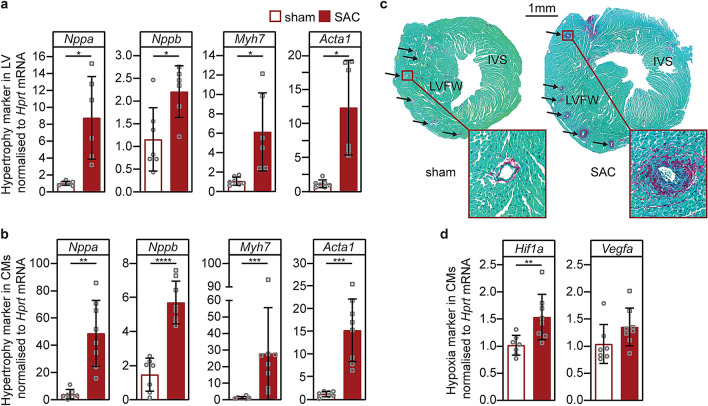
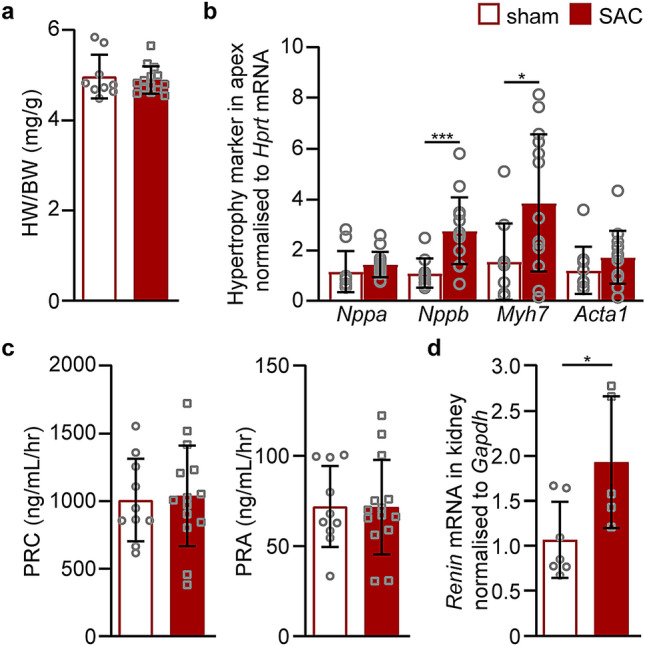
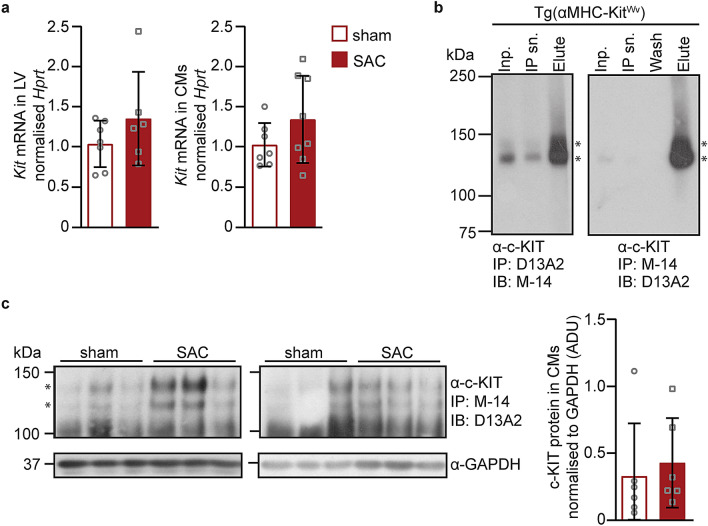
Animal models of pressure overload are valuable for understanding hypertensive heart disease. We characterised a surgical model of pressure overload-induced hypertrophy in C57BL/6J mice produced by suprarenal aortic constriction (SAC). Compared to sham controls, at one week post-SAC systolic blood pressure was significantly elevated and left ventricular (LV) hypertrophy was evident by a 50% increase in the LV weight-to-tibia length ratio due to cardiomyocyte hypertrophy. As a result, LV end-diastolic wall thickness-to-chamber radius (h/R) ratio increased, consistent with the development of concentric hypertrophy. LV wall thickening was not sufficient to normalise LV wall stress, which also increased, resulting in LV systolic dysfunction with reductions in ejection fraction and fractional shortening, but no evidence of heart failure. Pathological LV remodelling was evident by the re-expression of fetal genes and coronary artery perivascular fibrosis, with ischaemia indicated by enhanced cardiomyocyte Hif1a expression. The expression of stem cell factor receptor, c-Kit, was low basally in cardiomyocytes and did not change following the development of robust hypertrophy, suggesting there is no role for cardiomyocyte c-Kit signalling in pathological LV remodelling following pressure overload.


Conflict of interest statement

The authors declare no competing interests.

Figures

Figure 1
Figure 1
Hypertension phenotype after SAC-induced pressure overload. (a) Hemodynamic measurements were recorded one week post-surgery (sham, n = 18; SAC, n = 15) in adult male C57BL/6J mice (9-week-old) and analyzed using AcqKnowledge software (v3.8). SAP systolic aortic pressure, DAP diastolic aortic pressure, PP pulse pressure, LVTP LV triple product (mmHg2/s2), LVEF LV ejection fraction. (b) Echocardiography was performed six days post-sham or -SAC surgery (sham, n = 11; SAC, n = 9) in adult male C57BL/6J mice (9-week-old). EF ejection fraction, FS fractional shortening, LVESV LV end-systolic volume, LVESWS LV end-systolic wall stress. Data are presented as means ± SD; independent comparisons were made by two-tailed Student’s unpaired t-tests; *P < 0.05, **P < 0.01, and ****P < 0.0001.
Figure 2
Figure 2
SAC-induced pressure overload leads to LV and cellular hypertrophy. Gross morphology measurements were made at one week after sham or SAC surgery in adult male C57BL/6J mice (9-week-old). (a) Heart and LV weights were normalized to TL (sham, n = 7; SAC, n = 6). LV wall thickness (h) to internal LV chamber radius (R) ratio dimensions were measured by echocardiography six days post-surgery (sham, n = 10; SAC, n = 9). (b) Cardiomyocyte (CM) areas were measured using ImageJ (n = 3 mice per group, 30–40 binucleated CM areas were measured) and representative images are shown. Top, CM membranes were stained with laminin (red) and DNA with DAPI (blue); bottom, replica binary images show the cell area (white) within the outline of each CM measured using ImageJ. Data are presented as means ± SD; independent comparisons were performed using two-tailed Student’s unpaired t-tests; *P < 0.05, **P < 0.01, and ****P < 0.0001. LV left ventricle, HW heart weight, TL tibia length.
Figure 3
Figure 3
Pathological LV hypertrophy and perivascular fibrosis post-SAC. Pathological hypertrophy marker mRNAs were evaluated one week post-sham or -SAC surgery in adult male C57BL/6J mice (9-week-old) from (a) LV tissue (sham, n = 7; SAC, n = 6) or (b) enriched cardiomyocyte fractions (sham, n = 7; SAC, n = 8). (c) Representative transverse LV sections demonstrate the development of perivascular fibrosis around the coronaries (indicated by black arrows) after SAC-surgery (right) compared to sham-surgery (left). Sections were stained with Fast Green and Picrosirius Red to identify the cytoplasm and collagen, respectively. (d) Hif1a and Vegfa expression in cardiomyocytes one week post-SAC (sham, n = 7; SAC, n = 8). Data are presented as means ± SD, independent comparisons were made by two-tailed Student’s unpaired t-tests; *P < 0.05, **P < 0.01, ***P < 0.001 and ****P < 0.0001.
Figure 4
Figure 4
Pathological cardiac remodelling at 24 h post-SAC. Sham and SAC surgeries were performed on adult male C57BL/6J mice at 8–10 weeks of age and tissues were collected at 24 h after surgery. Heart-to-body weight (HW/BW) ratios (a) and the expression of pathological hypertrophy markers in the apex of the heart (b) were determined at 24 h after sham (n = 10) or SAC (n = 14) surgery. (c) Plasma renin concentration (PRC) and activity (PRA) were measured from blood plasma collected at 24 h post-surgery (sham = 10, SAC = 14). (d) At one week post-surgery, the expression of renin mRNA was determined in kidney tissues harvested from adult male C57BL/6J mice (9-week-old; sham, n = 7; SAC, n = 5). Data are presented as means ± SD, independent comparisons were made by two-tailed Student’s unpaired t-tests; *P < 0.05, **P < 0.01, ***P < 0.001 and ****P < 0.0001.
Figure 5
Figure 5
c-Kit mRNA and protein expression following pressure overload. (a) At one week post-surgery in adult male C57BL/6J mice (9-week-old) c-Kit mRNA expression (Kit, normalized to Hprt) in LVs (sham = 7; SAC = 6) or cardiomyocyte-enriched fractions (sham, n = 7; SAC, n = 8) was evaluated following SAC surgery. (b) Anti-c-Kit antibody (Ab) specificity was demonstrated by immunoprecipitation (IP) of heart lysates (400 μg) from transgenic mice overexpressing the dominant negative Wv c-Kit mutant, Tg(αMHC-KitWv), using either anti-c-Kit D13A2 or M-14 Ab (1:50) followed by size-fractionation and immunoblotting (IB) with the other anti-c-Kit Ab M-14 (1:1,000) or D13A2 (1:500), followed by secondary horseradish peroxidase (HRP) antibodies (1:4,000) and detection using Western Lightning ECL (low HRP sensitivity, Supplementary Fig. S3). Films were exposed to blots for 1 min. Inp., IP input (20 µl); IP sn., IP supernatant (20 µl); IP wash (20 µl); Elute, IP elution from beads (20 µl). (c) c-Kit protein was immunoprecipitated from cardiomyocyte lysates (3.5 mg) using anti-c-Kit M-14 (1:50) antibody followed by IB using D13A2 (1:500) anti-c-Kit Ab, and then a secondary HRP antibody (1:10,000). Proteins were detected using Pierce ECL Plus (high HRP sensitivity, Supplementary Fig. S3) at one week post–sham or –SAC surgery (n = 6 per group) from C57BL/6J adult male mice (9-week-old). Films were exposed to blots for 10 min. c-Kit and GAPDH were quantified by densitometry. Full-length gels in Supplementary Fig. S5. Data are presented as means ± SD, independent comparisons were made by two-tailed Student’s unpaired t-tests. No statistically significant differences were observed.

Similar articles

Cited by

References

    1. Ho KKL, Pinsky JL, Kannel WB, Levy D. The epidemiology of heart failure: The Framingham Study. J. Am. Coll. Cardiol. 1993;22:2. - PubMed
    1. Houser SR, et al. Animal models of heart failure. Circ. Res. 2012 doi: 10.1161/res.0b013e3182582523. - DOI - PubMed
    1. Rytand DA. The renal factor in arterial hypertension with coarctation of the aorta 1. J. Clin. Invest. 1938;17:391–399. - PMC - PubMed
    1. Goldblatt H, Kahn JR, Hanzal RF. Studies on experimental hypertension ix. The effect on blood pressure ol constriction of the abdominal aorta above and below the site of origin of borr main renal arteries. J. Exp. Med. 1939;69:649–674. - PMC - PubMed
    1. Hasenfuss G. Animal models of human cardiovascular disease, heart failure and hypertrophy. Cardiovasc. Res. 1998;39:60–76. - PubMed

Publication types

MeSH terms