. 2021 Jan;101(1):70-88.
doi: 10.1038/s41374-020-00485-2. Epub 2020 Sep 18.

Ascorbate-induced oxidative stress mediates TRP channel activation and cytotoxicity in human etoposide-sensitive and -resistant retinoblastoma cells

Affiliations

Ascorbate-induced oxidative stress mediates TRP channel activation and cytotoxicity in human etoposide-sensitive and -resistant retinoblastoma cells

Jakub Oronowicz et al. Lab Invest. 2021 Jan.

Erratum in

Abstract

There are indications that pharmacological doses of ascorbate (Asc) used as an adjuvant improve the chemotherapeutic management of cancer. This favorable outcome stems from its cytotoxic effects due to prooxidative mechanisms. Since regulation of intracellular Ca2+ levels contributes to the maintenance of cell viability, we hypothesized that one of the effects of Asc includes disrupting regulation of intracellular Ca2+ homeostasis. Accordingly, we determined if Asc induced intracellular Ca2+ influx through activation of pertussis sensitive Gi/o-coupled GPCR which in turn activated transient receptor potential (TRP) channels in both etoposide-resistant and -sensitive retinoblastoma (WERI-Rb1) tumor cells. Ca2+ imaging, whole-cell patch-clamping, and quantitative real-time PCR (qRT-PCR) were performed in parallel with measurements of RB cell survival using Trypan Blue cell dye exclusion. TRPM7 gene expression levels were similar in both cell lines whereas TRPV1, TRPM2, TRPA1, TRPC5, TRPV4, and TRPM8 gene expression levels were downregulated in the etoposide-resistant WERI-Rb1 cells. In the presence of extracellular Ca2+, 1 mM Asc induced larger intracellular Ca2+ transients in the etoposide-resistant WERI-Rb1 than in their etoposide-sensitive counterpart. With either 100 µM CPZ, 500 µM La3+, 10 mM NAC, or 100 µM 2-APB, these Ca2+ transients were markedly diminished. These inhibitors also had corresponding inhibitory effects on Asc-induced rises in whole-cell currents. Pertussis toxin (PTX) preincubation blocked rises in Ca2+ influx. Microscopic analyses showed that after 4 days of exposure to 1 mM Asc cell viability fell by nearly 100% in both RB cell lines. Taken together, one of the effects underlying oxidative mediated Asc-induced WERI-Rb1 cytotoxicity stems from its promotion of Gi/o coupled GPCR mediated increases in intracellular Ca2+ influx through TRP channels. Therefore, designing drugs targeting TRP channel modulation may be a viable approach to increase the efficacy of chemotherapeutic treatment of RB. Furthermore, Asc may be indicated as a possible supportive agent in anti-cancer therapies.


Conflict of interest statement

The authors declare that the research was conducted in the absence of any commercial or financial relationships that could be construed as a potential conflict of interest.

Figures

Fig. 1
Fig. 1. Microscopic images of RB cells.
a Light microscopic image of etoposide-resistant WERI-Rb1 cells. b Fluorescence microscopic image (510 nm; red colored by imaging software) showing single etoposide-resistant WERI-Rb1 cells on a poly-L-lysine coated coverslip. The circumscribed zones point out some single cells that are regions of interest (ROIs) for fluorescence measurements. c Fluorescence microscopic image (510 nm) shows cells growing in chains. d Light microscopic view of a single-cell suspension prepared for patch-clamp recordings.
Fig. 2
Fig. 2. Analyses of relative TRP mRNA expression by qRT-PCR.
Expression of TRPs was observed in etoposide-sensitive and -resistant WERI-Rb1 cells. Both cell lines show a comparable TRPM7 mRNA expression. In contrast, TRPA1, TRPC5, TRPM2, TRPM8, TRPV1, and TRPV4 mRNA levels were significantly downregulated in etoposide-resistant in comparison to the -sensitive WERI-Rb1 cells. Data are shown as median±quartile±minimum/maximum (n = 6).
Fig. 3
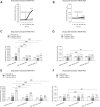
Fig. 3. 1mM Asc induces an increase in intracellular Ca2+ influx in both RB cell lines. TRP-channel antagonists (CPZ, La3+, NAC, and 2-APB) suppress Asc-induced Ca2+ influx.
a 1 mM Asc led to an increase in intracellular Ca2+ influx (n = 91) in etoposide-resistant WERI-Rb1 cells, whereas non-treated control cells maintained a constant Ca2+ baseline (n = 26). b The same experiment as shown in (a) but carried out with etoposide-sensitive WERI-Rb1 cells. c Summary of the experiments with 1 mM Asc and TRP-channel antagonists (100 µM CPZ, 500 µM La3+) in etoposide-resistant WERI-Rb1 cells. The asterisks (*) designate a significant increase in fluorescence ratios (f340/380) in the groups of cells with and without TRP-channel antagonists after addition of Asc to the medium (paired tested). The hashtags (#) indicate significant differences in fluorescence ratios (f340/380) (unpaired tested). d Summary of the same experiments as in (c) but with etoposide-sensitive WERI-Rb1 cells. e Summary of the experiments with 1 mM Asc and TRP-channel antagonists (10 mM NAC and 100 µM 2-APB) in etoposide-resistant WERI-Rb1 cells. The asterisks (*) designate a significant increase in fluorescence ratios (f340/380) in the groups of cells with and without TRP-channel antagonists after addition of Asc to the medium (paired tested). The hashtags (#) indicate significant differences in fluorescence ratios (f340/380) (unpaired tested). f Summary of the same experiments as in (e) but with etoposide-sensitive WERI-Rb1 cells (unpaired tested only at t = 300 s). Asc Ascorbic acid, CPZ Capsazepine, La3+ Lanthanum-III-chloride, NAC N-acetylcysteine, 2-APB 2-aminoethyl diphenylborinate.
Fig. 4
Fig. 4. PTX suppresses Asc-induced Ca2+ influx in both RB cell lines.
a Mean trace of etoposide-resistant WERI-Rb1 cells after addition of 1 mM Asc to the medium bathing cells pretreated with 50 ng/ml PTX (n = 107) for 18 h. b Mean trace of etoposide-sensitive WERI-Rb1 cells after addition of 1 mM Asc to the medium bathing cells pretreated with 50 ng/ml PTX (n = 39). c Summary of Asc experiments in the presence of PTX in etoposide-sensitive and -resistant WERI-Rb1 cells. The asterisks (*) designate a significant increase in fluorescence ratios (f340/380) after addition of Asc to the medium bathing each group of cells (paired tested) (t = 300 s). The hashtag (#) indicates a significant difference in fluorescence ratios (f340/380) between both RB cell lines (unpaired tested). PTX Pertussis toxin.
Fig. 5
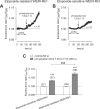
Fig. 5. Asc-induced intracellular Ca2+ increase depends on extracellular Ca2+ in the bathing medium.
a Substitution of Ca2+ containing medium with Ca2+-free solution led to a slight decrease of intracellular Ca2+ level in etoposide-resistant WERI-Rb1 cells (n = 11). Notable, addition of 1 mM Asc failed to increase the intracellular Ca2+ concentration as it took place in the presence of extracellular Ca2+. b The same experiment as shown in (a), but carried out with etoposide-sensitive WERI-Rb1 cells (n = 12).
Fig. 6
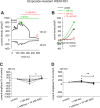
Fig. 6. 1mM Asc induces increases in whole-cell currents in both etoposide-resistant and -sensitive WERI-Rb1 cells.
a Summary of patch-clamp experiments with Asc in etoposide-resistant WERI-Rb1 cells (n = 16). The asterisks (*) indicate statistically significant increase in whole-cell currents after application of 1 mM Asc (paired tested). b Same summary as in (a) except etoposide-sensitive WERI-Rb1 cells are instead analyzed (n = 19). Asc Ascorbic acid.
Fig. 7
Fig. 7. NAC blocks the Asc-induced increase in whole-cell currents in etoposide-resistant WERI-Rb1 cells.
a Time course recording of the currents increase induced by 1 mM Asc and currents decrease after application of 10 mM NAC. b Original traces of Asc-induced current responses to voltage ramps [current/voltage plot (I-V plot)]. Current densities are shown as a control without drugs (black trace labeled as A), during application of 1 mM Asc (green trace labeled as B) and after addition of 10 mM NAC (red trace labeled as C). Calculated current densities obtained by normalizing currents to membrane capacitance as function of imposed voltage were derived from the traces shown in (a). c Maximal negative inward current amplitudes induced by a voltage step from 0 mV to −60 mV, shown in percent of control values before application of drugs (control set to 100%). The asterisks (*) designate a significant increase in inward currents after application of 1 mM Asc and a significant suppression of inward currents after addition of 10 mM NAC (paired tested). d Same diagram but related to maximal outward current amplitudes induced by a voltage step from 0 mV to +130 mV. Asc Ascorbic acid, NAC N-acetylcysteine.
Fig. 8
Fig. 8. NAC blocks the Asc-induced increase in whole-cell currents in etoposide-sensitive WERI-Rb1 cells.
a Time course recording of the currents increase induced by 1 mM Asc and currents decrease after application of 10 mM NAC. b Original traces of Asc-induced current responses to voltage ramps [current/voltage plot (I-V plot)]. Current densities are shown as a control without drugs (black trace labeled as A), during application of 1 mM Asc (green trace labeled as B) and after addition of 10 mM NAC (red trace labeled as C). Calculated current densities obtained by normalizing currents to membrane capacitance as function of imposed voltage were derived from the traces shown in (a). c Maximal negative inward current amplitudes induced by a voltage step from 0 mV to -60 mV, shown in percent of control values before application of drugs (control set to 100%). The asterisks (*) designate a significant increase in inward currents after application of 1 mM Asc and a significant suppression of inward currents after addition of 10 mM NAC (paired tested). d Same diagram but related to maximal outward current amplitudes induced by a voltage step from 0 mV to +130 mV. Asc Ascorbic acid, NAC N-acetylcysteine.
Fig. 9
Fig. 9. TRP antagonists (CPZ, LA3+, NAC) can block Asc-induced increase in whole-cell currents in both etoposide-resistant and -sensitive WERI-Rb1 cells.
a Original traces of Asc-induced current responses to voltage ramps [current/voltage plot (I-V plot)] in etoposide-resistant WERI-Rb1 cells. Current densities are shown as a control without drugs (labeled as A), during application of 1 mM Asc (labeled as B) and after addition of 100 µM CPZ (labeled as C). b The same experiment as in (a), but with 500 µM La3+ in etoposide-resistant WERI-Rb1 cells. c Same experiment as in (a) but with etoposide-sensitive WERI-Rb1 cells. d Same experiment as in (b) but with etoposide-sensitive WERI-Rb1 cells. e Summary of patch-clamp experiments with Asc and TRP-channel antagonists (CPZ, La3+, NAC) in etoposide-resistant WERI-Rb1. The asterisks (*) indicate a significant increase in whole-cell currents after application of 1 mM Asc (paired tested). The hashtags (#) designate significant decreases in whole-cell currents after adding TRP-channel antagonists (100 µM CPZ, 500 µM La3+, 10 mM NAC) (unpaired tested). ns not significant (unpaired tested). f Same summary as in (e) but concerning etoposide-sensitive WERI-Rb1 cells. Asc Ascorbic acid, CPZ Capsazepine, La3+ Lanthanum-III-chloride, NAC N-acetylcysteine.
Fig. 10
Fig. 10. Medium acidification has less influence on Ca2+ regulation.
a Mean trace of etoposide-resistant WERI-Rb1 cells under pH reduction (i.e., from 7.35 to 7.15) (n = 39). b Mean trace of etoposide-sensitive WERI-Rb1 cells under pH reduction (i.e., from 7.35 to 7.15) (n = 37). c Summary of pH reduction experiments compared to control values of etoposide-sensitive and -resistant WERI-Rb1 cells. pH reduction induced larger Ca2+ influx in etoposide-resistant WERI-Rb1 cells. The asterisks (*) designate a significant increase in fluorescence ratios (f340/380) after pH reduction in each group of cells (paired tested) (t = 300 s). The hashtags (#) indicate significant differences in fluorescence ratios (f340/380) between both RB cell lines (unpaired tested).
Fig. 11
Fig. 11. Effects of exposure to Asc on RB cell viability (a–e—etoposide-resistant WERI-Rb1 cells; f–j—etoposide-sensitive WERI-Rb1 cells).
a Microscopic image of freshly diluted cells on the first day. Subsequently, 1 mM Asc was added. b The same cells as shown in (a), but on the fifth day after Asc treatment. A clear reduction of cell density is visible. Subsequently, medium dilution with fresh RPMI-1640 medium. c The same cells as in (a) and (b), but 2 days after adding fresh RPMI-1640 medium. The cell density again increased. d Microscopic image showing etoposide-resistant WERI-Rb1 cells which were maintained for 4 days in culture. At this time, 1 mM Asc was added. e The same cells as in (d), but on the fifth day after Asc treatment. The cell density declined. f–j The same experimental design as that shown in (ae), but etoposide-sensitive WERI-Rb1 cells were used. Similar to the etoposide-resistant WERI-Rb1 cells, cell density declined after Asc treatment and recovered after diluting the medium.
Fig. 12
Fig. 12. 1mM Asc suppresses RB cell viability.
Trypan Blue dye exclusion capability is compared between control and Asc-exposed WERI-Rb1 cells, on the fifth day after Asc treatment. In the background, is shown the cell counting chamber divided into square fields. a Light microscopic image of etoposide-resistant WERI-Rb1 cells. Most cells are viable (e.g., marked with a red arrow)—excluded the Trypan Blue dye. b The same group of cells as in (a), but exposed to 1 mM Asc. Most cells are dead (e.g., marked with a red arrow)—Trypan Blue dye stains cell interior. c, d These panels show the same conditions as in (ab) except that a group of etoposide-sensitive WERI-Rb1 cells are shown instead.
Fig. 13
Fig. 13. Schematic illustration of PTX effect on TRP channel.
GPCRs (blue) and TRP channels (green) are often co-expressed in cells. It is accepted that activation of GPCRs modify the function of TRPs [37]. a Asc was reported as a modulator of aminergic GPCRs [68] and thereby might enhance the constitutive activity of these receptors. Therefore, downstream signaling effects might stimulate the activity of TRPs. b PTX is known to ADP-ribosylation of Gi/o proteins [71] that result in their inaction, thus reduce the activity of TRPs. Asc Ascorbic acid, PTX Pertussis toxin.

Similar articles

Cited by

References

    1. Dimaras H, Corson TW. Retinoblastoma, the visible CNS tumor: a review. J Neurosci Res. 2019;97:29–44. - PMC - PubMed
    1. Lohmann D, Gallie B, Dommering C, Gauthier-Villars M. Clinical utility gene card for: retinoblastoma. Eur J Hum Genet. 2011;19. 10.1038/ejhg.2010.200. - PMC - PubMed
    1. Dimaras H, Corson TW, Cobrinik D, White A, Zhao J, Munier FL, et al. Retinoblastoma. Nat Rev Dis Primers. 2015;1:15021. - PMC - PubMed
    1. Naseripour M. “Retinoblastoma survival disparity”: the expanding horizon in developing countries. Saudi J Ophthalmol. 2012;26:157–61. - PMC - PubMed
    1. Control UfIC. RETINOBLASTOMA. review of cancer medicines on the WHO list of essential medicines. WHO; 2014.https://www.who.int/selection_medicines/committees/expert/20/application....

Publication types

MeSH terms