. 2020 Sep 18;10(1):15349.
doi: 10.1038/s41598-020-72349-0.

Biogeochemical water type influences community composition, species richness, and biomass in megadiverse Amazonian fish assemblages

Affiliations

Biogeochemical water type influences community composition, species richness, and biomass in megadiverse Amazonian fish assemblages

Juan David Bogotá-Gregory et al. Sci Rep. .

Abstract

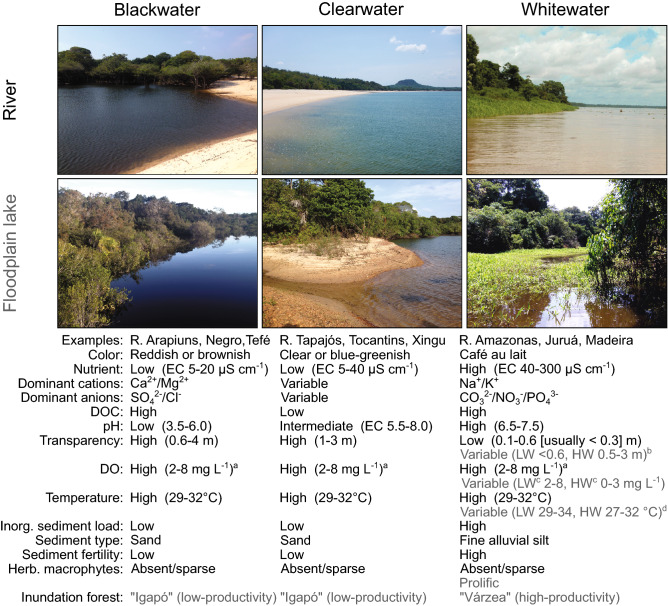
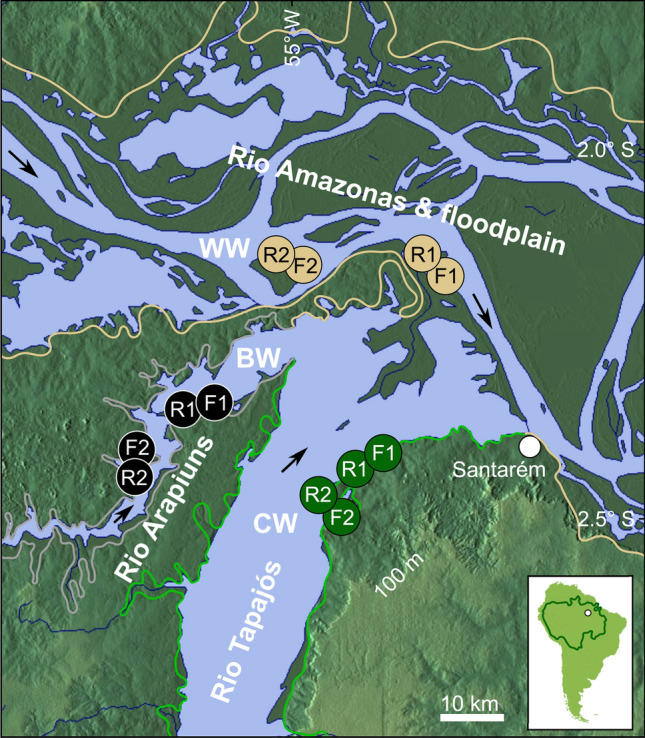
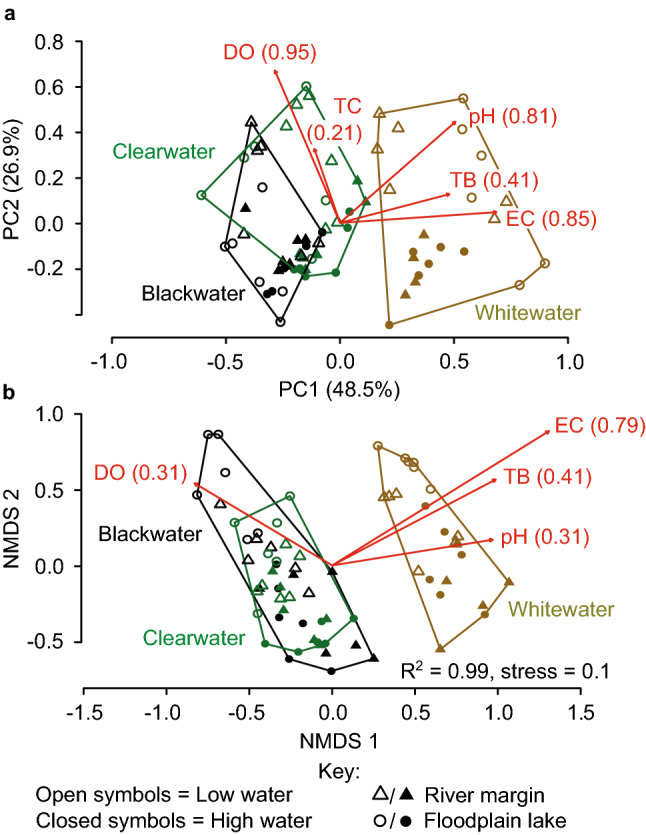
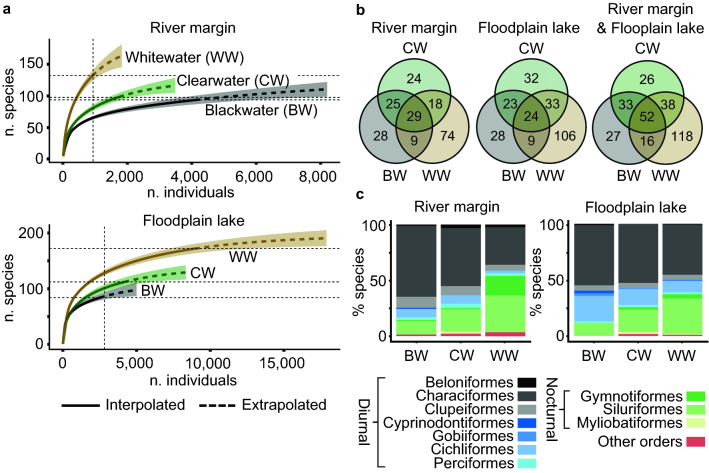
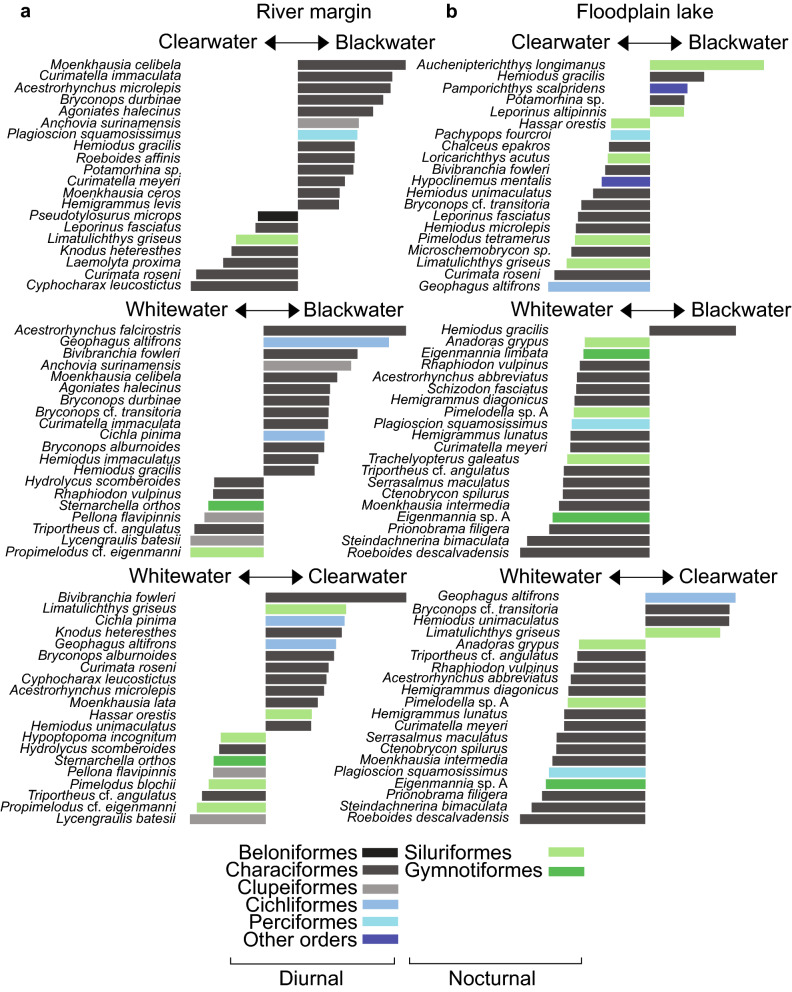
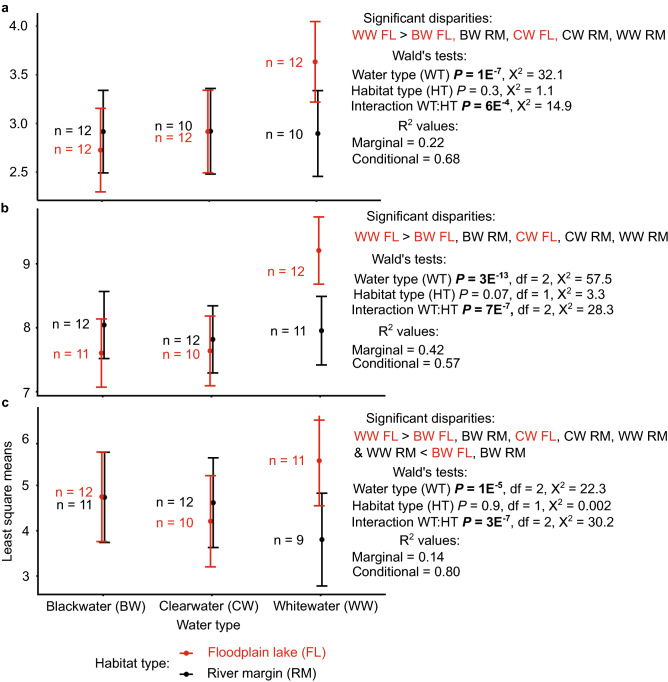
Amazonian waters are classified into three biogeochemical categories by dissolved nutrient content, sediment type, transparency, and acidity-all important predictors of autochthonous and allochthonous primary production (PP): (1) nutrient-poor, low-sediment, high-transparency, humic-stained, acidic blackwaters; (2) nutrient-poor, low-sediment, high-transparency, neutral clearwaters; (3) nutrient-rich, low-transparency, alluvial sediment-laden, neutral whitewaters. The classification, first proposed by Alfred Russel Wallace in 1853, is well supported but its effects on fish are poorly understood. To investigate how Amazonian fish community composition and species richness are influenced by water type, we conducted quantitative year-round sampling of floodplain lake and river-margin habitats at a locality where all three water types co-occur. We sampled 22,398 fish from 310 species. Community composition was influenced more by water type than habitat. Whitewater communities were distinct from those of blackwaters and clearwaters, with community structure correlated strongly to conductivity and turbidity. Mean per-sampling event species richness and biomass were significantly higher in nutrient-rich whitewater floodplain lakes than in oligotrophic blackwater and clearwater river-floodplain systems and light-limited whitewater rivers. Our study provides novel insights into the influences of biogeochemical water type and ecosystem productivity on Earth's most diverse aquatic vertebrate fauna and highlights the importance of including multiple water types in conservation planning.


Conflict of interest statement

The authors declare no competing interests.

Figures

Figure 1
Figure 1
The Wallace classification of Amazonian rivers, with typical ranges of physico-chemical properties. Values for floodplain lakes (gray text) are given only where they typically differ from parent rivers. Ranges follow Junk et al., Crampton and Appendix S4 online. EC conductivity, DOC dissolved organic carbon, LW/HW low/high water, DO dissolved oxygen, Inorg. Inorganic, Herb. herbaceous. aPeriodic phytoplankton (including cyanobacteria) blooms induce DO supersaturation (ca. 8–15 mg L−1) and tint clearwater green. bPrecipitation of suspended silt due to reduced flow in WW floodplain lakes substantially increases transparency relative to parent WW river. cHW hypoxia results from litter decomposition in inundation forests; this effect is greater in large WW floodplains. dShallow WW lakes reach extreme high LW temperature. Photographs are of the R. Arapiuns (blackwater), Tapajós (clearwater) and Amazonas (whitewater) near Santarém, Brazil.
Figure 2
Figure 2
Map of the study area near Santarém, Brazil, with locations of the three sampled water types (blackwater BW, clearwater CW, whitewater WW) and two sampled habitat types (river margin R, floodplain lake F). Solid lines represent boundaries of seasonal floodplains. Arrows indicate river flow. Dark green line in inset map of South America demarcates Amazon river drainage. Sampling was conducted through a full annual hydrological cycle, every two months, at two site replicates (labeled 1 and 2) representing each of the six combinations of water type and habitat type. This yielded a planned total of 72 sample events, one of which was missed due to bad weather, leaving 71. Base map from MFF-maps (https://maps-for-free.com) modified with Inkscape version 0.92 (www.inkscape.org).
Figure 3
Figure 3
Multivariate analyses of physico-chemical water properties and fish assemblage structure in the study area. (a) Principal component analysis of physico-chemical properties measured at 71 sampling events through a complete annual hydrological cycle. (b) Nonmetric multidimensional scaling ordination based on fish assemblage structure at the same 71 sampling events. Red arrows represent environmental vectors significant at α = 0.05, with R2 values. DO dissolved oxygen, EC conductivity, TB turbidity, TC temperature.
Figure 4
Figure 4
Patterns of fish species richness and taxonomic composition among the three water types and two habitat types of the study area. (a) Rarefaction curves; see Supplementary Figs. S4 and S5 online for similar patterns in rarefaction curves divided by site replicate and by gear type, respectively. (b) Species occupancy Venn diagrams per habitat type, reporting number of exclusive and shared species; see Supplementary Fig. S6 online for similar patterns in Venn Diagrams restricted to single site replicates. (c) Habitat specialization (% species occurrences per habitat type); Other Orders are Osteoglossiformes, Tetraodontiformes, Pleuronectiformes, Synbranchiformes, and Ceratodontiformes. Orders are assigned to predominantly diurnal or nocturnal activity following the literature cited in Supplementary Appendix S5 online.
Figure 5
Figure 5
Contributions of the 20 most influential species to the differences in assemblage structure between water types, based on PERMANOVA coefficients. Length of bars represent the magnitude of contribution to difference between each pairwise combination of water type.
Figure 6
Figure 6
Generalized linear mixed-effect models for the effects of water type and habitat type on: (a) species richness, (b) biomass, and (c) abundance. Plots show least square means for the fixed effects (water type, habitat) with 95% confidence intervals. Disparities are reported where significant at α = 0.05 by Tukey post-hoc test (see Supplementary Table S5 online for model details). Sample sizes (n) refer to sampling events. Here outlier sampling events (reported in Supplementary Fig. S7 online) were excluded, hence variation in sample sizes between models.

References

    1. Fricke, R., Eschmeyer, W. N. & van der Laan, R. Eschmeyer's catalog of fishes: genera, species, references (https://researcharchive.calacademy.org/research/ichthyology/catalog/fish...) (Electronic version accessed 01 December 2019) (2019).
    1. Crampton, W. G. R. in Historical biogeography of neotropical freshwater fishes (eds J. S. Albert & R. E. Reis) 165–189 (University of California Press, California, 2011).
    1. Dagosta FCP, de Pinna M. The fishes of the Amazon: Distribution and biogeographical patterns, with a comprehensive list of species. Bull. Am. Mus. Nat. Hist. N. Y. 2019;1–163:2019. doi: 10.1206/0003-0090.431.1.1. - DOI
    1. Reis RE, et al. Fish biodiversity and conservation in South America. J. Fish Biol. 2016;89:12–47. doi: 10.1111/jfb.13016. - DOI - PubMed
    1. Albert JS, Reis RE. Historical Biogeography of Neotropical Freshwater Fishes. Berkeley: University of California Press; 2011.

Publication types