

Ultrasensitive high-resolution profiling of early seroconversion in patients with COVID-19
- PMID: 32948854
- PMCID: PMC7498988
- DOI: 10.1038/s41551-020-00611-x
Ultrasensitive high-resolution profiling of early seroconversion in patients with COVID-19
Abstract
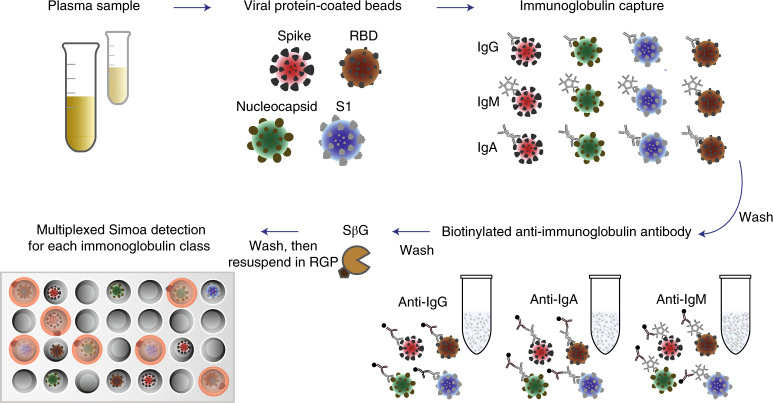
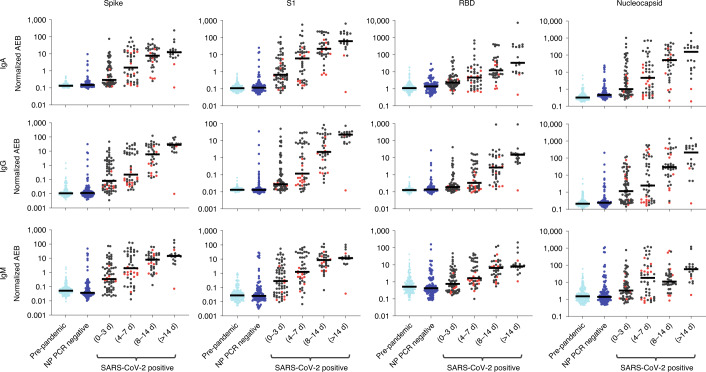
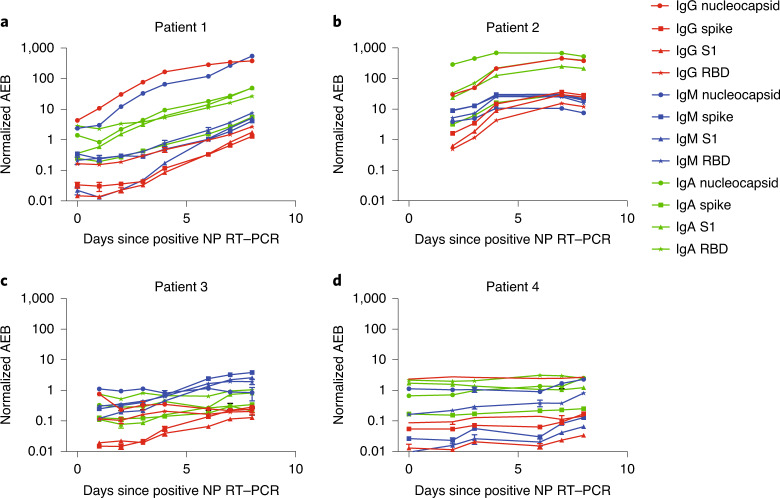
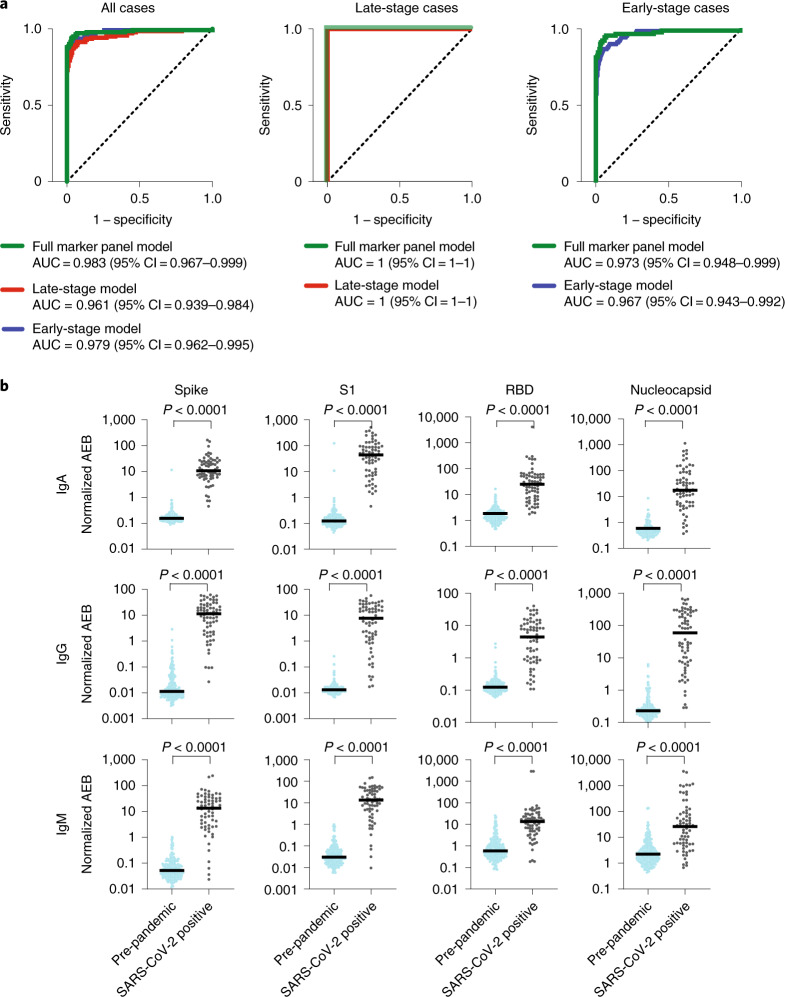
Sensitive assays are essential for the accurate identification of individuals infected with severe acute respiratory syndrome coronavirus 2 (SARS-CoV-2). Here, we report a multiplexed assay for the fluorescence-based detection of seroconversion in infected individuals from less than 1 µl of blood, and as early as the day of the first positive nucleic acid test after symptom onset. The assay uses dye-encoded antigen-coated beads to quantify the levels of immunoglobulin G (IgG), IgM and IgA antibodies against four SARS-CoV-2 antigens. A logistic regression model trained using samples collected during the pandemic and samples collected from healthy individuals and patients with respiratory infections before the first outbreak of coronavirus disease 2019 (COVID-19) was 99% accurate in the detection of seroconversion in a blinded validation cohort of samples collected before the pandemic and from patients with COVID-19 five or more days after a positive nasopharyngeal test by PCR with reverse transcription. The high-throughput serological profiling of patients with COVID-19 allows for the interrogation of interactions between antibody isotypes and viral proteins, and should help us to understand the heterogeneity of clinical presentations.
Conflict of interest statement
D.R.W. has a financial interest in Quanterix Corporation, a company that develops an ultra-sensitive digital immunoassay platform. He is an inventor of the Simoa technology and a founder of the company and also serves on its Board of Directors. D.R.W.’s interests were reviewed and are managed by Brigham and Women’s Hospital and Partners HealthCare in accordance with their policies on competing interests. The assays in this publication have been licensed by Brigham and Women’s Hospital to Quanterix Corporation. M.N., T.G., A.F.O., A.M.M. and D.R.W. have filed intellectual property on the technology described in this manuscript. L.C., E.L.B., R.L., C.-P.M., Y.C., J.Z., J.E.F., B.M.H., T.M.C., B.C., A.G.S., G.A., R.C.C. and E.T.R. declare no competing interests.
Figures
References
-
- Cascella, M., Rajnik, M., Cuomo, A., Dulebohn, S. C. & Di Napoli, R. Features, Evaluation, and Treatment of Coronavirus (COVID-19) (StatPearls, 2020). - PubMed
-
- Liu, R. et al. The comparative superiority of IgM-IgG antibody test to real-time reverse transcriptase PCR detection for SARS-CoV-2 infection diagnosis. Preprint at https://www.medrxiv.org/content/10.1101/2020.03.28.20045765v1 (2020). - DOI
Publication types
MeSH terms
Substances
Grants and funding
- T32 HL007627/HL/NHLBI NIH HHS/United States
- T32 AI007245/AI/NIAID NIH HHS/United States
- T32 GM007753/GM/NIGMS NIH HHS/United States
- R01 AI146779/AI/NIAID NIH HHS/United States
- U01 CK000490/CK/NCEZID CDC HHS/United States
- R01AI146779/Division of Intramural Research, National Institute of Allergy and Infectious Diseases (Division of Intramural Research of the NIAID)/International
- T32GM007753/U.S. Department of Health & Human Services | NIH | National Institute of General Medical Sciences (NIGMS)/International
- U01CK000490/ACL/ACL HHS/United States
- T32 GM008313/GM/NIGMS NIH HHS/United States
LinkOut - more resources
Full Text Sources
Other Literature Sources
Medical
Miscellaneous
