. 2020 Dec;4(12):1168-1179.
doi: 10.1038/s41551-020-00617-5. Epub 2020 Sep 18.

Sensitive fluorescence detection of SARS-CoV-2 RNA in clinical samples via one-pot isothermal ligation and transcription

Affiliations

Sensitive fluorescence detection of SARS-CoV-2 RNA in clinical samples via one-pot isothermal ligation and transcription

Chang Ha Woo et al. Nat Biomed Eng. 2020 Dec.

Abstract

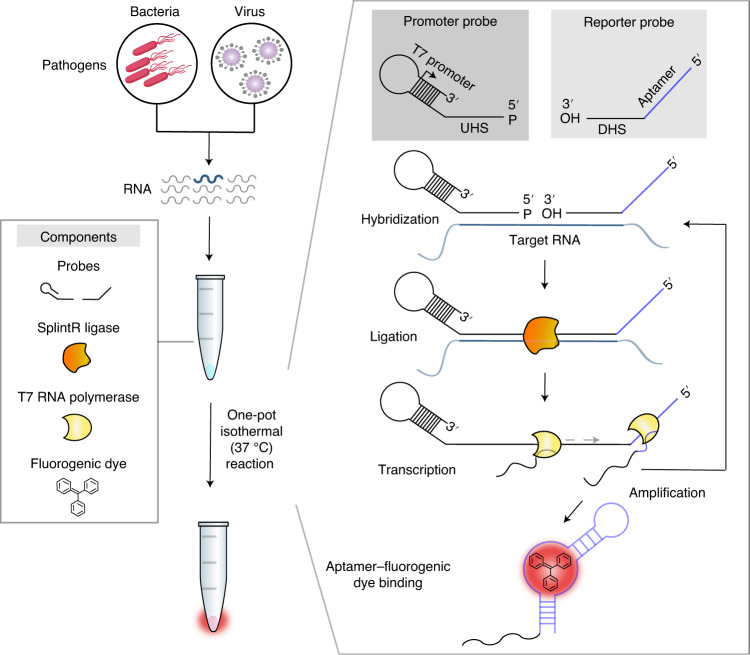
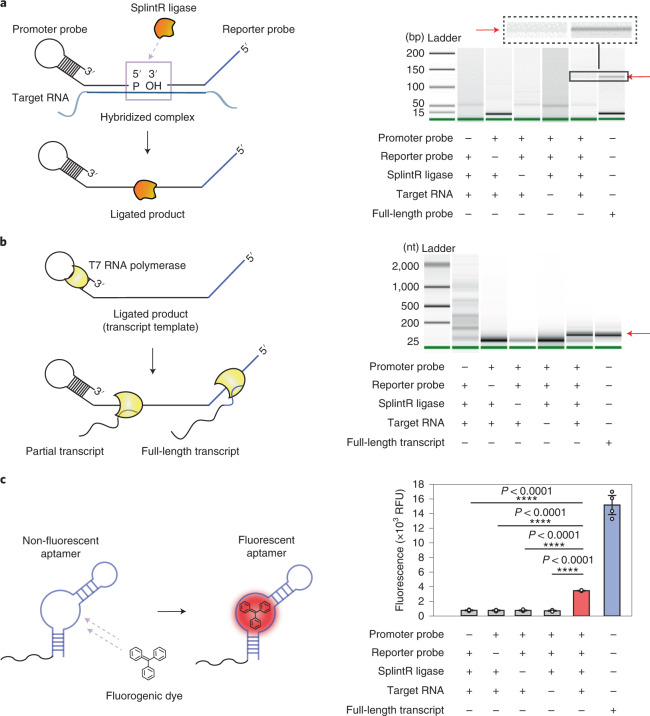
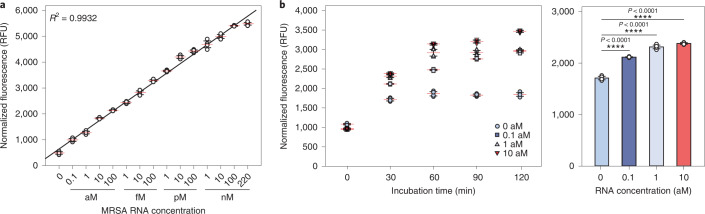
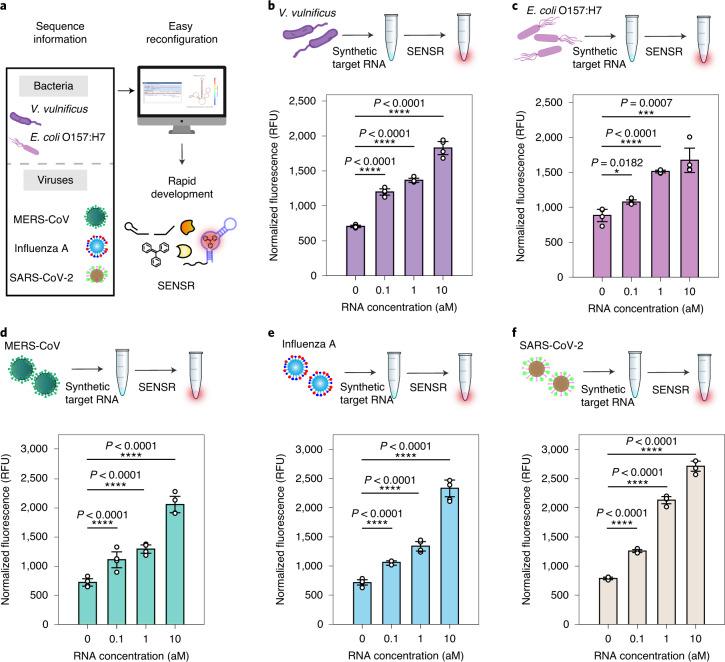
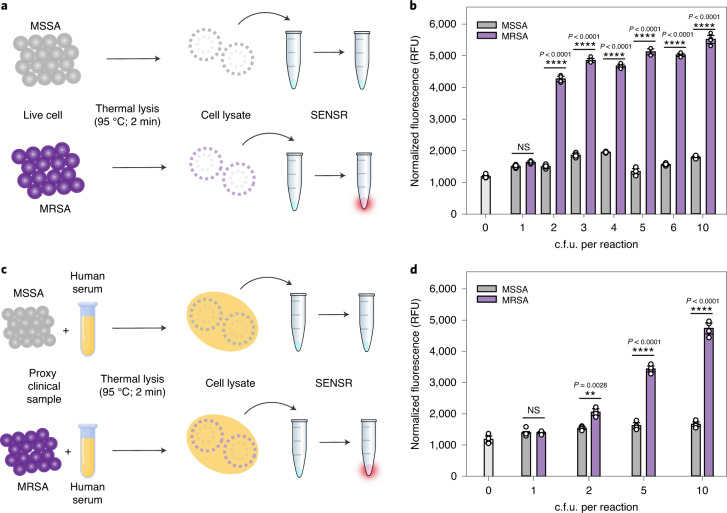
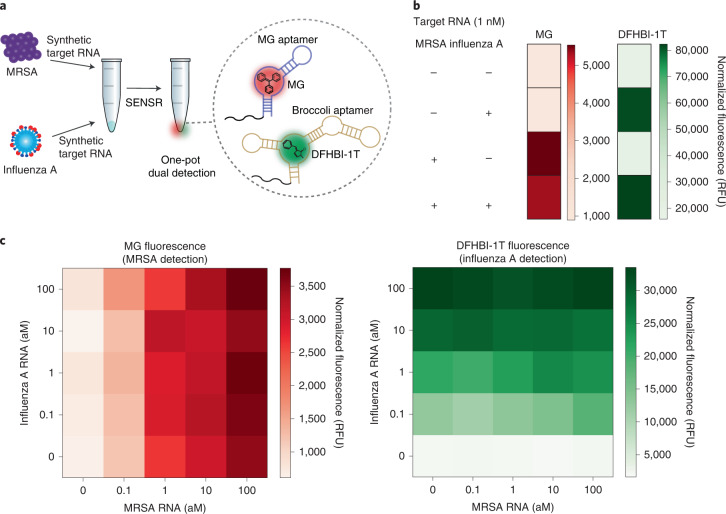
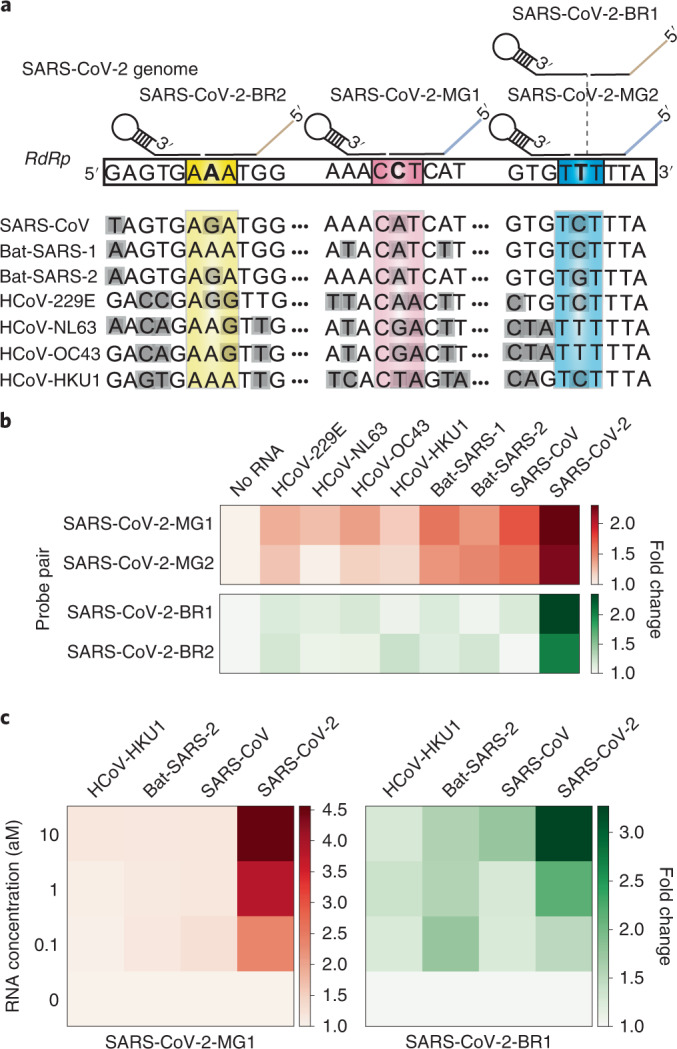
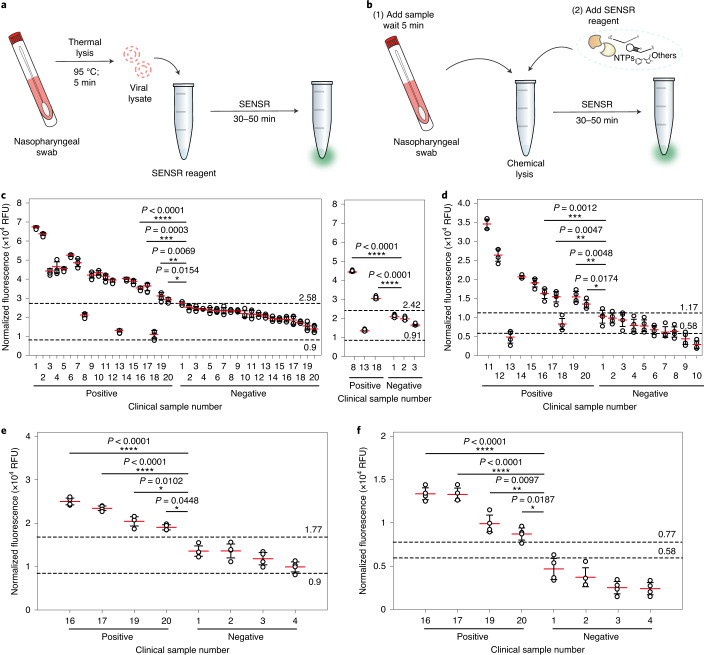
The control of viral outbreaks requires nucleic acid diagnostic tests that are sensitive, simple and fast. Here, we report a highly sensitive and specific one-pot assay for the fluorescence-based detection of RNA from pathogens. The assay, which can be performed within 30-50 min of incubation time and can reach a limit of detection of 0.1-attomolar RNA concentration, relies on a sustained isothermal reaction cascade producing an RNA aptamer that binds to a fluorogenic dye. The RNA aptamer is transcribed by the T7 RNA polymerase from the ligation product of a promoter DNA probe and a reporter DNA probe that hybridize with the target single-stranded RNA sequence via the SplintR ligase (a Chlorella virus DNA ligase). In 40 nasopharyngeal SARS-CoV-2 samples, the assay reached positive and negative predictive values of 95 and 100%, respectively. We also show that the assay can rapidly detect a range of viral and bacterial RNAs.


Conflict of interest statement

Patent applications have been submitted by J.W.L., G.Y.J., C.H.W., S.J. and G.S. based on the results of this study (PCT/KR2020/005331 (Patent Cooperation Treaty) and 10-2020-0048912 (Republic of Korea)).

Figures

Fig. 1
Fig. 1. Schematic of SENSR, a one-pot isothermal reaction cascade for the rapid detection of RNA.
The reaction is composed of four main components: a set of probes, SplintR ligase, T7 RNA polymerase and a fluorogenic dye. In the presence of target RNA, hybridization, ligation, transcription and aptamer–dye binding reactions occur sequentially in a single reaction tube at a constant temperature.
Fig. 2
Fig. 2. Construction of the three component reactions of SENSR.
a, The ligation reaction. The ligation products were amplified with a pair of PCR primers (LigChk_F and LigChk_R in Supplementary Table 7) and analysed using Bioanalyzer. The ligation reaction occurred only when the promoter probe, reporter probe, SplintR ligase and target RNA were all present. A full-length probe combining the promoter and reporter probes was amplified with the same set of PCR primers and used as a size control, as indicated by the red arrow. The full scan of the Bioanalyzer image is provided in Supplementary Fig. 10a. bp, base pairs. b, The transcription reaction. The ligated mixtures were used as a DNA template to validate transcription. The transcript was obtained only in the presence of target RNA and all other components, demonstrating both target-dependent ligation and subsequent transcription. The red arrow points to the correct size of the transcript. The full scan of the Bioanalyzer image is provided in Supplementary Fig. 10b. nt, nucleotides. c, The aptamer–fluorogenic dye binding reaction. After sequential ligation and transcription reactions, the reaction mixture with the correct size of the transcript produced higher fluorescence compared with other conditions that lacked one of the necessary components. Fluorescence tests were performed as four biological replicates (two-tailed Student’s t-test; ****P < 0.0001; bars represent means ± s.d). RFU, relative fluorescence units.
Fig. 3
Fig. 3. Sensitivity and turnaround time of SENSR.
a, Sensitivity of SENSR. The target RNA from 220 nM to 0.1 aM was tested. The detection limit is 0.1 aM (approximately six RNA copies in a 100-μl reaction). High linearity suggests that SENSR can be used for the quantification of target RNA. b, Left: turnaround time of SENSR. To check the time required for the SENSR reaction, the incubation time of SENSR was varied. The target RNA of 0.1 aM was detected as early as 30 min. Right: fluorescence of the 30-min SENSR reaction using target RNA at varying concentrations from 0–10 aM. All of the tests were performed with four biological replicates (two-tailed Student’s t-test; ****P < 0.0001; horizontal lines represent means ± s.d).
Fig. 4
Fig. 4. Broad adaptability of SENSR.
Two pathogenic microbes and three viruses were targeted by redesigning the probe sequences. a, Schematic of SENSR with easy reconfiguration and rapid development. b,c, Detection of bacterial RNA markers for V. vulnificus (b) and E. coli O157:H7 (c). df, Detection of viral RNA markers for MERS-CoV (d), influenza A (e) and SARS-CoV-2 (f). All probe pairs tested showed high sensitivity and linearity to detect RNA markers. The detection limit of 0.1 aM approximately corresponds to six RNA copies in a 100-μl reaction. All tests were performed with four biological replicates (two-tailed Student’s t-test; *P < 0.05; ***P < 0.001; ****P < 0.0001; bars represent means ± s.d).
Fig. 5
Fig. 5. Live cell and proxy clinical sample detection by SENSR.
a, Direct detection of bacterial cells. Thermal cell lysates of MRSA and MSSA were subjected to the SENSR reaction. b, Clear distinction in the fluorescence intensity between MRSA and MSSA samples. The detection limit of SENSR was as low as 2 c.f.u. per 100-µl reaction. c, Detection of bacterial cells diluted in human serum as a proxy clinical sample. Human serum containing bacteria was thermally lysed and subjected to the SENSR reaction. d, An obvious distinction in the fluorescence intensity between human serum containing MRSA and that containing MSSA was observed. The detection limit of SENSR was as low as 2 c.f.u. per 100-µl reaction. All SENSR reactions were run for 2 h. All tests were performed as four biological replicates (two-tailed Student’s t-test; NS, not significant (P > 0.5); **P < 0.01; ****P < 0.0001; bars represent means ± s.d).
Fig. 6
Fig. 6. One-pot dual detection of RNAs by SENSR.
a, One-pot dual detection of MRSA and influenza A. The dual-SENSR mixture contains two orthogonal pairs of probes and fluorogenic dyes with other components. Each probe pair hybridizes to the corresponding target RNA and allows the SENSR reaction to take place, emitting fluorescences that are distinguishable from each other. MG, malachite green. b, Validation of the orthogonal dual-SENSR reaction. The presence of each target RNA (1 nM) was determined by the intensities of non-overlapping fluorescence. c, One-pot dual-SENSR detection of MRSA and influenza A with various concentration combinations. All tests were performed with four biological replicates.
Fig. 7
Fig. 7. Dual detection of SARS-CoV-2 by SENSR.
a, Probe design for dual-SENSR detection. Three regions in the RNA-dependent RNA polymerase (RdRp) gene of SARS-CoV-2 were targeted. Discriminatory bases that enable the specific detection of SARS-CoV-2 against viruses with highly similar sequences are marked by bold letters. Grey shading indicates mismatches between the sequences of SARS-CoV-2 and other viruses. Only several bases around the ligation junction are displayed here. Entire probe-binding sites on the SARS-CoV-2 genome and sequence alignments are shown in Supplementary Fig. 8. b, Singleplex detection of 1 aM SARS-CoV-2 RNA by SENSR. c, One-pot dual detection of SARS-CoV-2 by the orthogonal probe pairs SARS-CoV-2-MG1 and SARS-CoV-2-BR1. All tests were performed with two biological replicates. Fold changes were calculated by dividing the normalized fluorescence values by the value with no target RNA. Bat-SARS-1, bat SARS-related coronavirus 1 (accession code: MG772933); Bat-SARS-2, bat SARS-related coronavirus 2 (accession code: NC_014470); HCoV-229E, human coronavirus 229E; HCoV-HKU1, human coronavirus HKU1; HCoV-NL63, human coronavirus NL63; HCoV-OC43, human coronavirus OC43.
Fig. 8
Fig. 8. SARS-CoV-2 detection from clinical samples by SENSR.
a,b, Schematics of SARS-CoV-2 detection from clinical samples by SENSR. Clinical samples in UTM were treated by either thermal (a, c and e) or chemical lysis (b, d and f) and mixed directly with the SENSR mixture. c,d, SARS-CoV-2 detection from clinical samples. A total of 40 samples (20 positives and 20 negatives; confirmed by rRT–PCR) were tested with the thermal lysis SENSR workflow (c, left). Another probe set (SARS-CoV-2-BR3) predicted two additional positives out of three that were incorrectly predicted as negatives by the thermal lysis SENSR workflow (c, right). Among the samples, a total of 20 (ten positives and ten negatives) were tested using the chemical lysis SENSR workflow (d). Positive samples were numbered according to their Ct values, sorted from lowest to highest (Supplementary Table 6). Negative samples were numbered according to SENSR fluorescence intensity, sorted from highest to lowest. The dashed lines indicate fluorescence intensities from SENSR reactions with reference samples containing one copy of synthetic target RNA (top) or no target RNA (bottom). SENSR reactions were run for 50 min. e,f, Detection of SARS-CoV-2 by 30-min SENSR reaction. Four positive samples with the highest Ct values (the lowest target RNA concentrations) and four negative samples with the highest fluorescence values from 50-min SENSR reactions were tested to validate the feasibility of SENSR to detect SARS-CoV-2 from clinical samples in 30 min. The dashed lines are as in c and d. The clinical and reference sample tests were performed with four biological replicates (two-tailed Student’s t-test for comparison between the results from clinical samples and the results from reference samples with one copy of synthetic target RNA; *P < 0.05, **P < 0.01; ***P < 0.001; ****P < 0.0001; horizontal lines represent means ± s.d).

Comment in

  • Rapid and frequent testing.
    [No authors listed] [No authors listed] Nat Biomed Eng. 2020 Dec;4(12):1121-1122. doi: 10.1038/s41551-020-00670-0. Nat Biomed Eng. 2020. PMID: 33293723 No abstract available.

Similar articles

Cited by

References

    1. Caliendo AM, et al. Better tests, better care: improved diagnostics for infectious diseases. Clin. Infect. Dis. 2013;57:S139–S170. - PMC - PubMed
    1. Rajapaksha P, et al. A review of methods for the detection of pathogenic microorganisms. Analyst. 2019;144:396–411. - PubMed
    1. Sintchenko V, Gallego B. Laboratory-guided detection of disease outbreaks: three generations of surveillance systems. Arch. Pathol. Lab. Med. 2009;133:916–925. - PubMed
    1. O’Connor L, Glynn B. Recent advances in the development of nucleic acid diagnostics. Expert Rev. Med. Devices. 2010;7:529–539. - PubMed
    1. Pavšič J, et al. Standardization of nucleic acid tests for clinical measurements of bacteria and viruses. J. Clin. Microbiol. 2015;53:2008–2014. - PMC - PubMed

Publication types