

Mig1 localization exhibits biphasic behavior which is controlled by both metabolic and regulatory roles of the sugar kinases
- PMID: 32948893
- PMCID: PMC7524853
- DOI: 10.1007/s00438-020-01715-4
Mig1 localization exhibits biphasic behavior which is controlled by both metabolic and regulatory roles of the sugar kinases
Abstract
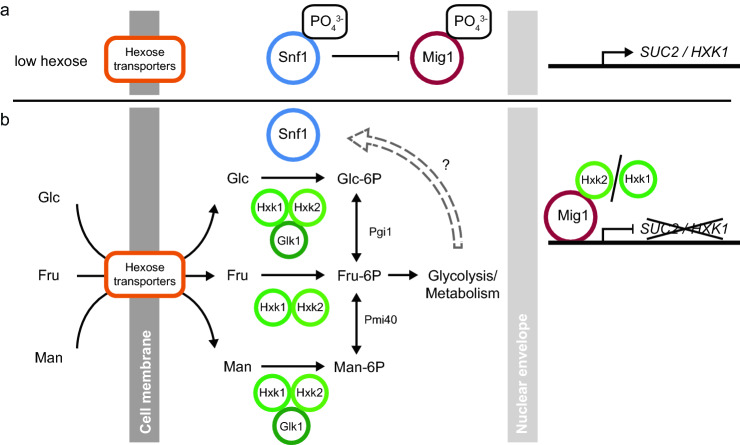
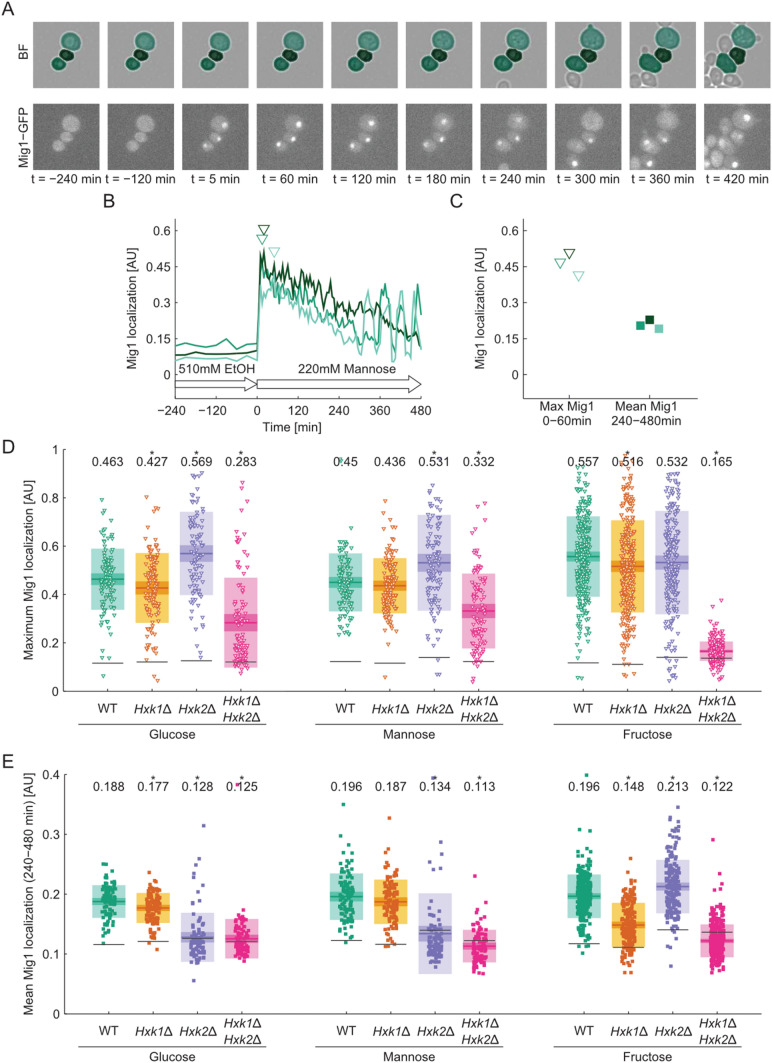
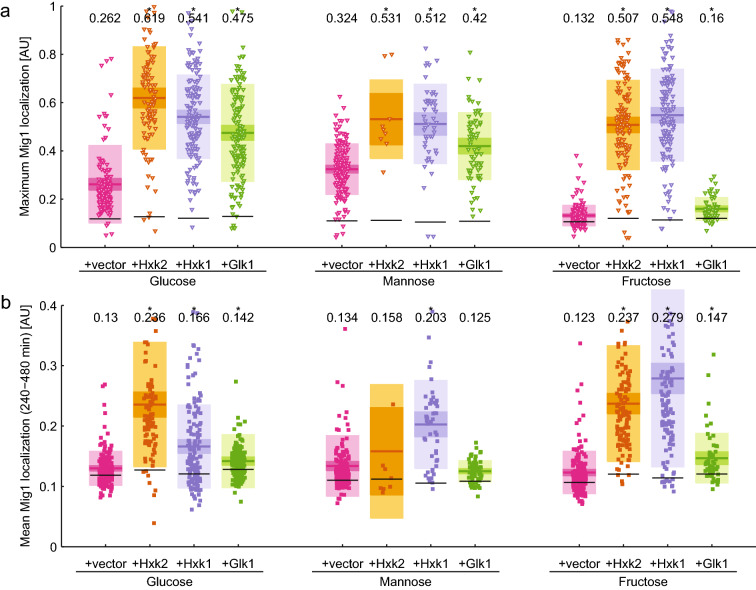
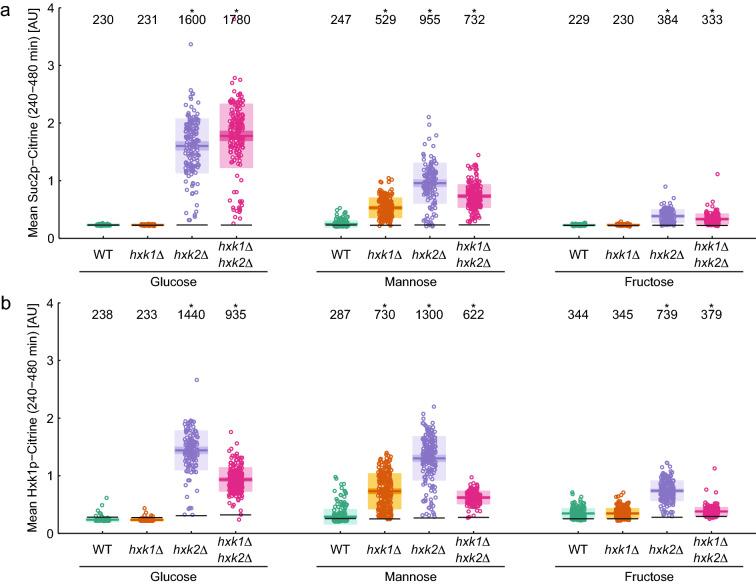
Glucose, fructose and mannose are the preferred carbon/energy sources for the yeast Saccharomyces cerevisiae. Absence of preferred energy sources activates glucose derepression, which is regulated by the kinase Snf1. Snf1 phosphorylates the transcriptional repressor Mig1, which results in its exit from the nucleus and subsequent derepression of genes. In contrast, Snf1 is inactive when preferred carbon sources are available, which leads to dephosphorylation of Mig1 and its translocation to the nucleus where Mig1 acts as a transcription repressor. Here we revisit the role of the three hexose kinases, Hxk1, Hxk2 and Glk1, in glucose de/repression. We demonstrate that all three sugar kinases initially affect Mig1 nuclear localization upon addition of glucose, fructose and mannose. This initial import of Mig1 into the nucleus was temporary; for continuous nucleocytoplasmic shuttling of Mig1, Hxk2 is required in the presence of glucose and mannose and in the presence of fructose Hxk2 or Hxk1 is required. Our data suggest that Mig1 import following exposure to preferred energy sources is controlled via two different pathways, where (1) the initial import is regulated by signals derived from metabolism and (2) continuous shuttling is regulated by the Hxk2 and Hxk1 proteins. Mig1 nucleocytoplasmic shuttling appears to be important for the maintenance of the repressed state in which Hxk1/2 seems to play an essential role.
Keywords: Glucose repression; Hexokinase; Hexose; Localization; Microfluidic; Mig1; Oscillation; Yeast.
Conflict of interest statement
The authors declare that they have no conflicts of interest with the contents of this article.
Figures
Similar articles
-
Hxk2 regulates the phosphorylation state of Mig1 and therefore its nucleocytoplasmic distribution.J Biol Chem. 2007 Feb 16;282(7):4485-4493. doi: 10.1074/jbc.M606854200. Epub 2006 Dec 18. J Biol Chem. 2007. PMID: 17178716
-
The glucose-regulated nuclear localization of hexokinase 2 in Saccharomyces cerevisiae is Mig1-dependent.J Biol Chem. 2004 Apr 2;279(14):14440-6. doi: 10.1074/jbc.M313431200. Epub 2004 Jan 8. J Biol Chem. 2004. PMID: 14715653
-
Changing course: Glucose starvation drives nuclear accumulation of Hexokinase 2 in S. cerevisiae.PLoS Genet. 2023 May 17;19(5):e1010745. doi: 10.1371/journal.pgen.1010745. eCollection 2023 May. PLoS Genet. 2023. PMID: 37196001 Free PMC article.
-
Glucose control in Saccharomyces cerevisiae: the role of Mig1 in metabolic functions.Microbiology (Reading). 1998 Jan;144 ( Pt 1):13-24. doi: 10.1099/00221287-144-1-13. Microbiology (Reading). 1998. PMID: 9467897 Review. No abstract available.
-
The hexokinase 2-dependent glucose signal transduction pathway of Saccharomyces cerevisiae.FEMS Microbiol Rev. 2002 Mar;26(1):83-90. doi: 10.1111/j.1574-6976.2002.tb00600.x. FEMS Microbiol Rev. 2002. PMID: 12007644 Review.
Cited by
-
Microscopy with microfluidics in microgravity using FlightScope.NPJ Microgravity. 2025 May 6;11(1):13. doi: 10.1038/s41526-025-00470-3. NPJ Microgravity. 2025. PMID: 40328826 Free PMC article.
-
Genome-Wide Insight into Profound Effect of Carbon Catabolite Repressor (Cre1) on the Insect-Pathogenic Lifecycle of Beauveriabassiana.J Fungi (Basel). 2021 Oct 23;7(11):895. doi: 10.3390/jof7110895. J Fungi (Basel). 2021. PMID: 34829184 Free PMC article.
-
Rewiring regulation on respiro-fermentative metabolism relieved Crabtree effects in Saccharomyces cerevisiae.Synth Syst Biotechnol. 2022 Jun 15;7(4):1034-1043. doi: 10.1016/j.synbio.2022.06.004. eCollection 2022 Dec. Synth Syst Biotechnol. 2022. PMID: 35801089 Free PMC article.
-
Scalable and flexible inference framework for stochastic dynamic single-cell models.PLoS Comput Biol. 2022 May 19;18(5):e1010082. doi: 10.1371/journal.pcbi.1010082. eCollection 2022 May. PLoS Comput Biol. 2022. PMID: 35588132 Free PMC article.
-
Exploring carbon source related localization and phosphorylation in the Snf1/Mig1 network using population and single cell-based approaches.Microb Cell. 2024 May 16;11:143-154. doi: 10.15698/mic2024.05.822. eCollection 2024. Microb Cell. 2024. PMID: 38756204 Free PMC article.
References
-
- Ahuatzi D, Herrero P, De La Cera T, Moreno F. The glucose-regulated nuclear localization of Hexokinase 2 in Saccharomyces cerevisiae is Mig1-dependent. J Biol Chem. 2004;279:14440–14446. - PubMed
-
- Ahuatzi D, Riera A, Peláez R, Herrero P, Moreno F. Hxk2 regulates the phosphorylation state of Mig1 and therefore its nucleocytoplasmic distribution. J Biol Chem. 2007;282:4485–4493. - PubMed
-
- Blázquez MA, Lagunas R, Gancedo C, Gancedo JM. Trehalose-6-phosphate, a new regulator of yeast glycolysis that inhibits hexokinases. FEBS Lett. 1993;329:51–54. - PubMed
-
- Bonini BM, Van Dijck P, Thevelein JM. Uncoupling of the glucose growth defect and the deregulation of glycolysis in Saccharomyces cerevisiae tps1 mutants expressing trehalose-6-phosphate-insensitive hexokinase from Schizosaccharomyces pombe. Biochim Biophys Acta Bioenerg. 2003;1606:83–93. - PubMed
MeSH terms
Substances
Grants and funding
LinkOut - more resources
Full Text Sources
Molecular Biology Databases
