. 2020 Oct 15;80(2):246-262.e4.
doi: 10.1016/j.molcel.2020.09.003. Epub 2020 Sep 18.

Active Genetic Neutralizing Elements for Halting or Deleting Gene Drives

Affiliations

Active Genetic Neutralizing Elements for Halting or Deleting Gene Drives

Xiang-Ru Shannon Xu et al. Mol Cell. .

Abstract

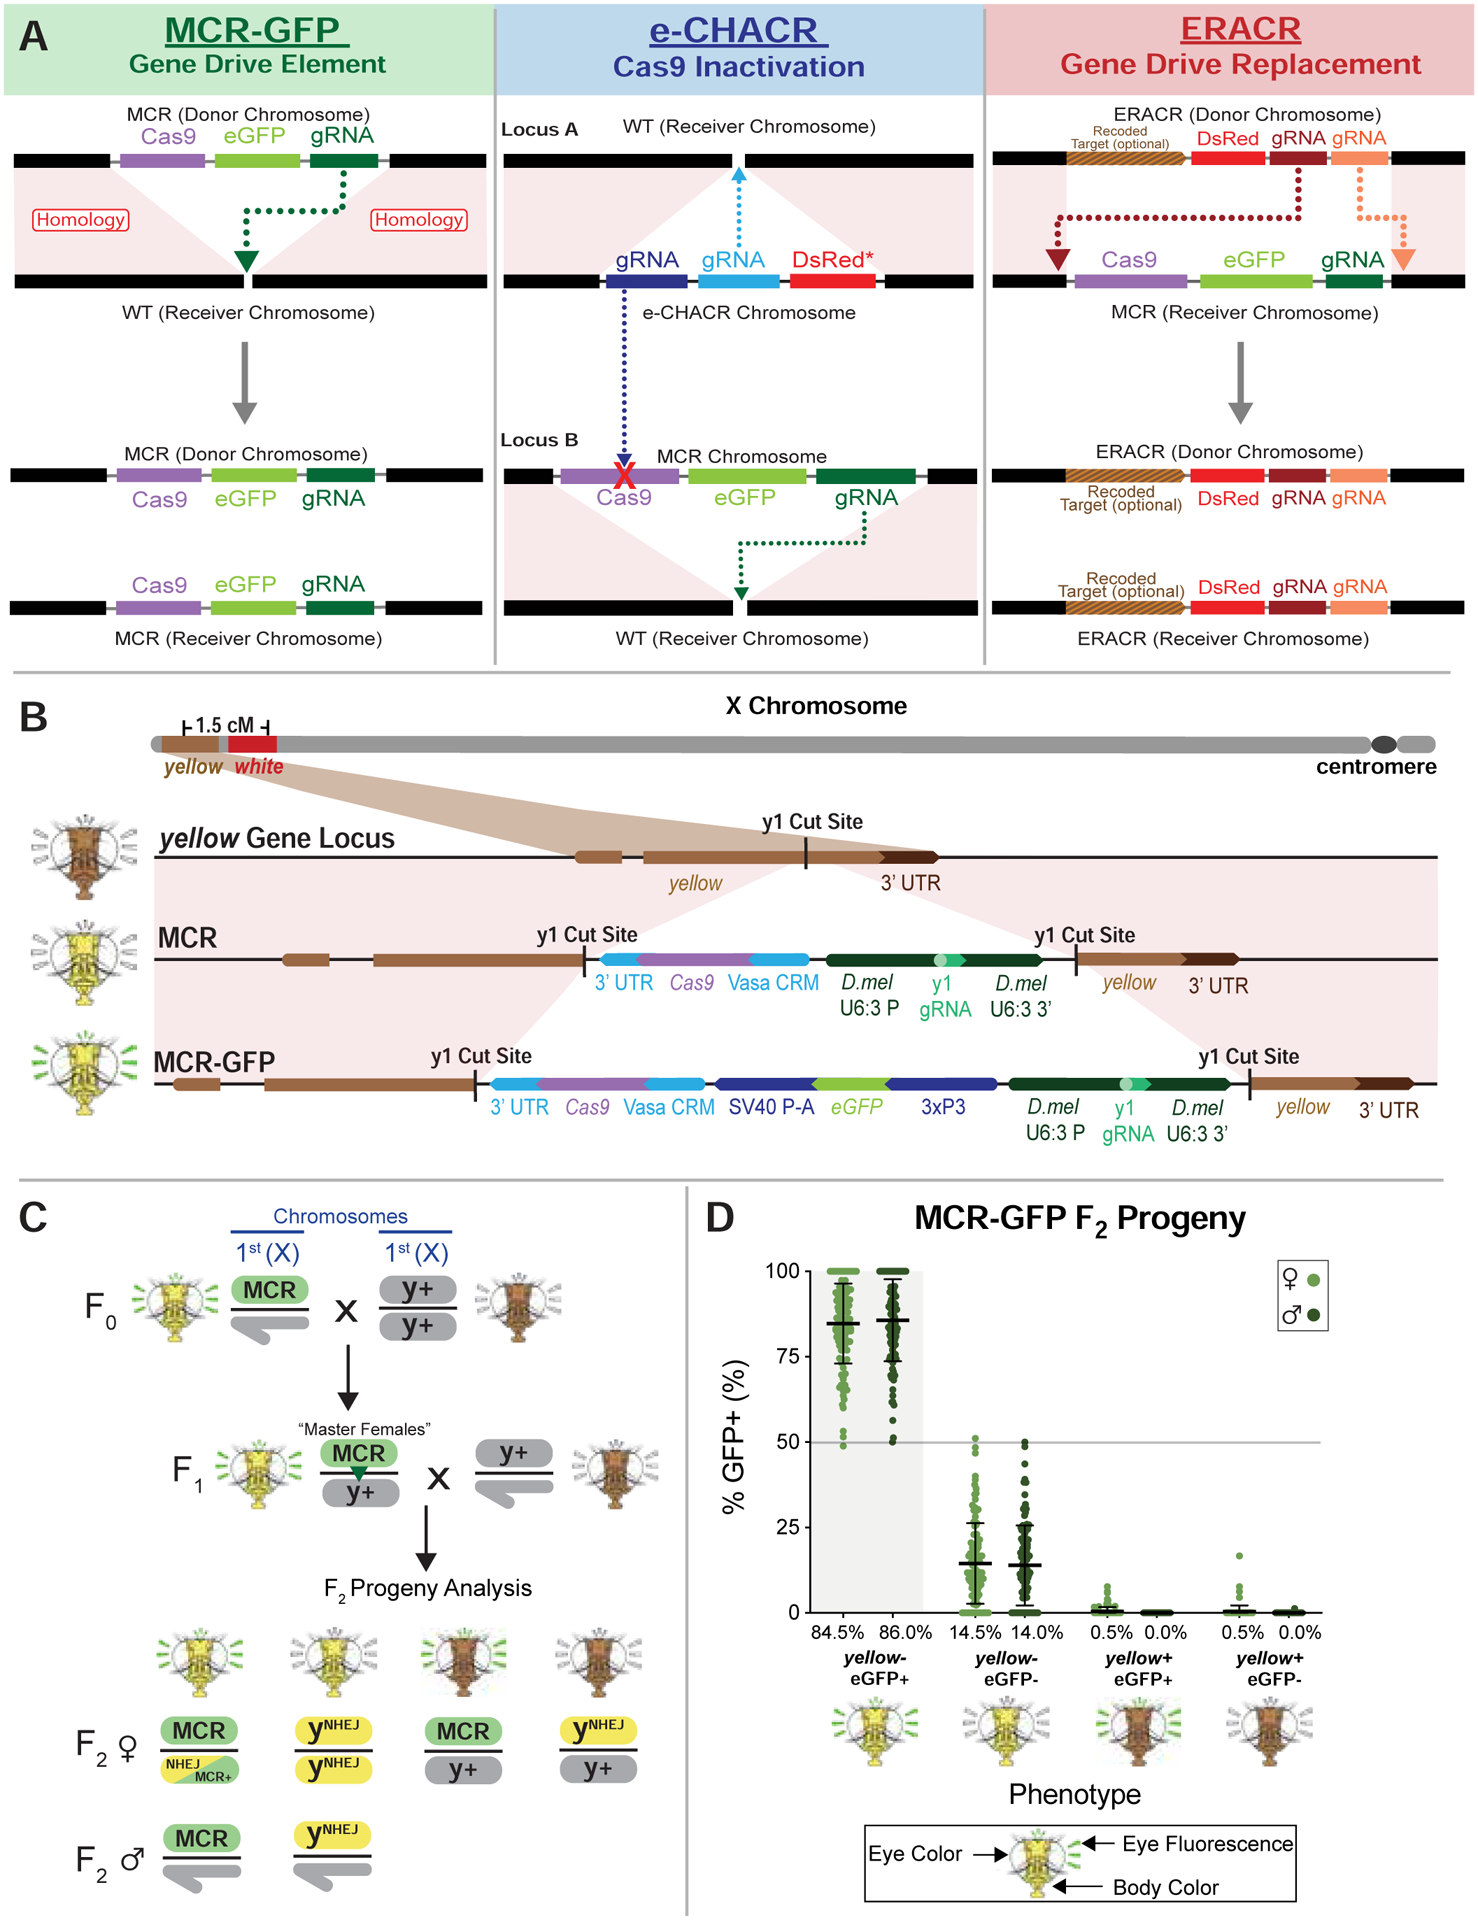
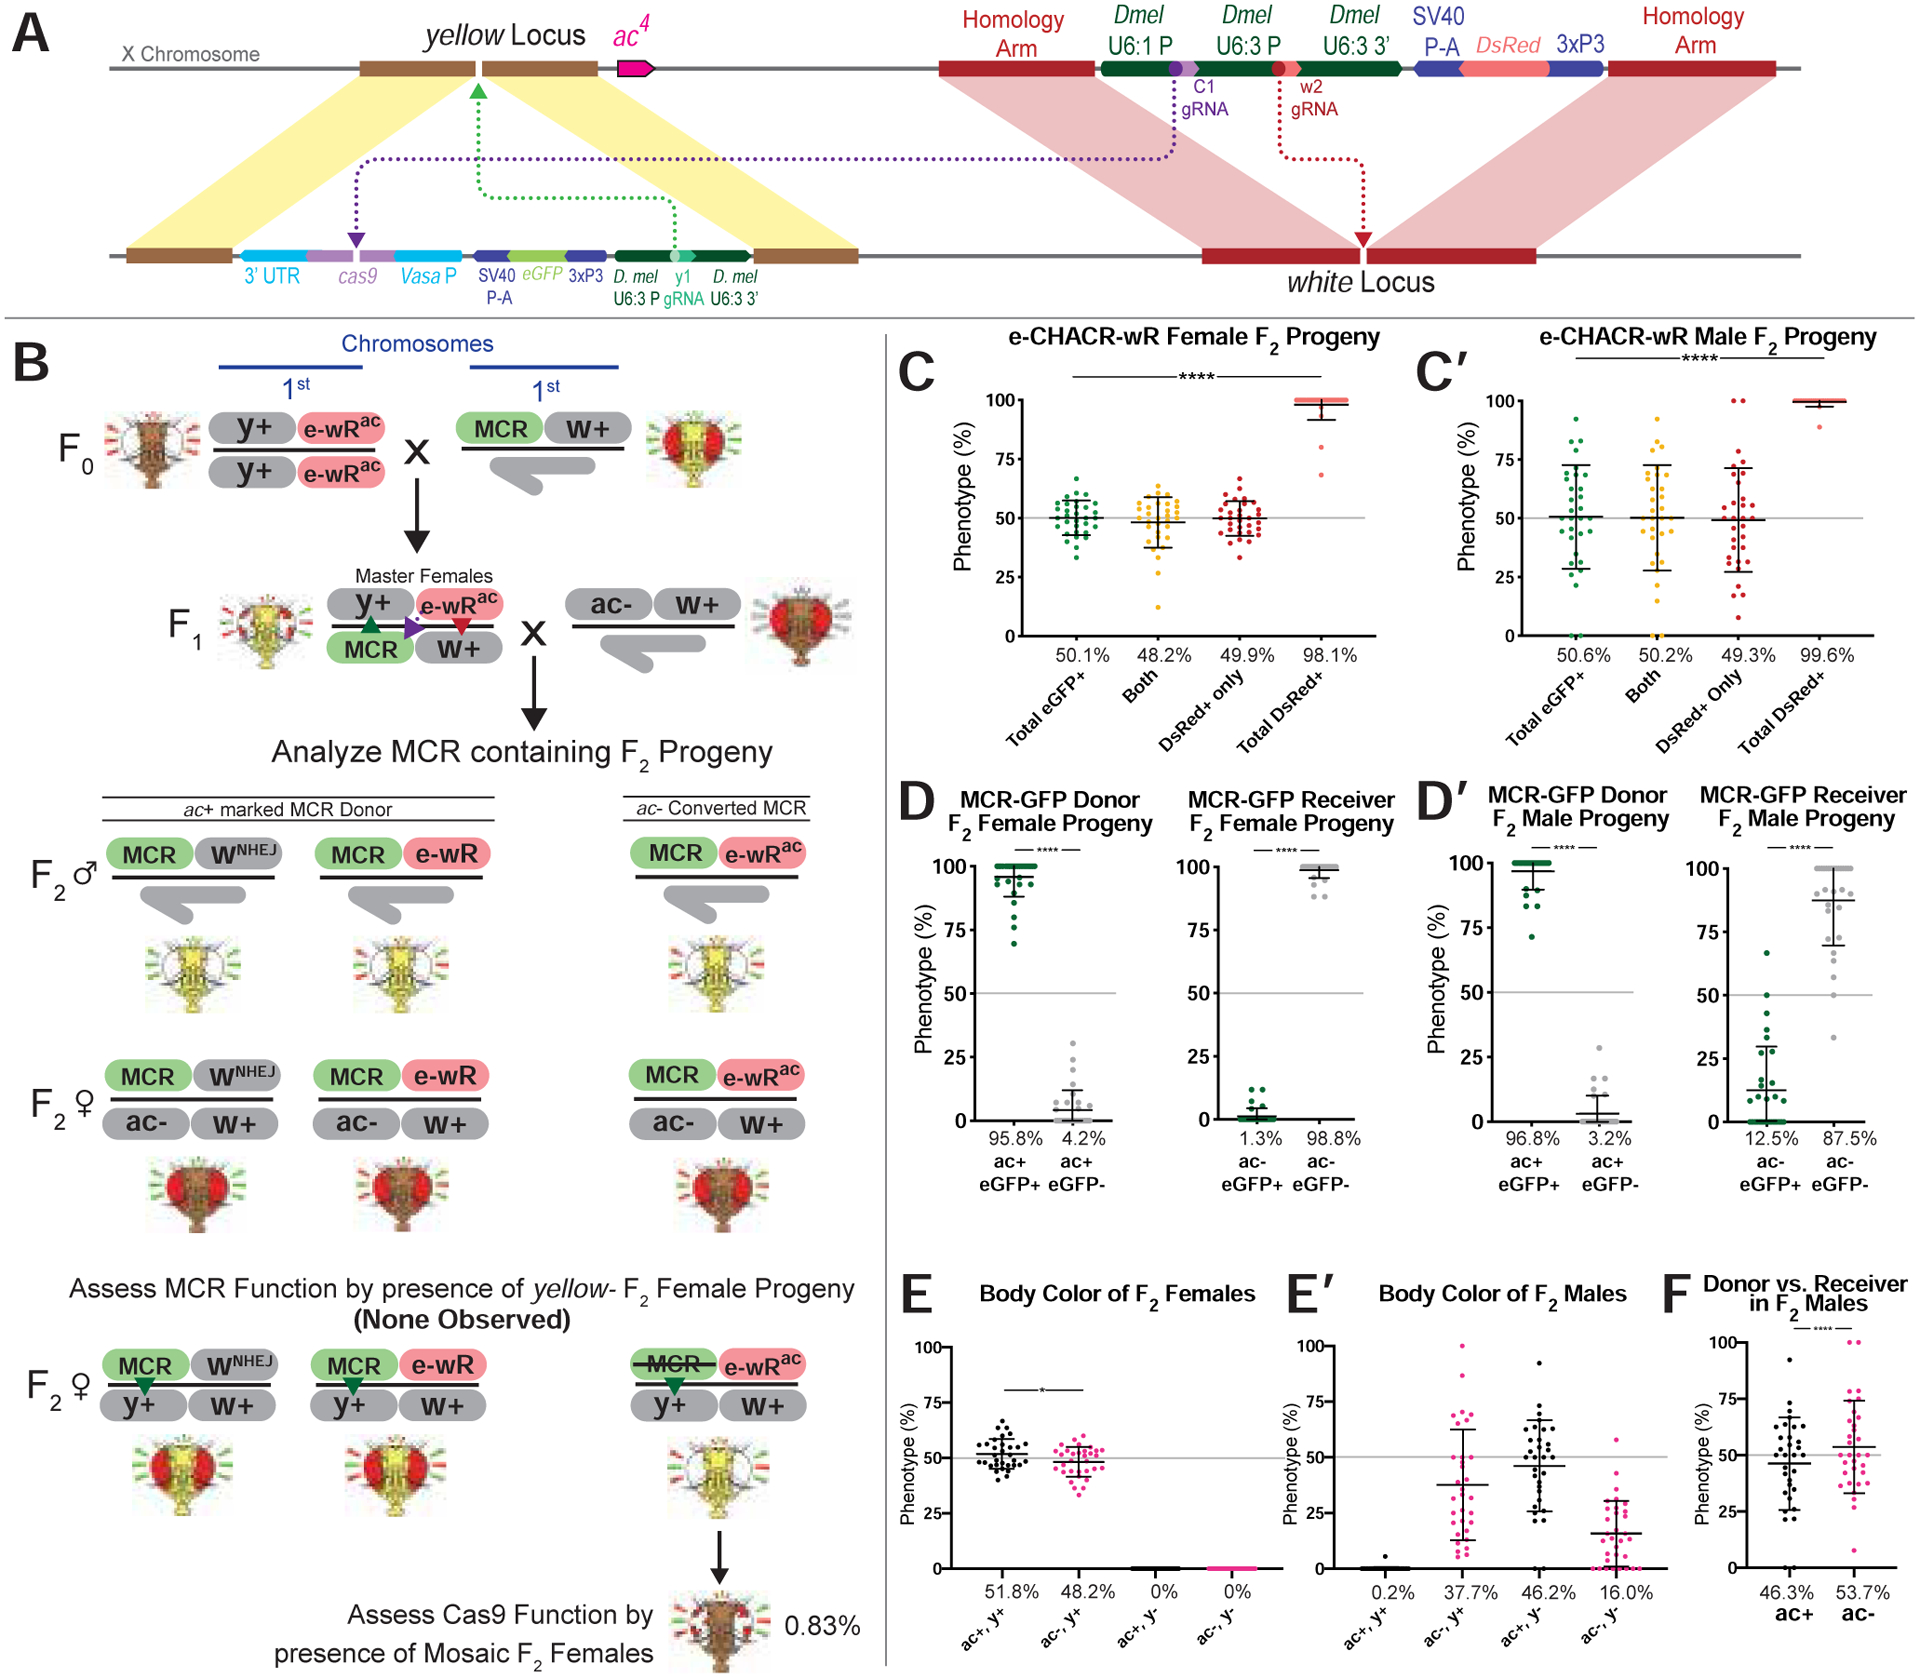
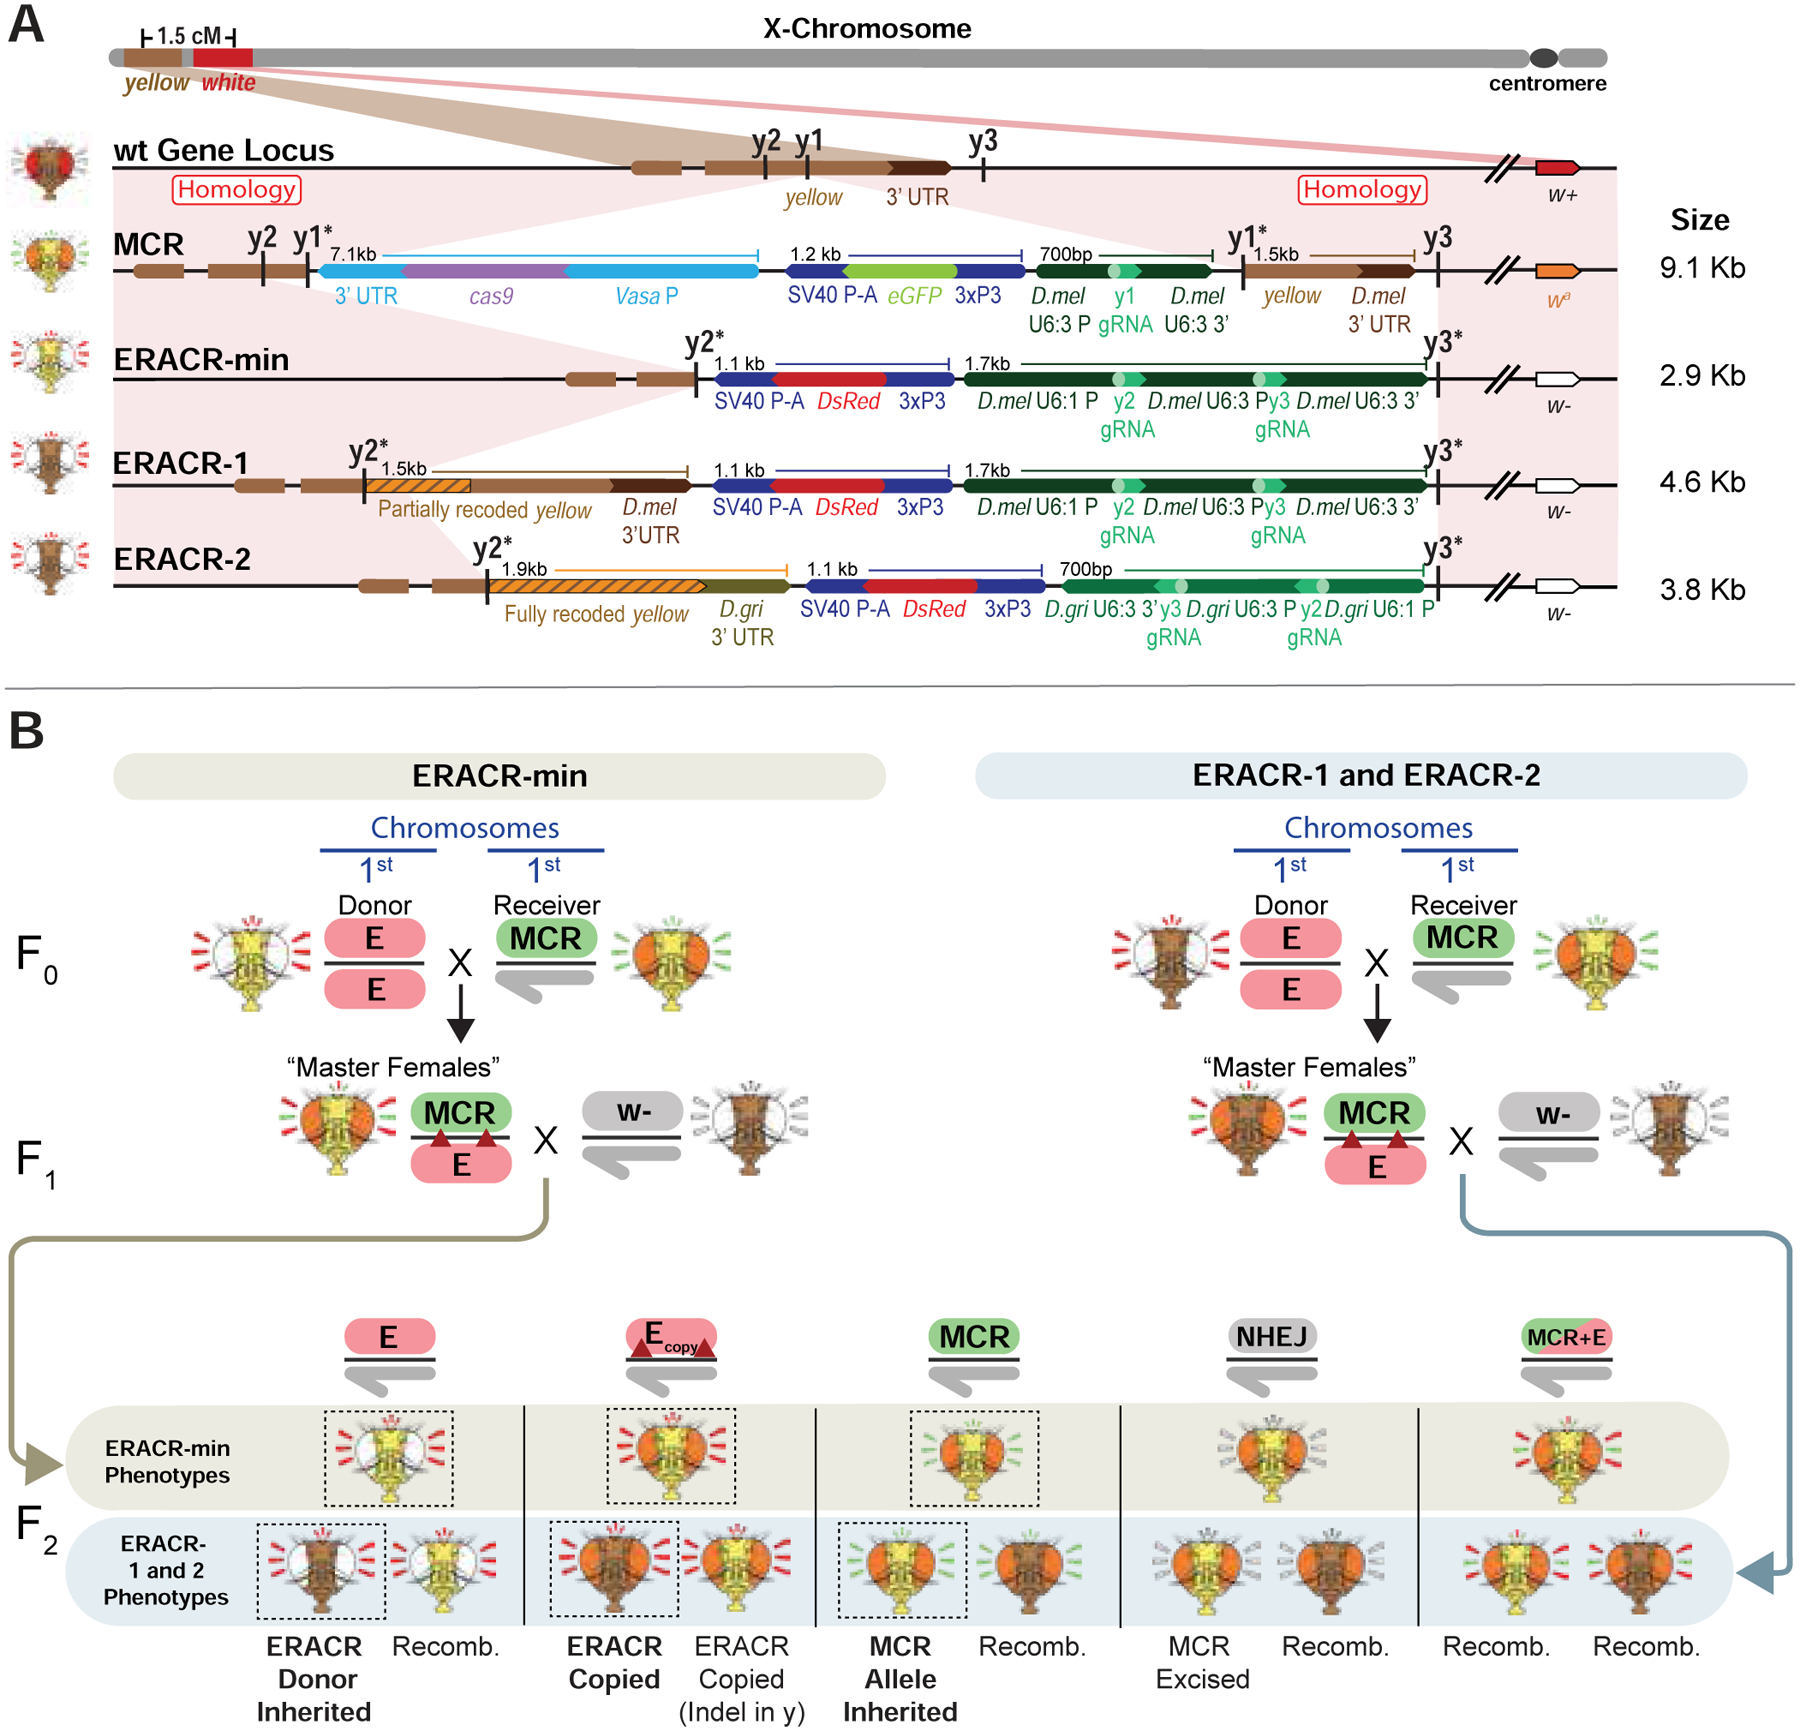
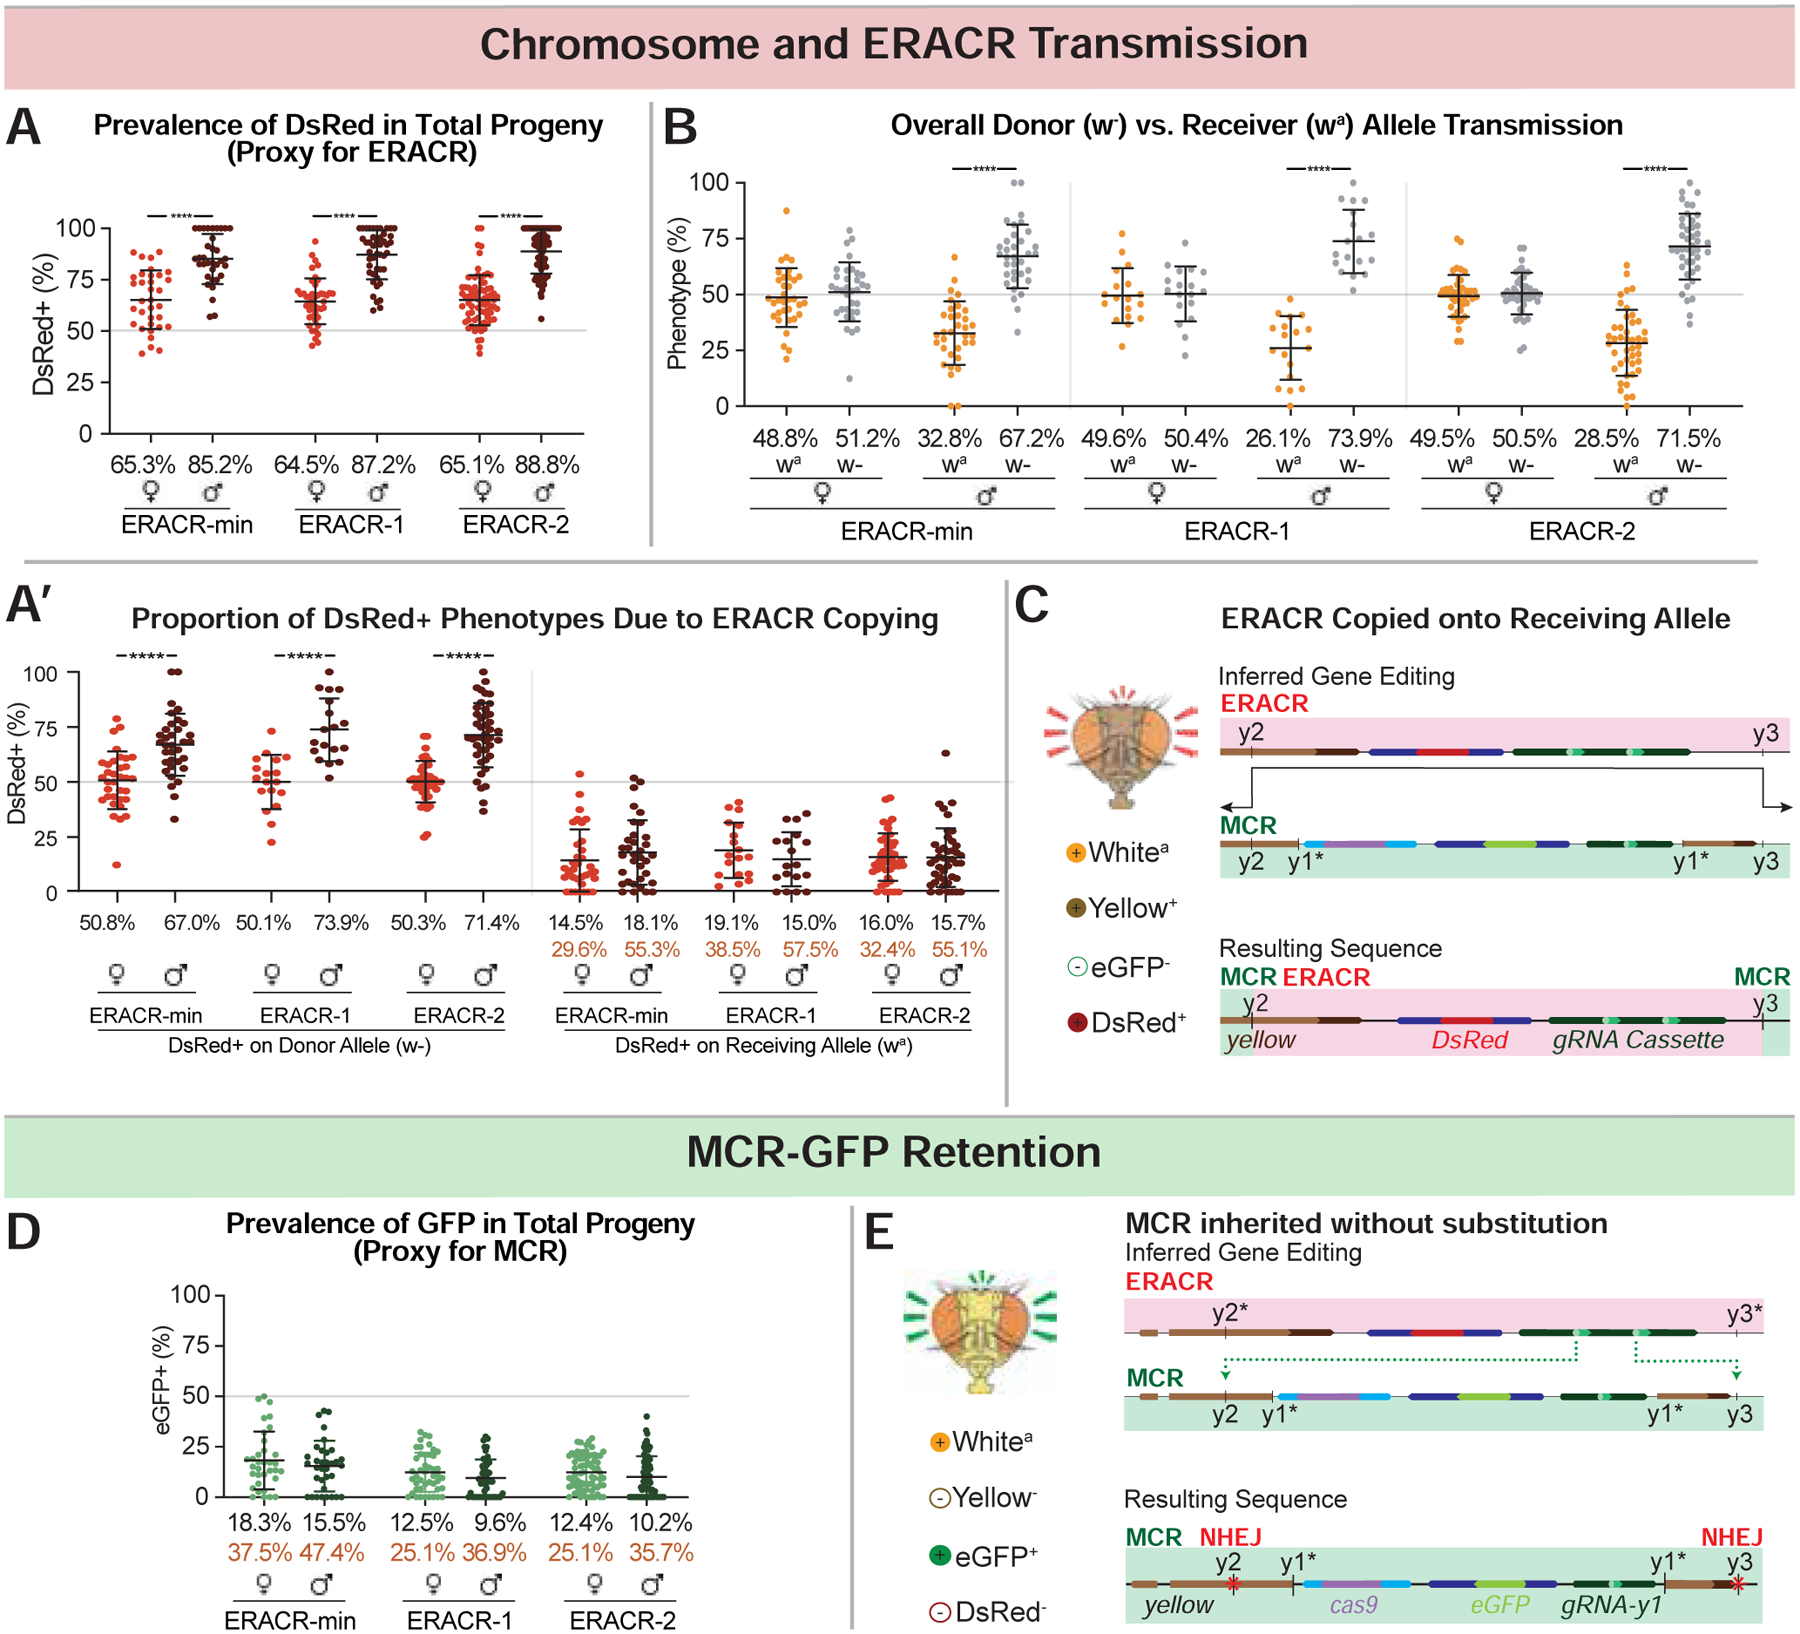
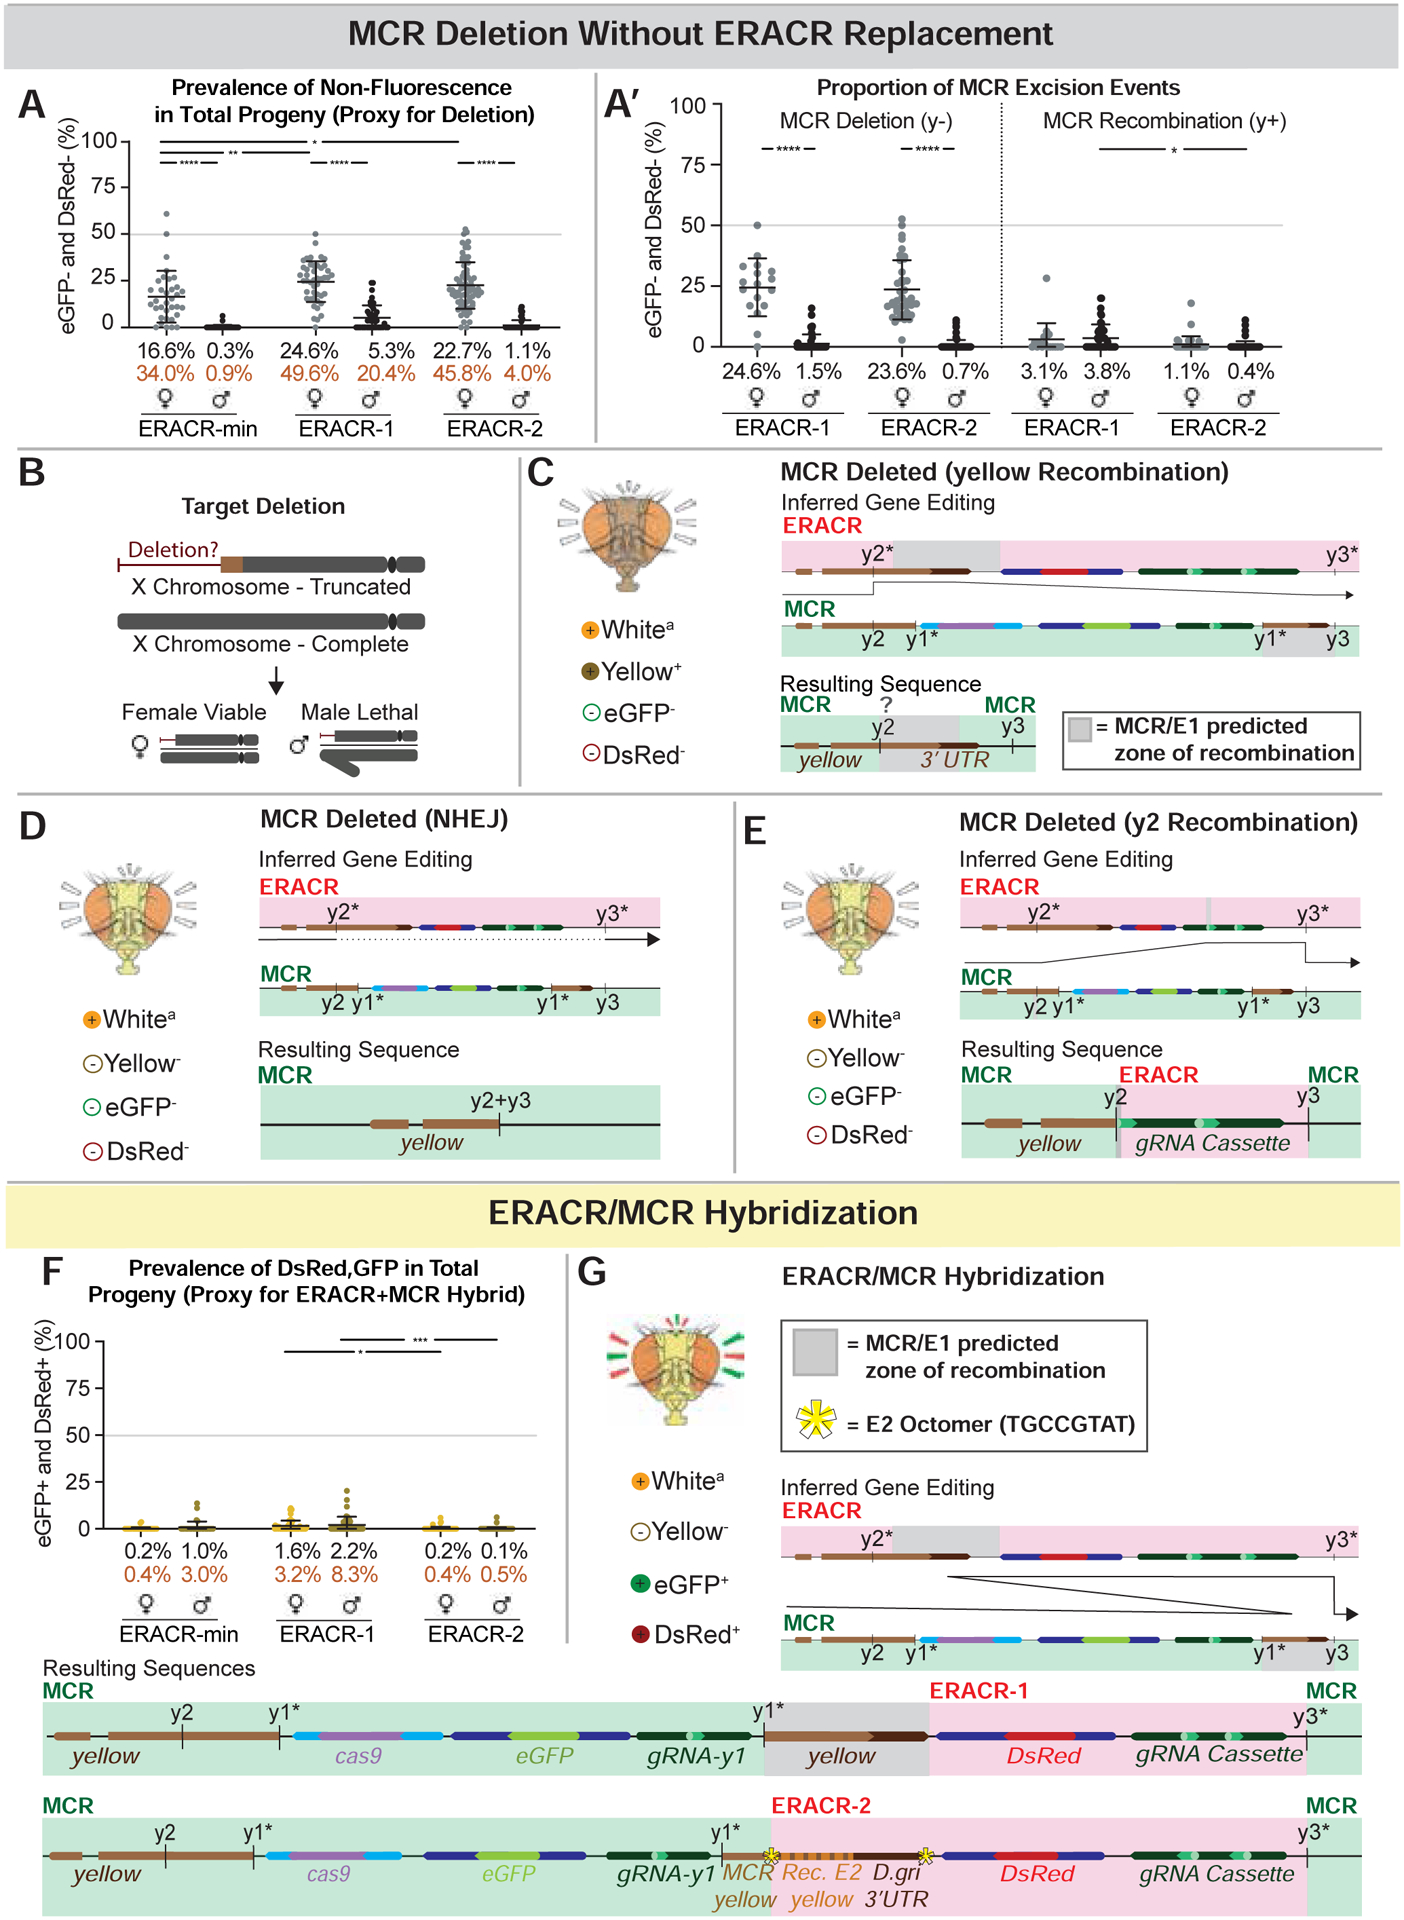
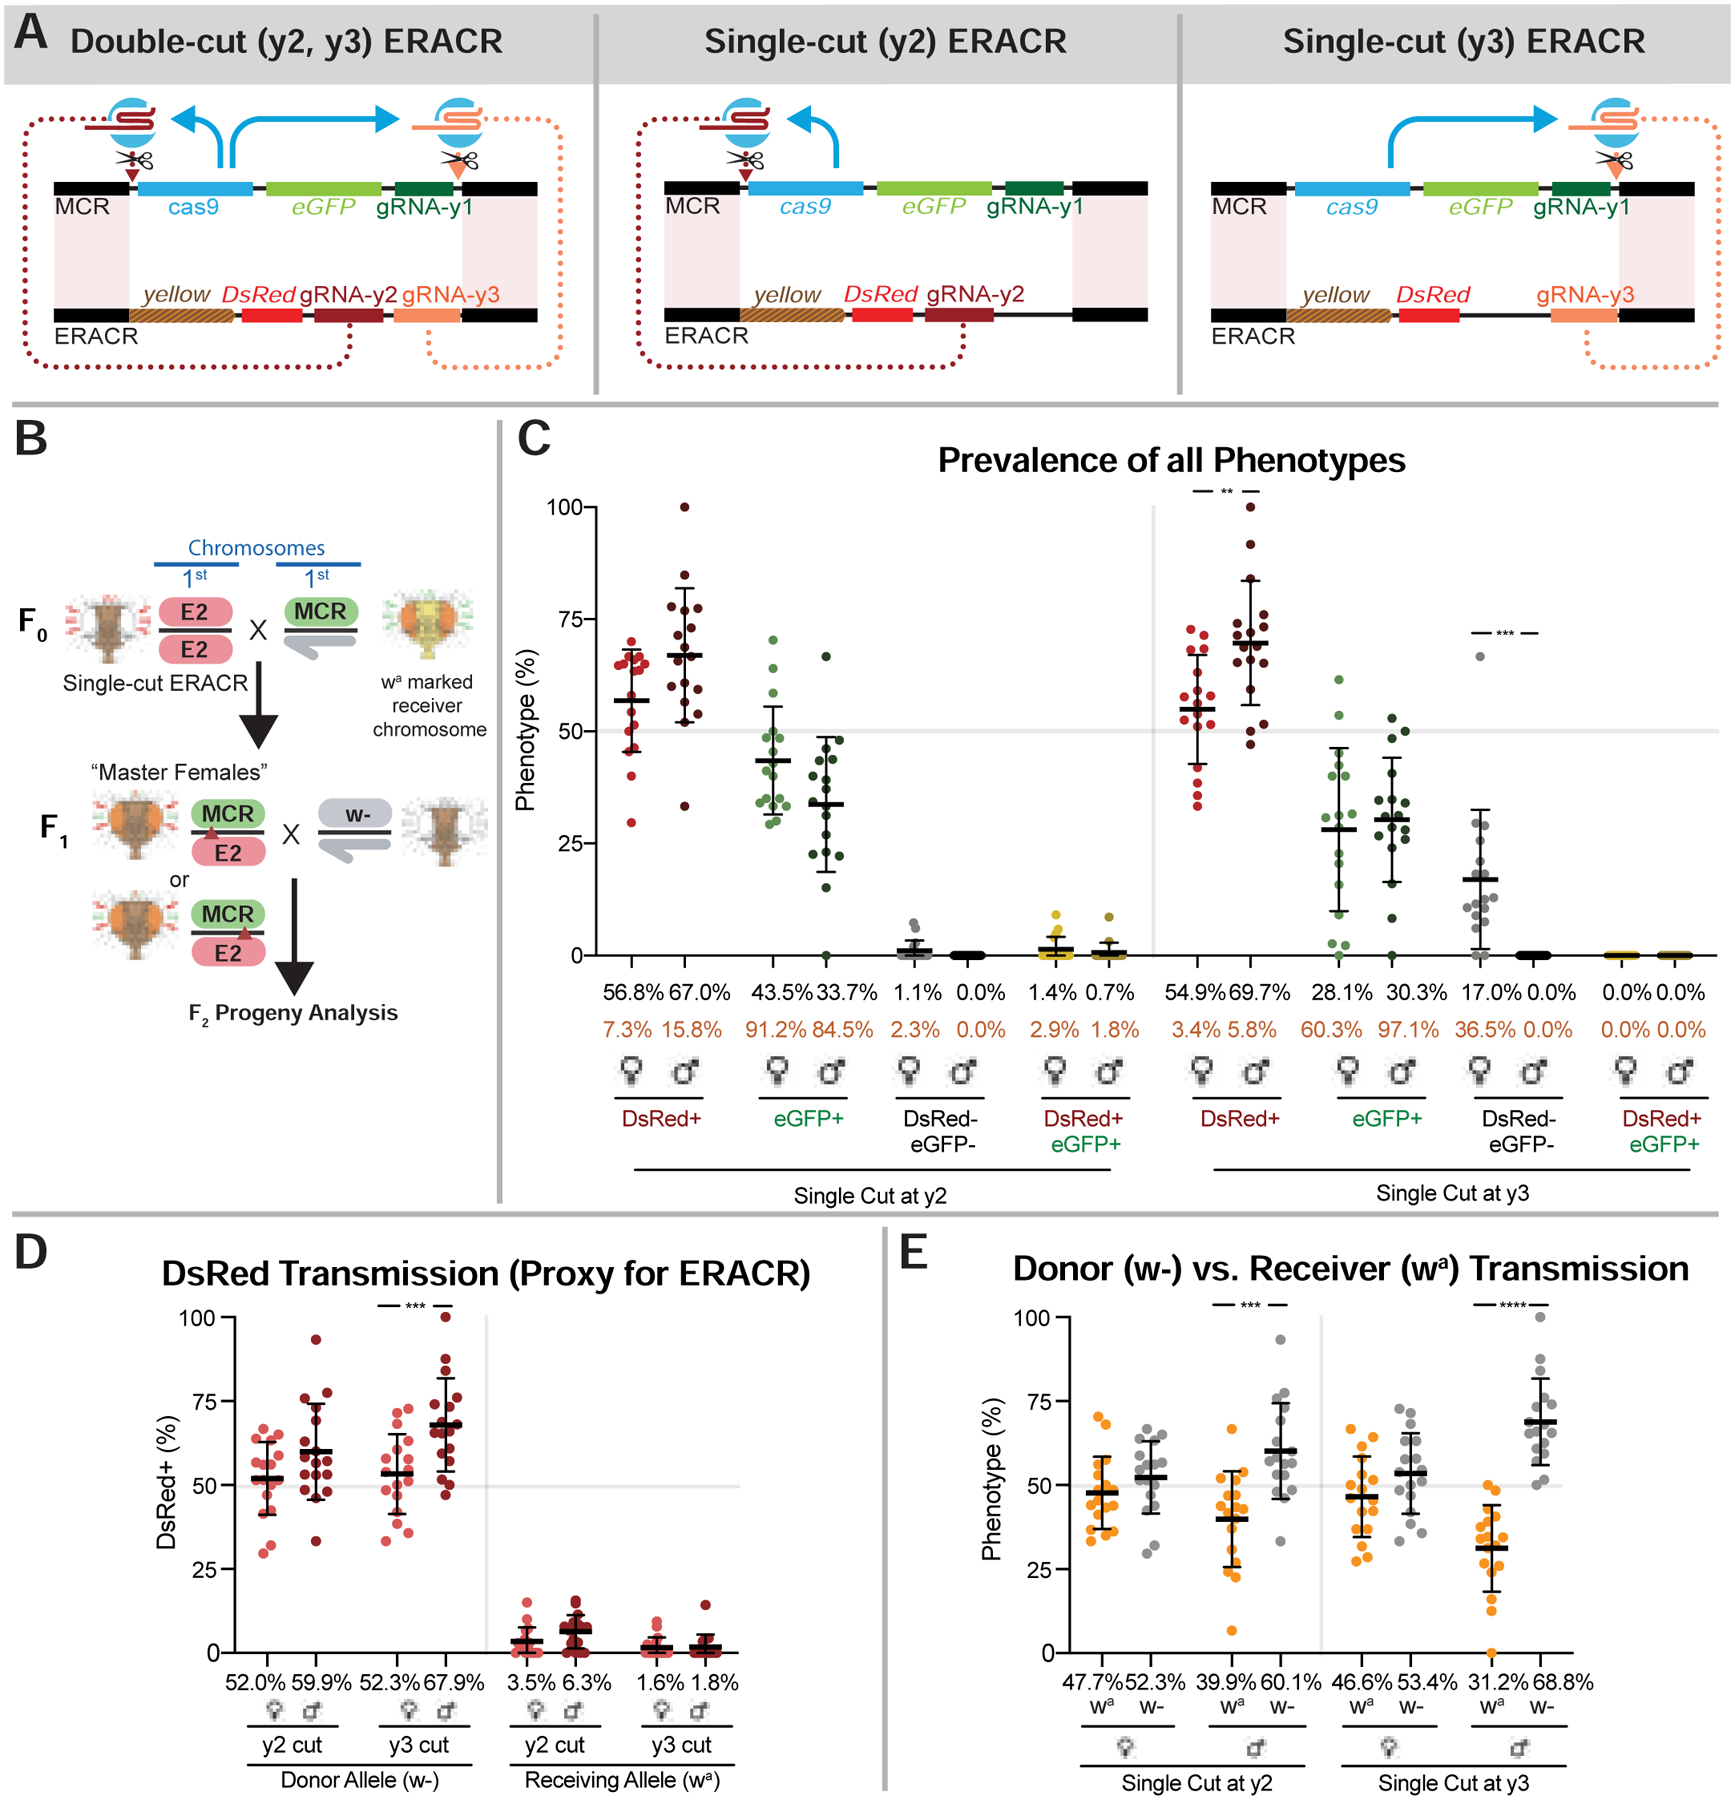
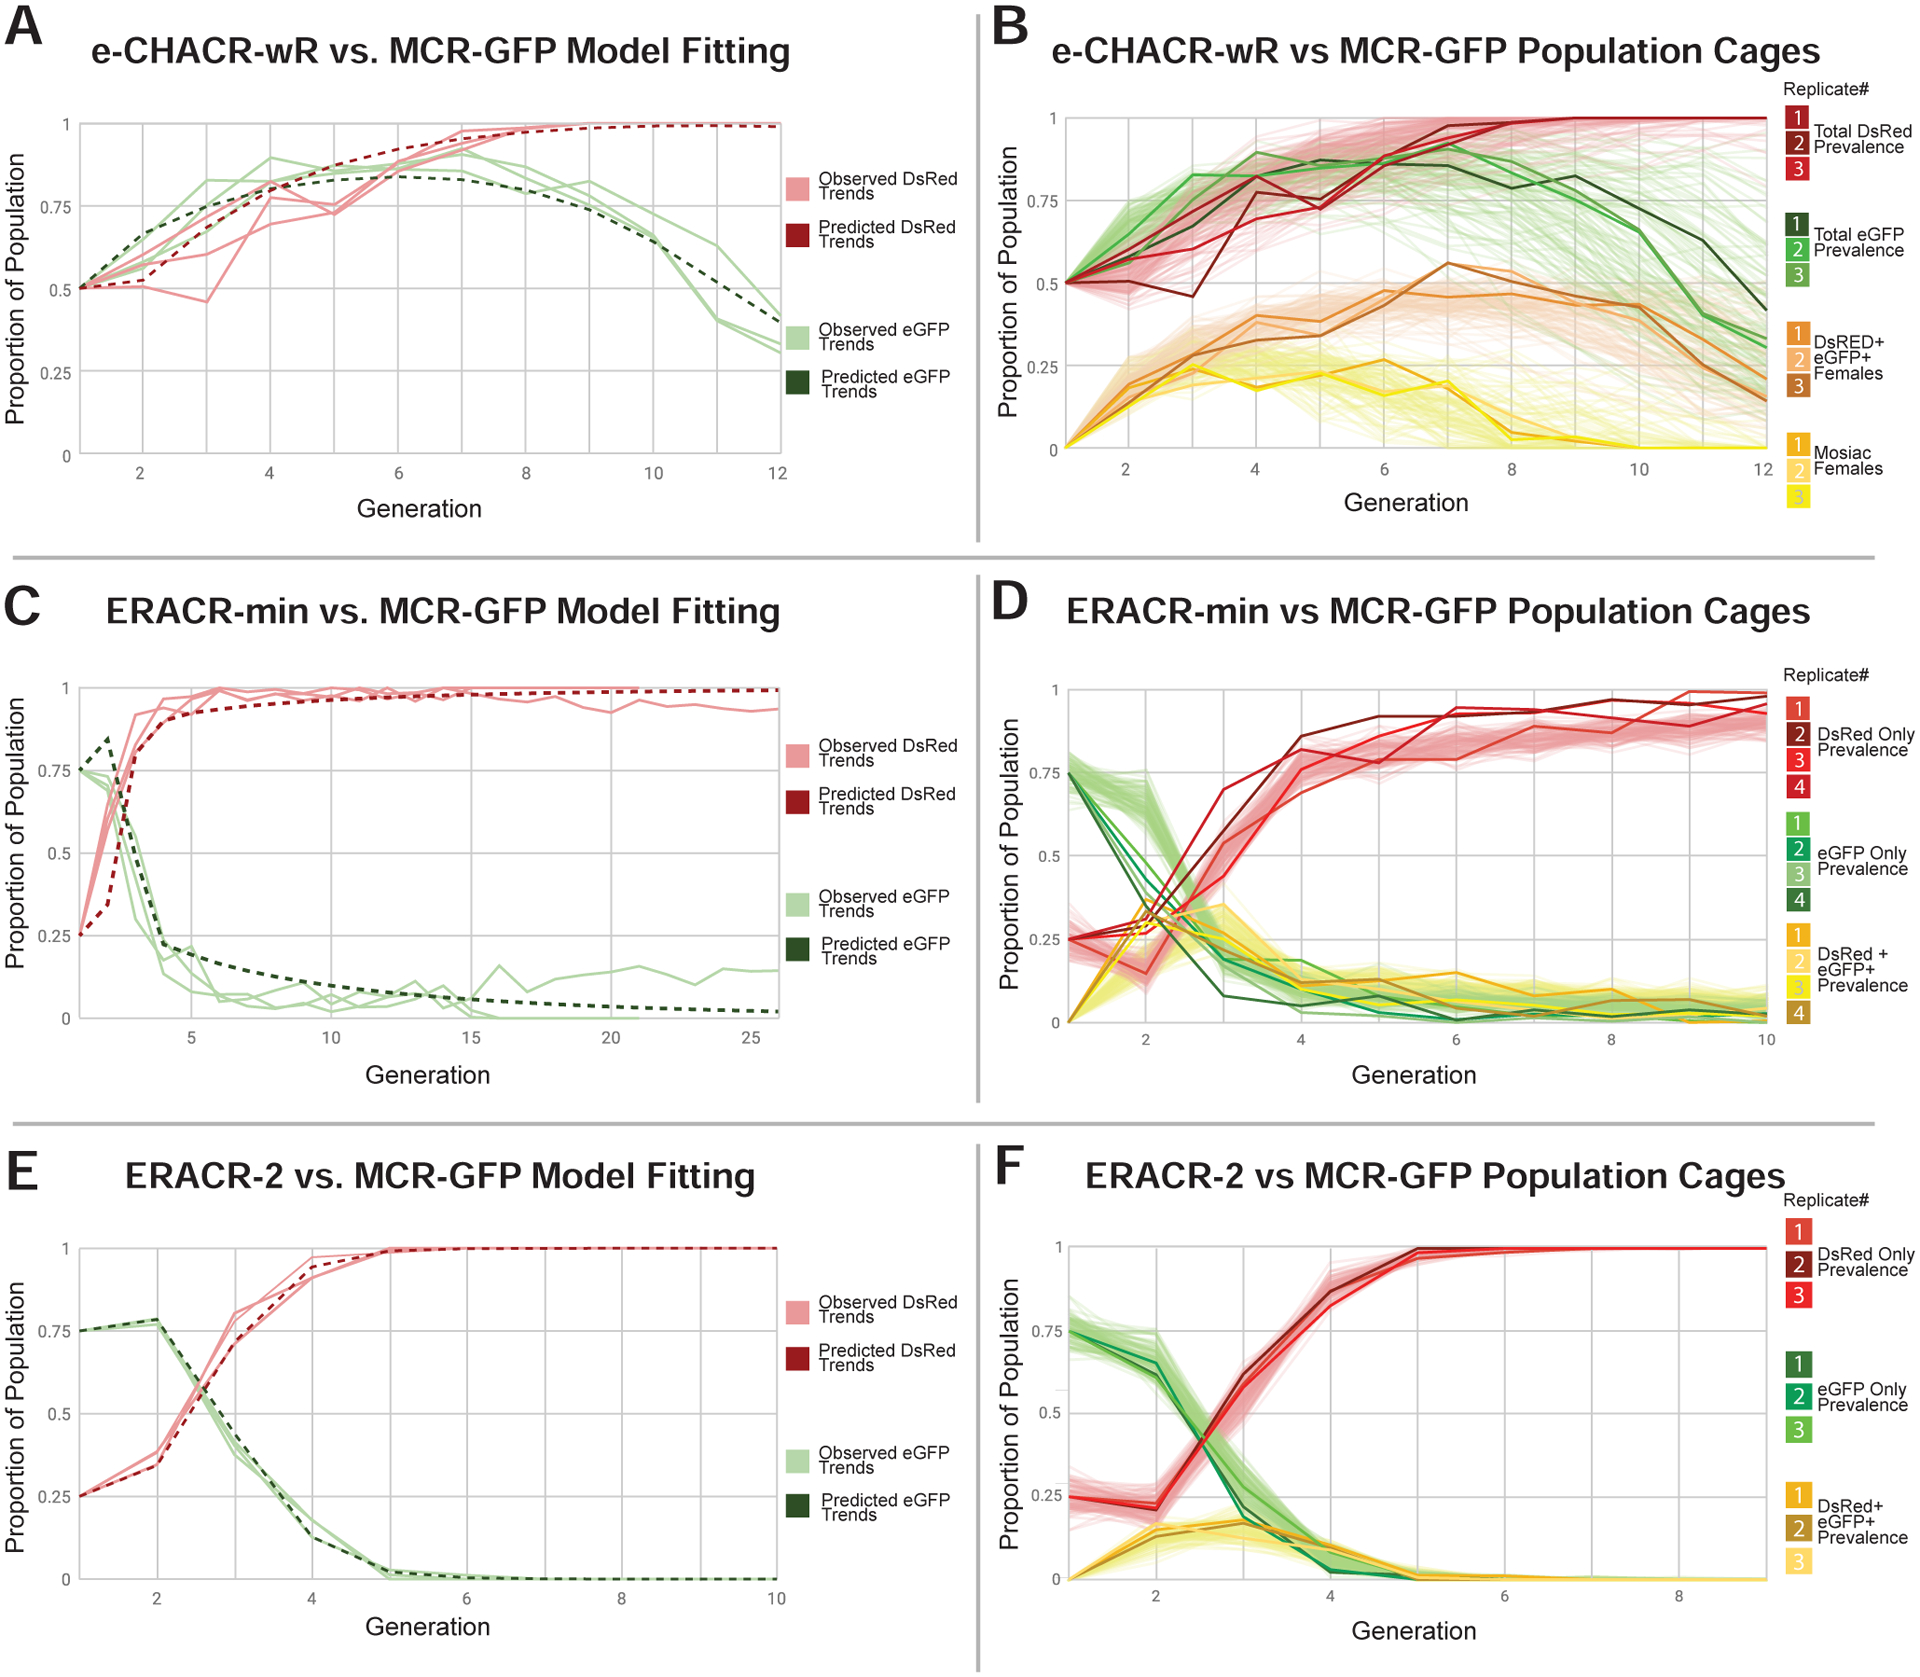
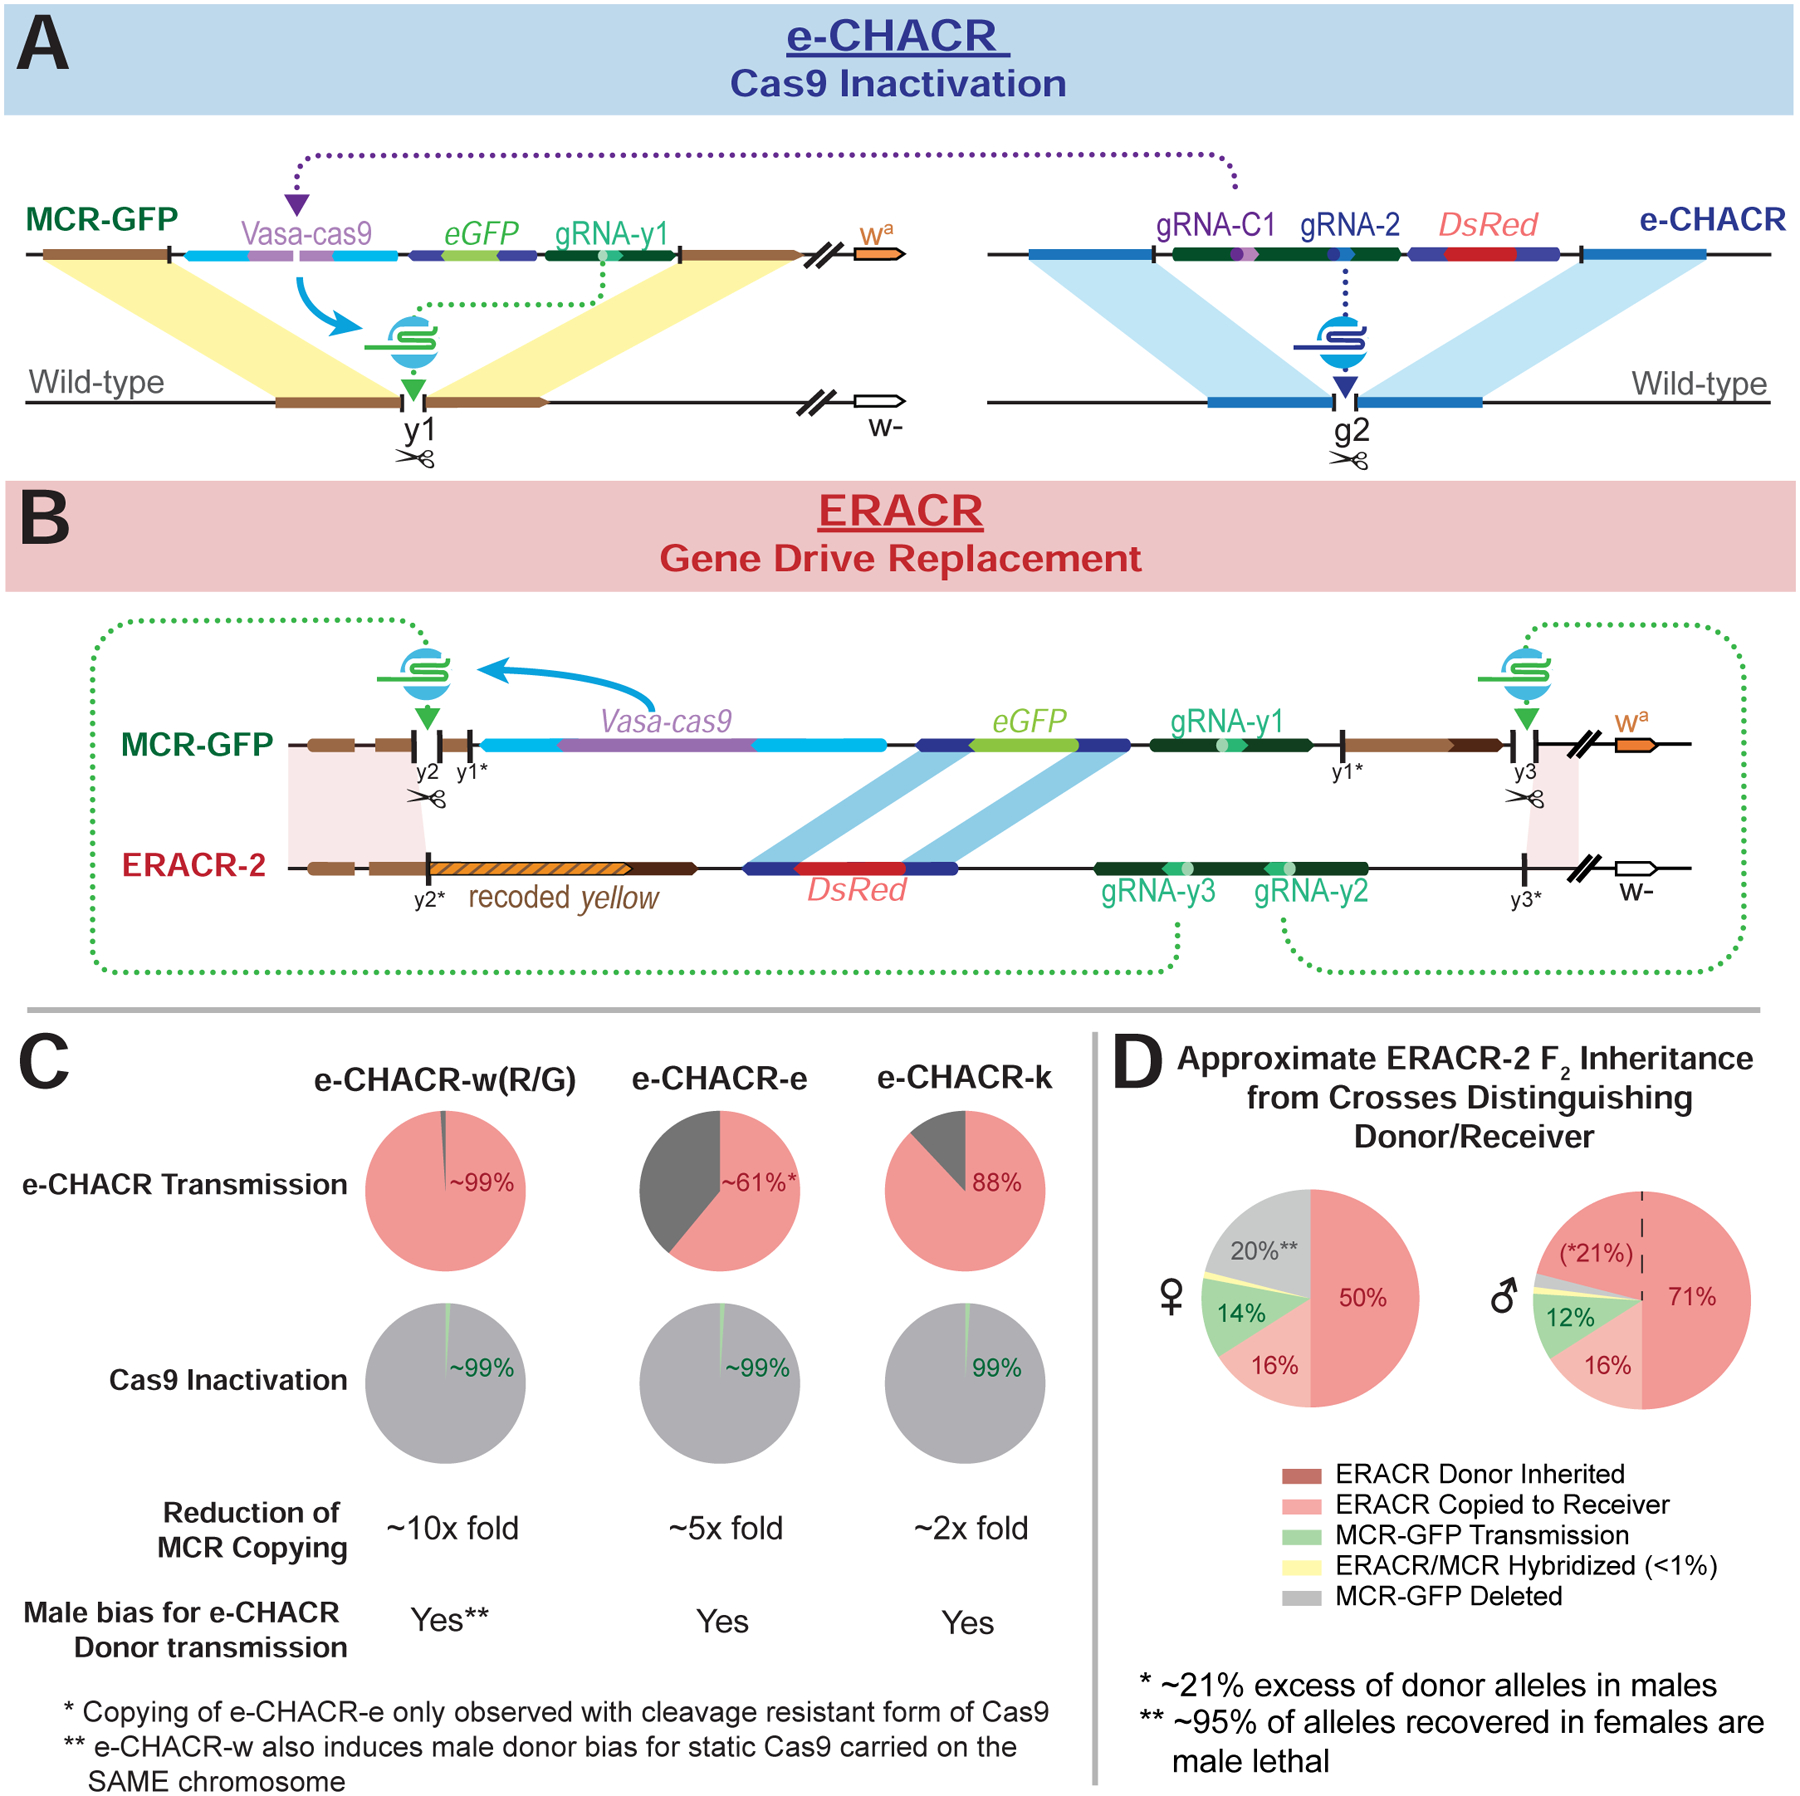
CRISPR-Cas9-based gene drive systems possess the inherent capacity to spread progressively throughout target populations. Here we describe two self-copying (or active) guide RNA-only genetic elements, called e-CHACRs and ERACRs. These elements use Cas9 produced in trans by a gene drive either to inactivate the cas9 transgene (e-CHACRs) or to delete and replace the gene drive (ERACRs). e-CHACRs can be inserted at various genomic locations and carry two or more gRNAs, the first copying the e-CHACR and the second mutating and inactivating the cas9 transgene. Alternatively, ERACRs are inserted at the same genomic location as a gene drive, carrying two gRNAs that cut on either side of the gene drive to excise it. e-CHACRs efficiently inactivate Cas9 and can drive to completion in cage experiments. Similarly, ERACRs, particularly those carrying a recoded cDNA-restoring endogenous gene activity, can drive reliably to fully replace a gene drive. We compare the strengths of these two systems.

Keywords: CRISPR; Drosophila; ERACR; MCR; active genetics; drive-neutralizing; e-CHACR; gene drive; modeling; risk management.


Conflict of interest statement

Declaration of Interests E.B., V.M.G., and O.S.A. have equity interest in Synbal Inc. (E.B. and V.M.G.) and Agragene (E.B., V.G., and O.S.A.). These companies may potentially benefit from the research results. E.B. and V.M.G. also serve on the Board of Directors and Scientific Advisory Board for Synbal Inc., and E.B., V.M.G., and O.S.A. serve on the Scientific Advisory Board for Agragene Inc. The terms of these arrangements have been reviewed and approved by the University of California, San Diego, in accordance with its conflict-of-interest policies. All other authors declare no competing interests.

Figures

Figure 1:
Figure 1:. Gene-drive and neutralizing drive elements
A) Scheme depicting gene-drives and neutralizing elements. Left: MCR (mutagenic chain reaction) gene-drive element carrying Cas9, an eGFP fluorescent marker, and a gRNA- for copying. Center: eCHACR carrying two or more gRNAs: one gRNA (blue) for copying at its genomic insertion site, a second gRNA (purple) targeting Cas9, and a DsRed (or eGFP) fluorescent eye marker. e-CHACRs are typically inserted at a different chromosomal site (locus A) than the gene-drive (locus B). Right: ERACR carrying gRNAs that target sequences flanking the MCR-GFP element and a DsRed marker. B) Two MCR elements inserted at the same site in the y locus: 1) MCR lacking a fluorescent marker (third row), and 2) MCR-GFP, an eGFP-marked version (bottom row) carrying the same core components (vasa-Cas9 and gRNA-y1). C) Cross scheme for generating MCR-GFP F1 “master females” and their F2 progeny. Phenotypes of F0, F1, and F2 progeny are depicted schematically. D) Percentage of GFP+ F2 progeny (carrying MCR-GFP element) recovered per cross. Fly heads depict eye phenotypes determined by the white (w) locus: wild-type = w+ (red eyes), recessive w (white eyes), eye fluorescence markers (GFP = radiating green lines), and body color (y+ = brown, y = yellow).
Figure 2:
Figure 2:. e-CHACR-wR versus the MCR-GFP element
A) Schematic of DsRed+ e-CHACR-wR element linked to the ac4 allele (e-wRac) and the y+ ac+ marked MCR-GFP allele. B) Crossing scheme for testing the e-CHACR-wR (e-wR) against the MCR-GFP element. e-CHACR-wR females were mated to MCR-eGFP males to generate F1 master females that were then pair-mated to ac4 (ac) males. F2 progeny were screened and analyzed for MCR-GFP presence and presence (DsRed+) or absence (wNHEJ) of e-CHACR-wR on ac+ or ac4 marked chromosomes. C,C’) Percentage of fluorescence phenotypes in total female (C) or male (C’) F2 progeny per cross. D,D’) Prevalence of GFP+ and GFP alleles in MCR-GFP donor (left) and receiver F2 D) females or D’) males (right). E,E’) Prevalence of body color in total F2 E) females or E’) males. F) Percentage of MCR-GFP donor (ac+, black dots) and receiver (ac, pink dots) alleles in F2 males.
Figure 3:
Figure 3:. ERACR construct designs and crossing schemes.
A) Diagrams of MCR-GFP and ERACR elements. Fly heads on the left indicate the phenotype of each strain. Schematic not drawn to scale. B) Cross schemes to generate F1 “master females” with ERACRs in-trans to the MCR-GFP element and their F2 progeny. Crossing schemes for y ERACR-min (left) and for y+ ERACR-1 and y+ ERACR-2 (right). Fly heads depict eye color (wild-type = w+ (red), w (white), or wa (orange), eye fluorescence (radial emanating lines of eGFP (green), DsRed (red), both eGFP and DsRed (alternating green and red), or neither fluorescence (white), and body color: y+ (brown) or y (yellow). Expected F2 phenotypes bolded and outlined with black boxes.
Figure 4:
Figure 4:. ERACRs delete and replace the MCR-GFP drive
Phenotypic frequencies and deduced gene conversion events in F2 progeny from crosses depicted in Fig. 3A. (additional crossing schemes in Figs. S13A–E). Black type = mean of percentages across all vials and orange type = estimated receiver conversion frequencies (e.g., DsRed wa males/total wa males) (see Data S3 for details). A) DsRed+ inheritance is a proxy for scoring ERACR prevalence (DsRed+, GFP and DsRed+, GFP+ progeny included). A’) The subset of data plotted in panel 4A with traceable donor and receiver chromosomes re-plotted by donor (w; left graph) versus receiver (wa; right graph) chromosomes. B) Proportion of F2 males or females inheriting the donor (w) versus receiver (wa) chromosome. C,E) Schematics illustrating predicted gene conversion events responsible for specific phenotypes: sequences of relevant junctions shown in (Fig. S14). D) GFP inheritance is a proxy for MCR-GFP prevalence (DsRed+,GFP+ plus DsRed,GFP+ F2 progeny). E) MCR-GFP alleles, although intact, have NHEJ-induced indels at the y2 and y3 cut sites.
Figure 5:
Figure 5:. Alternative ERACR versus MCR-GFP outcomes
Partial copying or fusion of sequences on the receiver chromosome. A) Non-fluorescent DsRed,GFP F2 progeny as a proxy for MCR-GFP deletion events. A’) Data in panel A re-plotted by inheritance of y (lethal deletion) versus y+ (recombination) alleles. Body color permits inference of the type of excision event that occurred, as depicted in C-E. B) Loss of essential sequences distal to the ERACR gRNA cut sites result in male-lethal alleles. Viability of several such alleles can be rescued in males by duplications covering the tip of the X chromosome (Fig. S12B). C-E) The MCR-GFP element is deleted, but not replaced by ERACR, producing three distinct observed outcomes. C) Hypothesized repair mediated by partial pairing of un-recoded y sequences carried by ERACR-1 and endogenous y sequences 3’ to the MCR-GFP element result in expression of the recoded y cassette and a wild-type body color. D) NHEJ events joining adjacent sequences at the gRNA-y2 and gRNA-y3 cut sites. E) Likely pairing between 17 bp of the gRNA-y2 genomic target sequences 5’ to the MCR-GFP with correspondingly oriented sequences in the gRNA-y2 transgene carried by either ERACR-min or ERACR-1. F) Prevalence of DsRed+, GFP+ F2 progeny in which MCR-GFP and ERACR sequences are both present on the receiver chromosome. G) Two examples of MCR-GFP/ERACR fusion events (see Fig. S14).
Figure 6:
Figure 6:. Drive performance of single-cut ERACRs versus MCR-GFP drive
A) Schemes illustrating single-cut and double-cut ERACR designs. B) Crossing scheme for generating and testing transmission by single-cut wa ERACR/MCR-GFP F1 master females. C-E) Single-cut versions of ERACR-2 are placed in-trans to the MCR-GFP element where the gRNA-y2 and gRNA-y3 are separated by a distance of 11.3 kb (see also Fig. S19 for Copy-Cat analysis). C) Fluorescent phenotypes for single-cut DsRed+ ERACR2-y2 and ERACR2-y3 and MCR-GFP. D) Percent DsRed+ females or males inheriting either the donor (w) ERACR-2 single-cut chromosome or the receiver (wa) chromosome. E) Donor versus receiver chromosome transmission for single-cut ERACR2-y2 and ERACR2-y3.
Figure 7:
Figure 7:. Cage experiments: MCR-GFP versus e-CHACR-wR and ERACRs
A,C,E) Modeling of MCR-GFP versus e-CHACR-wR (A) and ERACR (C,D) dynamics (solid lines: same as B,D,E) and model fits (dotted lines) plotted for the frequencies of MCR-GFP (green) and e-CHACR-wR or ERACRs (red). B) Plot of fraction of individuals with different phenotypes over 12 generations. Green = MCR-GFP and Red = e-CHACR-wR prevalence in the total population (e.g., both males and females). Orange = females carrying both elements. Yellow = females with mosaic eyes indicative of Cas9 activity. Dark traces represent separate cage replicates and pale lines = model simulations (also in panels D,F). C,E) Modeling of MCR-GFP versus ERACR dynamics over 26 generations (C) and ERACR-2 (E). D,F) ERACR-min (D) and ERACR-2 (F) versus MCR-GFP cage experiments. Red = DsRed+ ERACRs. Green = MCR-GFP+. Yellow = both markers.
Figure 8:
Figure 8:. Summary Diagrams
A) Diagram illustrating the generic action of the e-CHACRs against the MCR-GFP gene-drive. B) Diagram outlining the structures and homologous sequences serving as sites for potential SDSA-mediated partial copying between ERACR-2 and the MCR-GFP constructs (lightly shaded parallelograms). y1*, y2* and y3* indicate the loss of the gRNA-y1, gRNA-y2 and gRNA-y3 cut sites accompanying genomic insertion of the MCR-GFP element (gRNA-y1) or ERACRs (gRNA-y2 and gRNA-y3). C) Pie charts summarizing key e-CHACR performance parameters. D) Pie chart summary of F2 male and female progeny outcomes derived from F1 ERACR-2/MCR-GFP master females separated by inferred donor (w = red shaded sectors) versus receiver (wa: peach = ERACR copied, green = MCR-GFP retention; gray =MCR-GFP deleted) chromosomes.

References

    1. Adelman Z, Akbari O, Bauer J, Bier E, Bloss C, Carter SR, Callender C, Denis AC, Cowhey P, Dass B, et al. (2017). Rules of the road for insect gene drive research and testing. Nat Biotechnol 35, 716–718. - PMC - PubMed
    1. Barker JS (1962). Studies of Selective Mating Using the Yellow Mutant of Drosophila Melanogaster. Genetics 47, 623–640. - PMC - PubMed
    1. Bastock M (1956). A gene mutation which changes a behaviour pattern. Evolution 10, 421–439.
    1. Bozas A, Beumer KJ, Trautman JK, and Carroll D (2009). Genetic analysis of zinc-finger nuclease-induced gene targeting in Drosophila. Genetics 182, 641–651. - PMC - PubMed
    1. Brunner E, Yagi R, Debrunner M, Beck-Schneider D, Burger A, Escher E, Mosimann C, Hausmann G, and Basler K (2019). CRISPR-induced double-strand breaks trigger recombination between homologous chromosome arms. Life Sci Alliance 2. - PMC - PubMed

Publication types

Substances