. 2021 Feb 3;29(2):822-837.
doi: 10.1016/j.ymthe.2020.09.001. Epub 2020 Sep 5.

In Vivo HSC Gene Therapy Using a Bi-modular HDAd5/35++ Vector Cures Sickle Cell Disease in a Mouse Model

Affiliations

In Vivo HSC Gene Therapy Using a Bi-modular HDAd5/35++ Vector Cures Sickle Cell Disease in a Mouse Model

Chang Li et al. Mol Ther. .

Abstract

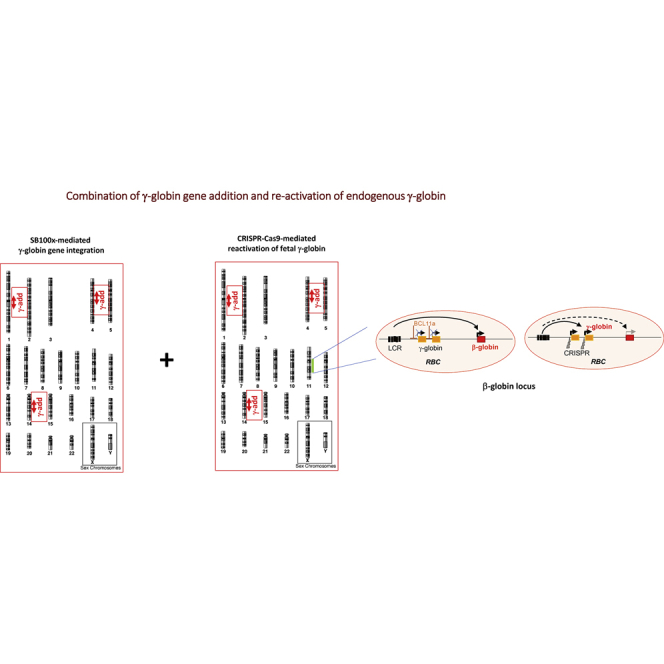
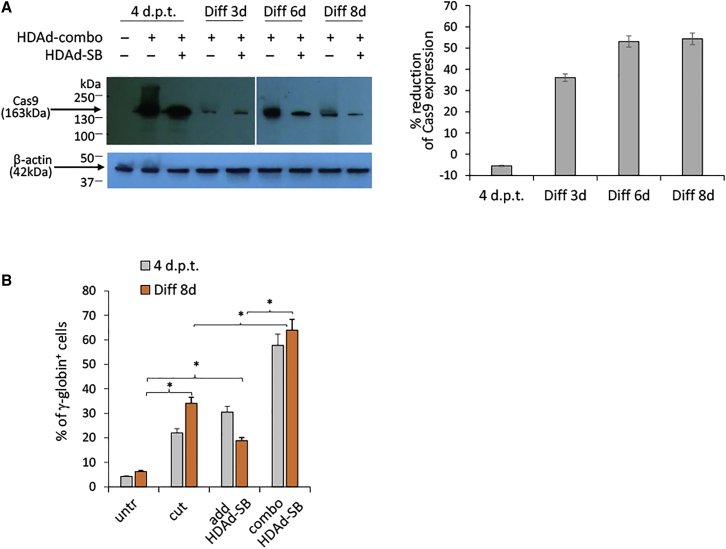
We have recently reported that, after in vivo hematopoietic stem cell/progenitor (HSPC) transduction with HDAd5/35++ vectors, SB100x transposase-mediated γ-globin gene addition achieved 10%-15% γ-globin of adult mouse globin, resulting in significant but incomplete phenotypic correction in a thalassemia intermedia mouse model. Furthermore, genome editing of a γ-globin repressor binding site within the γ-globin promoter by CRISPR-Cas9 results in efficient reactivation of endogenous γ-globin. Here, we aimed to combine these two mechanisms to obtain curative levels of γ-globin after in vivo HSPC transduction. We generated a HDAd5/35++ adenovirus vector (HDAd-combo) containing both modules and tested it in vitro and after in vivo HSPC transduction in healthy CD46/β-YAC mice and in a sickle cell disease mouse model (CD46/Townes). Compared to HDAd vectors containing either the γ-globin addition or the CRISPR-Cas9 reactivation units alone, in vivo HSC transduction of CD46/Townes mice with the HDAd-combo resulted in significantly higher γ-globin in red blood cells, reaching 30% of that of adult human α and βS chains and a complete phenotypic correction of sickle cell disease.


Figures

None
Graphical abstract
Figure 1
Figure 1
HDAd5/35++ Vectors Used in This Study γ-globin gene addition is achieved through the SB100x transposase system consisting of a transposon vector with IRs and frt sites flanking the expression cassette and a second vector (HDAd-SB) that provides the SB100x and Flpe recombinase in trans. The transposon cassette for random integration consists of a mini β-globin LCR/promoter for erythroid-specific expression of human γ-globin. The 3′ UTR serves for mRNA stabilization in erythroid cells. The γ-globin expression unit is separated by a chicken globin HS4 insulator from a cassette for mgmtP140K expression from a ubiquitously active PGK promoter. The CRISPR-Cas9 cassette in the HDAd-CRISPR and HDAd-combo vectors contains a U6 promoter-driven sgRNA specific to the BCL11A binding site within the HBG1/2 promoter and a SpCas9 under EF1α promoter control. Expression of Cas9 in HDAd producer cells is suppressed by a microRNA (miRNA) regulation system. In the HDAd-combo, the CRISPR-Cas9 cassette is placed outside the transposon so that it will be lost upon Flpe/SB100x-mediated integration (see Figure S1). Data are presented as mean ± SD.
Figure 2
Figure 2
In Vitro Studies with HUDEP-2 Cells to Analyze Cas9 and γ-Globin Expression (A) Analysis of Cas9 expression by western blot. HUDEP-2 cells were transduced with HDAd-combo alone and in combination with HDAd-SB (i.e., the vector that provides Flpe and SB100x in trans). In vitro ED was started 4 days post-transduction and continued for 8 days (ED allows for γ-globin expression). Left panel: representative western blot using Cas9 and β-actin antibodies as probes. Right panel: summary of normalized Cas9 signals. The bars compare Cas9 with and without HDAd-SB coinfection, i.e., the reduction of Cas9 by the Flpe/SB100x mechanism. (B) Analysis of γ-globin expression by flow cytometry. HUDEP-2 cells were transduced with HDAd-CRISPR (“cut”), HDAd-SB-add (“add”)+HDAd-SB, or HDAd-combo (“combo”)+HDAd-SB and analyzed at the indicated time points. d.p.t., days post-transduction. Diff, differentiation. Data are presented as mean ± SD. ∗p < 0.05.
Figure 3
Figure 3
γ-Globin Expression Studies after In Vivo Transduction of CD46/β-YAC Mice (A) Schematic of the experiment. HSPCs were mobilized by s.c. injections of human recombinant GCSF for 4 days followed by one s.c. injection of AMD3100. 30 and 60 min after AMD3100 injection, animals were intravenously injected with a 1:1 mixture of the following HDAd vectors (total, 4 × 1010 vps): HDAd-combo+HDAd-SB, HDAd-SB-add+HDAd-SB, and HDAd-cut. Mice were treated with immunosuppressive (IS) drugs for the next 4 weeks to avoid immune responses against the human γ-globin and MGMT. At week 4, O6-BG/BCNU treatment was started and repeated every 2 weeks (3 times). With each cycle, the BCNU concentration was increased from 5 mg/kg to 7.5mg/kg, to 10 mg/kg. At week 18, animals were sacrificed for tissue sample analysis and harvest of bone marrow Lin cells for secondary transplantation into lethally irradiated C57BL/6 mice, which were then followed for another 16 weeks. (B) Detection of γ-globin expression in peripheral red blood cells (RBCs) by flow cytometry. (C) γ-globin protein levels measured by HPLC. Right panel: chromatogram of RBC lysates (before treatment and week 18) with mouse β-major globin, human β-globin, reactivated human Aγ, and added γ-globin chains indicated. Left panel: summary of HPLC data. Indicated is the percentage of total γ-globin relative to human β-globin for CD46/β-YAC mice treated with the “cut,” “add,” and “combo” vectors. ∗p < 0.05. n.s., not significant. (D) γ-globin chains relative to mouse β-major globin. (E) γ-globin mRNA expression relative to mouse β-major globin mRNA expression (measured by qRT-PCR). (F) Percent HBG1/2 target site cleavage by CRISPR-Cas9. Genomic DNA from PBMCs and bone marrow MNCs harvested at week 18 from in vivo “cut” and “combo” transduced mice were subjected to T7EI assay. Indicated is the summary of data from Figure S2. ∗p < 0.05. (G) Integrated VCNs measured in bone marrow HSPCs at week 18 after transduction with the “add” and “combo” vectors. The difference between the groups is not significant. Data are presented as mean ± SD.
Figure 4
Figure 4
Analysis of Secondary Recipients of Lin Cells from CD46/β-YAC In Vivo Transduced Mice (A) Percentage of human γ-globin-expressing peripheral blood RBCs. (B) Level of γ-globin protein relative to human β-globin at week 16 after transplantation. (C) Level of γ-globin protein relative to mouse β-major globin. (D) Lineage-positive cell composition of MNCs from blood, spleen, and bone marrow at week 16 after transplantation compared to naive control mice. Data are presented as mean ± SD. *p<0.05
Figure 5
Figure 5
Generation and Characterization of Triple Transgenic CD46/Townes Mice as a Model for SCD (A) Breeding of CD46/Townes mice. Townes mice (hα/hα::βAS) were bred over three rounds with CD46 transgenic mice. Animals that were homozygous for CD46, HbS, and HBA genes were used for in vivo transduction studies. (B) Peripheral blood smear of CD46/Townes mice with typical features of the human disease, including anisopoikilocytosis, polychromasia (green arrows), sickled cells, and fragmented cells (orange arrows) Scale bar, 15 μm. (C) Hematological analysis of peripheral blood from CD46/Townes mice compared to parental healthy CD46-transgenic mice. Ret, reticulocyte; RBC, red blood cell, Hb, hemoglobin; HCT, hematocrit; WBC, white blood cell. All differences are significant (p < 0.05). (D) Splenomegaly in CD46/Townes mice. Indicated is the ratio of spleen to body weight in CD46tg and CD46/Townes mice. N = 3. Data are presented as mean ± SD. ∗p < 0.05; ∗∗p < 0.001.
Figure 6
Figure 6
γ-Globin Expression after In Vivo HSPC Transduction of CD46/Townes Mice Mice were mobilized, intravenously injected with HDAd-combo+HDAd-SB, and treated with O6-BG/BCNU as described for Figure 3. (A) γ-globin marking in peripheral RBCs measured by flow cytometry. The empty squares indicate marking in RBCs of untreated CD46/Townes mice. The vertical arrows indicate in vivo selection cycles. (B) γ-globin levels in RBCs measured at week 13 by HPLC. Left panel: summary of total γ-globin levels relative to human α-globin and βs-globin chains in individual mice. The empty squares indicate levels in RBCs of untreated CD46/Townes mice. Right panel: representative chromatograms of CD46/Townes mice before treatment (upper panel) and at week 13 after in vivo HSPC transduction with HDAd-combo+HDAd-SB (lower panel). The peaks for human α-, βs, reactivated Aγ, and added γ-globin are indicated. (C) Percentage of re-activated A+Gγ based on HPLC. (D) Percentage of total γ-globin mRNA relative to human α-globin and βs-globin mRNA in individual mice. (E) To compare the γ-globin mRNA levels in Townes/CD46 versus β-YAC/CD46 mice at week 13 after in vivo HSPC transduction with HDAd-combo and in vivo selection, comparative qRT-PCR was used. Results were calculated by the comparative Ct method using the formula 2ΔΔCt. Because Townes mice do not express mouse globin genes, RPL10 was used a housing keeping gene to normalize γ-globin mRNA levels. (F) Integrated VCNs measured in bone marrow HSPCs at week 13 after in vivo transduction. (G) HBG1/2 target site cleavage in total bone marrow MNCs, Lin cells, PBMCs, and splenocytes of CD46/Townes mice at week 13. The specific CRISPR-Cas9 cleavage fragments (255 and 110 bp) are indicated by arrows. The percentage of cleavage based on band signal quantification is indicated below each lane. Data are presented as mean ± SD.
Figure 7
Figure 7
Analyses of Vector Integration and Indels in CFU-Derived Colonies Derived Secondary Recipients Bone marrow Lin cells were isolated from secondary recipients at week 16 after transplantation of cells from in vivo transduced CD46/Townes mice. Lin cells were plated for progenitor colony assay, and 12 days later, well-separated colonies were picked, and DNA was isolated. Upper panel: vector integration was detected by PCR for human mgmtP140K. The presence of the 161-bp mgmtP140K amplicon indicates the occurrence of gene addition (detected in 29 out of 32 colonies). No amplicon was found in colonies #12, #24, and #26, indicating no mgmt/γ-globin integration. Lower panel: indels at the target site within the HBG promoter were examined by T7EI assay. Amplicons from colonies and untransduced bone marrow cells were mixed at a 1:1 ratio, hybridized, and treated with T7 endonuclease. The presence of cleaved bands indicates indels from CRISPR-mediated editing (in 24 of 32 colonies), while a single 365-bp band indicates no indels (8/32). Genomic DNA from untransduced mice and pooled CFU cells were used as negative and positive controls, respectively. In some colonies (e.g., #3, #6, #7, #31, and #32), the band pattern suggests that different indels occurred in the HBG1 and HBG2 promoter. See Figure S5.
Figure 8
Figure 8
Phenotypic Correction in Blood (A) Blood smears stained for reticulocytes by Brilliant cresyl blue. This dye stains remnants from nuclei and cytoplasmic organelles. (Quantification can be found in Figure 6C, first group of bars.) Scale bars, 20 μm. (B) Blood smears indicating the normocytic morphology of erythrocytes after HDAd-combo + HDAd-SB gene therapy. (C) Hematological analysis of peripheral blood. The differences between “CD46” and “CD46/Townes wk13 after combo” are not significant. Data are presented as mean ± SD. ∗∗p < 0.001; ns, non-significant.
Figure 9
Figure 9
Phenotypic Correction in Spleen and Liver (A) Tissue histology. Upper panel: iron deposition in spleen. Hemosiderin deposition was detected in spleen sections by Perl’s Prussian blue staining. Scale bars, 20 μm. Middle and lower panels: extramedullary hemopoiesis by hematoxylin and eosin staining in spleen and liver sections. Clusters of erythroblasts in the liver and megakaryocytes in the spleen of CD46/Townes mice are indicated by white arrows. Scale bars, 20 μm. (B) Representative images are shown.

Comment in

References

    1. Conley C.L., Weatherall D.J., Richardson S.N., Shepard M.K., Charache S. Hereditary persistence of fetal hemoglobin: a study of 79 affected persons in 15 Negro families in Baltimore. Blood. 1963;21:261–281. - PubMed
    1. Stamatoyannopoulos G., Wood W.G., Papayannopoulou T., Nute P.E. A new form of hereditary persistence of fetal hemoglobin in blacks and its association with sickle cell trait. Blood. 1975;46:683–692. - PubMed
    1. Kanter J., Thompson A.A., Mapara M.Y., Kwiatkowski J.L., Krishnamurti L., Schmidt M., Miller A.L., Pierciey F.J., Huang W., Ribeil J.-A. Updated Results From The Hgb-206 Study In Patients With Severe Sickle Cell Disease Treated Under A Revised Protocol With Lentiglobin Gene Therapy Using Plerixafor-Mobilised Haematopoietic Stem Cells. HemaSphere. 2019;3:754–755.
    1. Uchida N., Hsieh M.M., Raines L., Haro-Mora J.J., Demirci S., Bonifacino A.C., Krouse A.E., Metzger M.E., Donahue R.E., Tisdale J.F. Development of a forward-oriented therapeutic lentiviral vector for hemoglobin disorders. Nat. Commun. 2019;10:4479. - PMC - PubMed
    1. Anurathapan U., Pakakasama S., Mekjaruskul P., Sirachainan N., Songdej D., Chuansumrit A., Charoenkwan P., Jetsrisuparb A., Sanpakit K., Pongtanakul B. Outcomes of thalassemia patients undergoing hematopoietic stem cell transplantation by using a standard myeloablative versus a novel reduced-toxicity conditioning regimen according to a new risk stratification. Biol. Blood Marrow Transplant. 2014;20:2066–2071. - PMC - PubMed

Publication types

LinkOut - more resources