. 2020 Oct:60:102993.
doi: 10.1016/j.ebiom.2020.102993. Epub 2020 Sep 16.

Molecular mechanisms underlying altered neurobehavioural development of female offspring of mothers with polycystic ovary syndrome: FOS-mediated regulation of neurotrophins in placenta

Affiliations

Molecular mechanisms underlying altered neurobehavioural development of female offspring of mothers with polycystic ovary syndrome: FOS-mediated regulation of neurotrophins in placenta

Fangfang Wang et al. EBioMedicine. 2020 Oct.

Abstract

Background: This study explored the mechanisms underlying altered neurobehavioural development of female offspring born to mothers with polycystic ovary syndrome (PCOS).

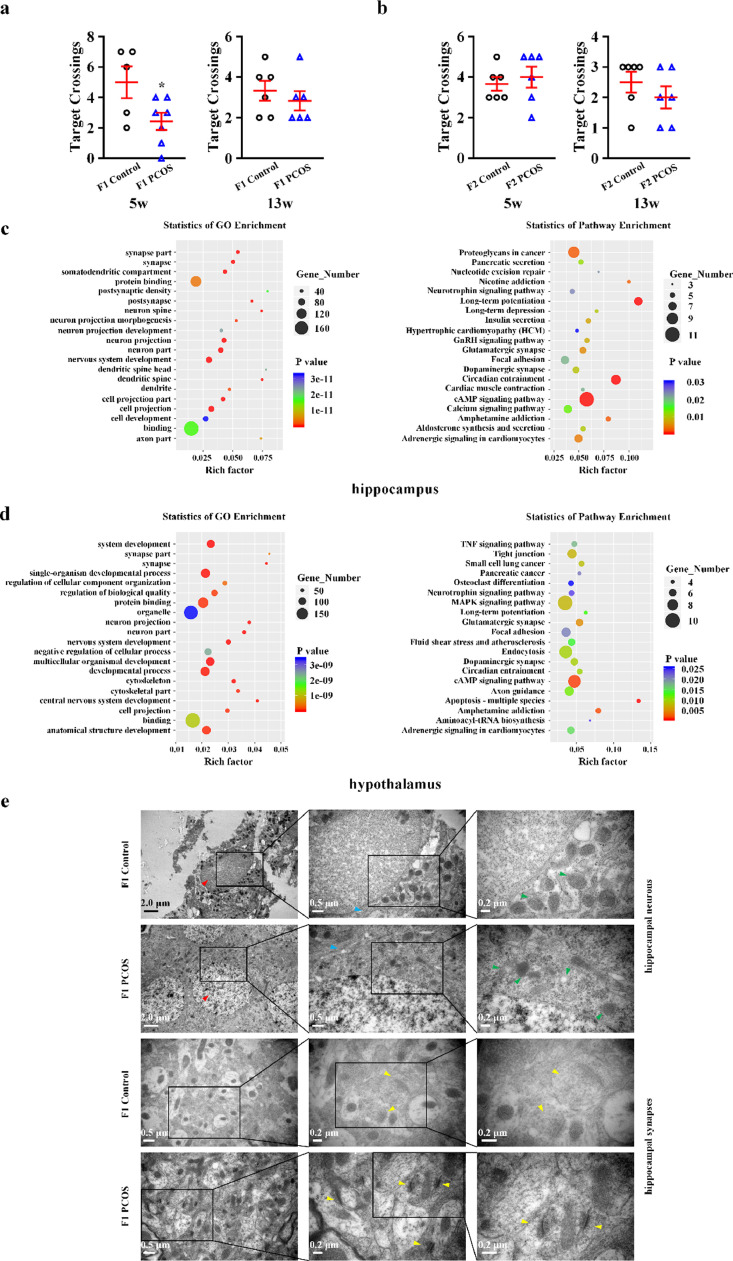
Methods: In total, 20 women with PCOS and 32 healthy women who underwent caesarean deliveries with a single female foetus were recruited. Infants were assessed with Dubowitz scoring. Swan71 cell line with stable FOS overexpression was used to verify the regulatory effects of FOS on brain-derived neurotrophic factor (BDNF) and nerve growth factor (NGF) expression. Learning and memory in female first-generation (F1) and second-generation (F2) offspring in a rat model of PCOS was tested using the Morris water maze at puberty and adulthood. Transcriptome analysis of pubertal hippocampi and hypothalami of female F1 offspring was conducted.

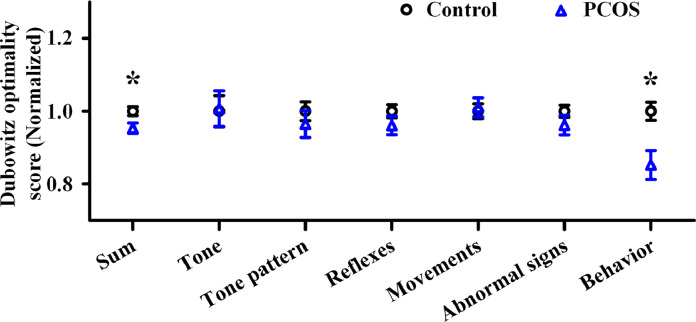
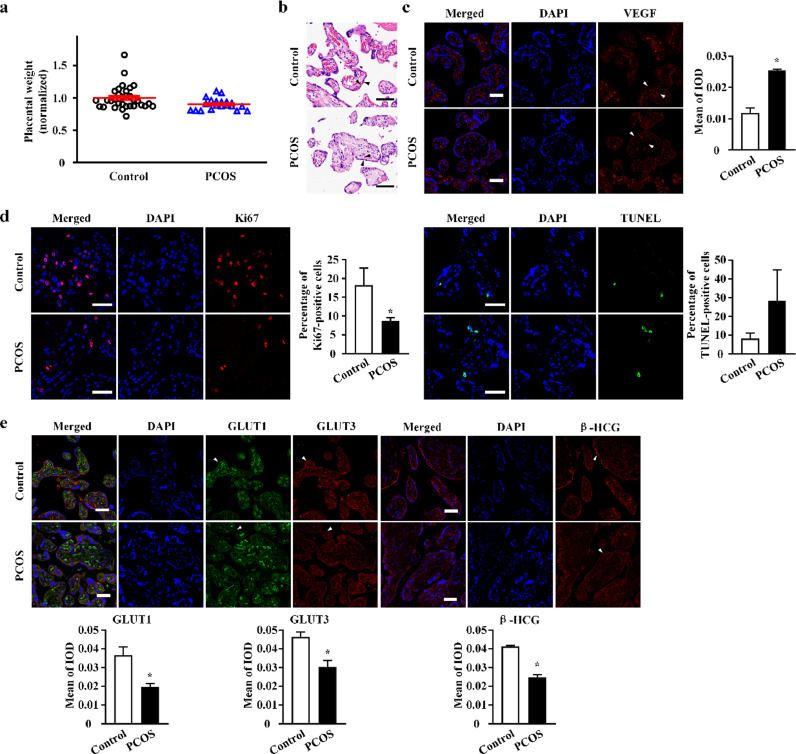
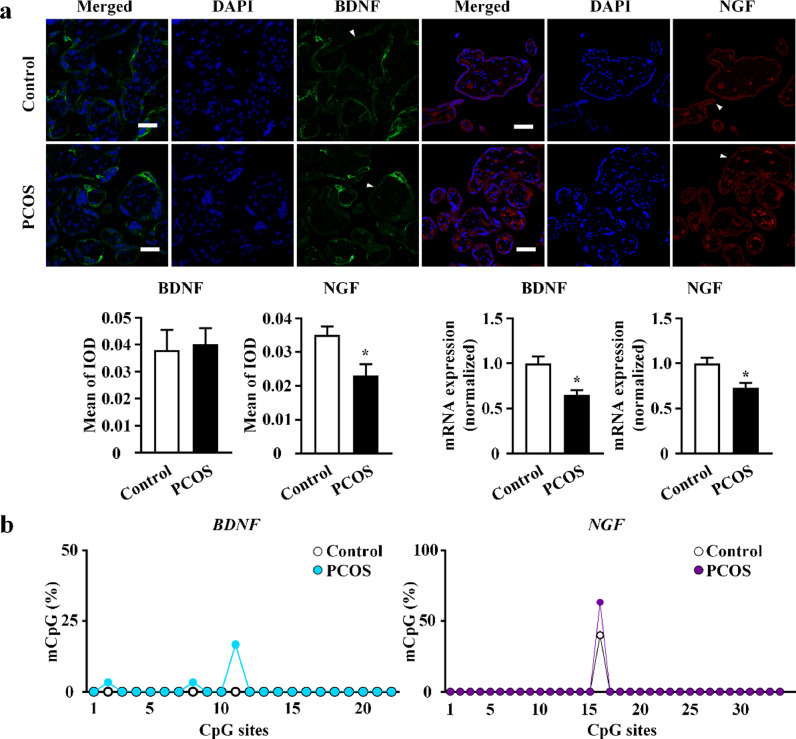
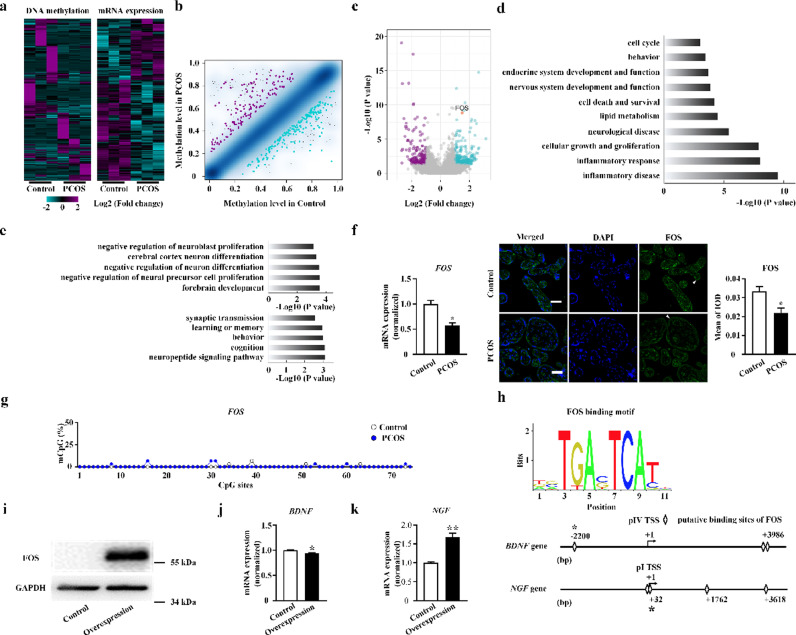
Findings: Total score and behaviour subscales of Dubowitz scoring were significantly lower in female infants of women with PCOS. FOS and NGF protein levels were downregulated in placental villi of the PCOS group. FOS played a key role in BDNF inhibition and enhancing NGF in Swan71 cells. PCOS female F1 rats exhibited lower target crossing times during puberty when compared to controls. Transcriptome analysis revealed significant changes in hippocampal and hypothalamic neuronal pathways in female F1 rats at puberty.

Interpretation: FOS regulation of neurotrophins in the placenta negatively affects neurobehavioural development of female offspring of PCOS mothers.

Funding: This study was funded by the National Key R&D Program of China (2018YFC1004900 to F.Q. and F.W.) and the National Natural Science Foundation of China (81874480 to F.Q.; 81873837 to F.W.).

Keywords: FOS; Neurobehaviour; Neurotrophin; Offspring; Placenta; Polycystic ovary syndrome.


Conflict of interest statement

Declaration of Competing Interests The authors have no conflict of interest to declare.

Figures

Fig 1
Fig. 1
Neurological examination of female offspring in polycystic ovary syndrome (PCOS) and control group with Dubowitz optimality score. PCOS: n = 20; control: n = 32. Data were presented as mean ± SEM. *P < 0.05. PCOS, polycystic ovary syndrome.
Fig 2
Fig. 2
The alterations of placental functions in polycystic ovary syndrome (PCOS). (a) Placental weight (all placental lobes) of female offspring of women with PCOS (n = 20) compared to controls (n = 32). Data were presented as mean ± SEM. (b) Hematoxylin and eosin (H&E) staining of placental tissue. Black arrows point to syncytiotrophoblasts layer and fetal blood vessels. (c) Vascular endothelial growth factor (VEGF) protein expression in human placental fetal side of the women with PCOS and controls, as assessed by immunofluorescence with VEGF (red). White arrows point to syncytiotrophoblasts layer and fetal blood vessels. Bar plot shows the mean of integrated optical density (IOD) (n = 3 in each group). (d) Immunofluorescence staining of Ki-67 (red) and terminal deoxynucleotidyl transferase dUTP nick end labeling (TUNEL) (green), the markers for cellular proliferation and apoptosis, respectively, was performed on trophoblasts in placental villi of PCOS and control group. Bar plot shows the percentage of Ki67-positive cells and percentage of TUNEL-positive cells, respectively (n = 5 in each group). (e) Immunofluorescence staining of glucose transporters 1 (GLUT1) (green), glucose transporters 3 (GLUT3) (red), and beta-human chorionic gonadotropin (β-HCG) (red) were performed on trophoblasts in placental villi of PCOS and control group. The syncytiotrophoblasts layers are labeled with white arrows, and the results of protein quantification are shown by bar plots (n = 5 in each group). All scale bars are 50 μm. DAPI, 4’,6-diamidino-2-phenylindole. Bar plots in (c) and (e) represent the protein expression level on syncytiotrophoblasts. Data were presented as mean ± SEM. *P < 0.05, unpaired two-tailed Student's t tests.
Fig 3
Fig. 3
Brain derived neurotrophic factor (BDNF) and nerve growth factor (NGF) in placental villi. (a) Visualization of BDNF and NGF in placental villi of polycystic ovarian syndrome (PCOS) and control group by immunofluorescence with BDNF (green) and NGF (red). Nuclei were counterstained with 4′,6-diamidino-2-phenylindole (DAPI) (blue fluorescence). The syncytiotrophoblasts layers are labeled with white arrows, and the results of protein quantification are shown by bar plots (n = 5 in each group). All scale bars are 50 μm. BDNF and NGF mRNA expression level were quantified by real-time polymerase chain reaction (real-time PCR). PCOS: n = 20; control: n = 32. Data were presented as mean ± SEM. *P < 0.05, unpaired two-tailed Student's t tests. (b) The methylation status at the promoter region of BDNF (blue) and NGF (purple) genes in the placental villi from women with PCOS and controls using bisulfite genomic sequencing (BSP) (n = 3 in each group, significance was determined by Chi-square test).
Fig 4
Fig. 4
Identification of FOS and its regulation of neurotrophins in placenta of polycystic ovary syndrome (PCOS). (a) Heatmaps of the global DNA methylation in the promoter and gene expression data for placentae from women with PCOS and controls. (n = 3 in each group) (b) Scatter plot of global DNA methylation levels in placentae in controls (x-axis) compared to women with PCOS (y-axis). Point density is shown as blue shading; Peacock blue and purple dots indicate significant down-regulated and up-regulated cytosine phosphate guanine (CpG) sites associated with a methylation difference > 0.20. (c) Volcano plot to inspect differentially expressed genes in placentae from women with PCOS and controls, with fold change as the abscissa and -log10 (P value) as the ordinate. Peacock blue and purple splashes represent genes that significantly up or down regulated respectively. Gray splashes mean genes without significantly different expression. FOS gene is marked as red. (d) Gene Ontology (GO) terms enriched in differentially expressed genes in placentae from women with PCOS. (e) Neural GO terms enriched in differentially expressed gene (top) and methylated DNA (bottom) in placentae from women with PCOS. (f) FOS gene mRNA and protein expression levels in human placentae, as assessed by real-time polymerase chain reaction (real-time PCR) (PCOS: n = 20; control: n = 32) and immunofluorescence with FOS (green), and nuclear DNA (blue) labeling (n = 5 in each group). All scale bars are 50 μm. (g) The summary data of methylation status at the promoter region of FOS gene in the placental villi using bisulfite genomic sequencing (BSP) (n = 3 in each group, significance was determined by Chi-square test). (h) In silico analysis of the genomic DNA 5 kb upstream and downstream of BDNF (pIV) and NGF (pI) transcription start site (TSS). Detection of FOS (i) protein expression levels, BDNF (j) and NGF (k) mRNA expression levels in overexpression group (n = 3) and control group (n = 3). Data were presented as mean ± SEM. *P < 0.05, unpaired two-tailed Student's t tests.
Fig 5
Fig. 5
Neurobehavioural and cerebral changes in female offspring of polycystic ovary syndrome (PCOS) model rats. (a) Morris water maze test in PCOS female F1 (n = 5 in 5 week, n = 6 in 13 week) and controls (n = 7 in 5 week, n = 6 in 13 week). (b) Morris water maze test in PCOS female F2 (n = 6 in 5 week and 13 week) and controls (n = 6 in 5 week and 13 week). Data are presented as mean ± SEM. *P < 0.05, unpaired two-tailed Student's t tests. (c, d) The Gene Ontology (GO) and Kyoto Encyclopedia of Genes and Genomes (KEGG) enrichment scatter plot of differential alternative splicing (DAS) genes in hippocampus (c) and hypothalamus (d) of F1 pubertal female offspring. The x-axis indicates the rich factor, and the y-axis indicates the name of the term or pathway. The dot size means the gene number, and the dot color represents the P value. The top 20 GO terms and KEGG pathways were shown. (e) The morphological and ultrastructure study of hippocampus neurons and synapses of F1 pubertal female offspring with electron microscopy. The nuclear chromatin (red arrows), rough endoplasmic reticulum (blue arrows), mitochondria (green arrows) and synapses (yellow arrows) in hippocampus were observed.

Similar articles

Cited by

References

    1. Norman RJ, Dewailly D, Legro RS, Hickey TE. Polycystic ovary syndrome. Lancet. 2007;370(9588):685–697. - PubMed
    1. Puttabyatappa M, Cardoso RC, Padmanabhan V. Effect of maternal PCOS and PCOS-like phenotype on the offspring's health. Mol Cell Endocrinol. 2016;435:29–39. - PMC - PubMed
    1. Sha T, Wang X, Cheng W, Yan Y. A meta-analysis of pregnancy-related outcomes and complications in women with polycystic ovary syndrome undergoing IVF. Reprod Biomed Online. 2019 - PubMed
    1. Boomsma CM, Eijkemans MJ, Hughes EG, Visser GH, Fauser BC, Macklon NS. A meta-analysis of pregnancy outcomes in women with polycystic ovary syndrome. Hum Reprod Update. 2006;12(6):673–683. - PubMed
    1. Sir-Petermann T, Hitchsfeld C, Maliqueo M, Codner E, Echiburu B, Gazitua R. Birth weight in offspring of mothers with polycystic ovarian syndrome. Hum Reprod. 2005;20(8):2122–2126. - PubMed

MeSH terms