. 2021 Jan 6;29(1):291-307.
doi: 10.1016/j.ymthe.2020.08.018. Epub 2020 Sep 5.

NONO Inhibits Lymphatic Metastasis of Bladder Cancer via Alternative Splicing of SETMAR

Affiliations

NONO Inhibits Lymphatic Metastasis of Bladder Cancer via Alternative Splicing of SETMAR

Ruihui Xie et al. Mol Ther. .

Abstract

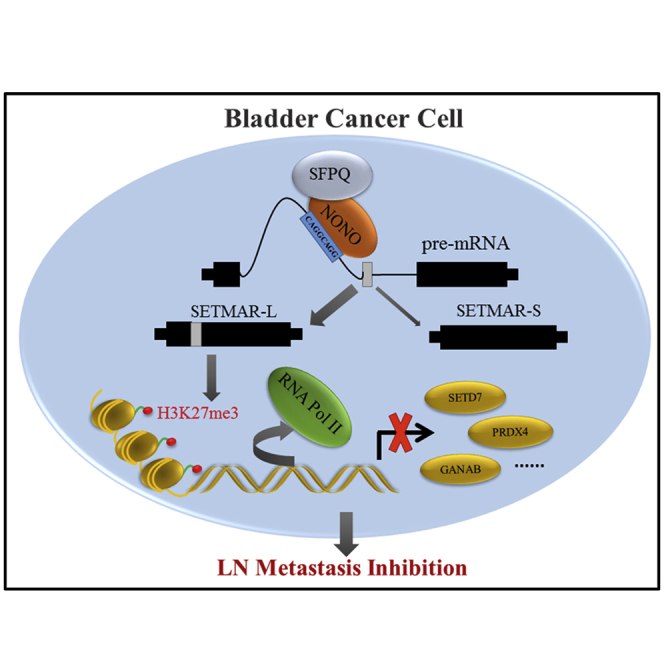
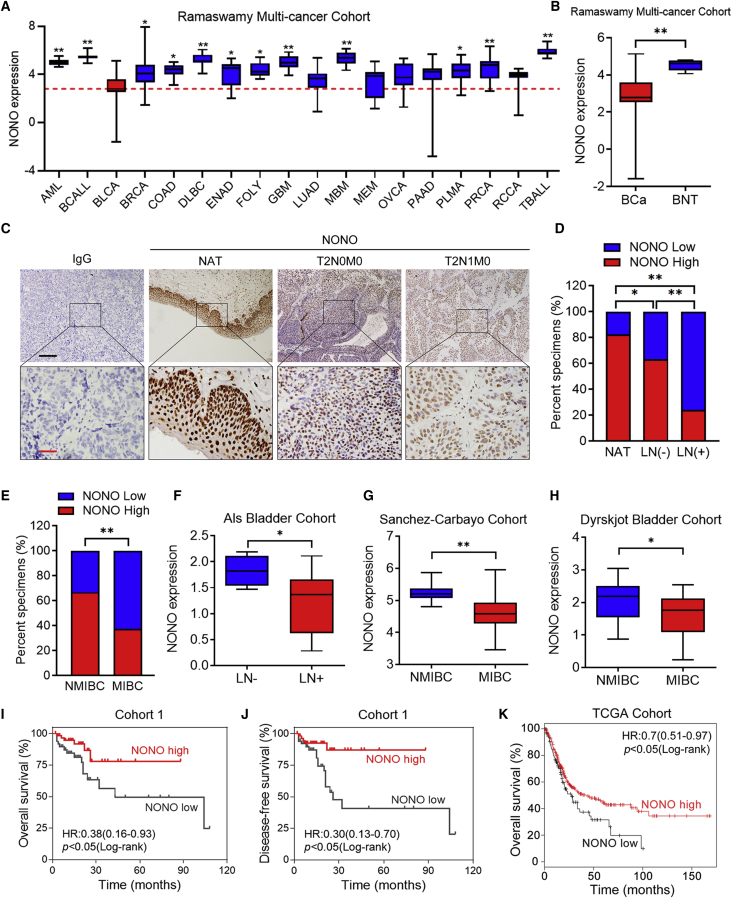
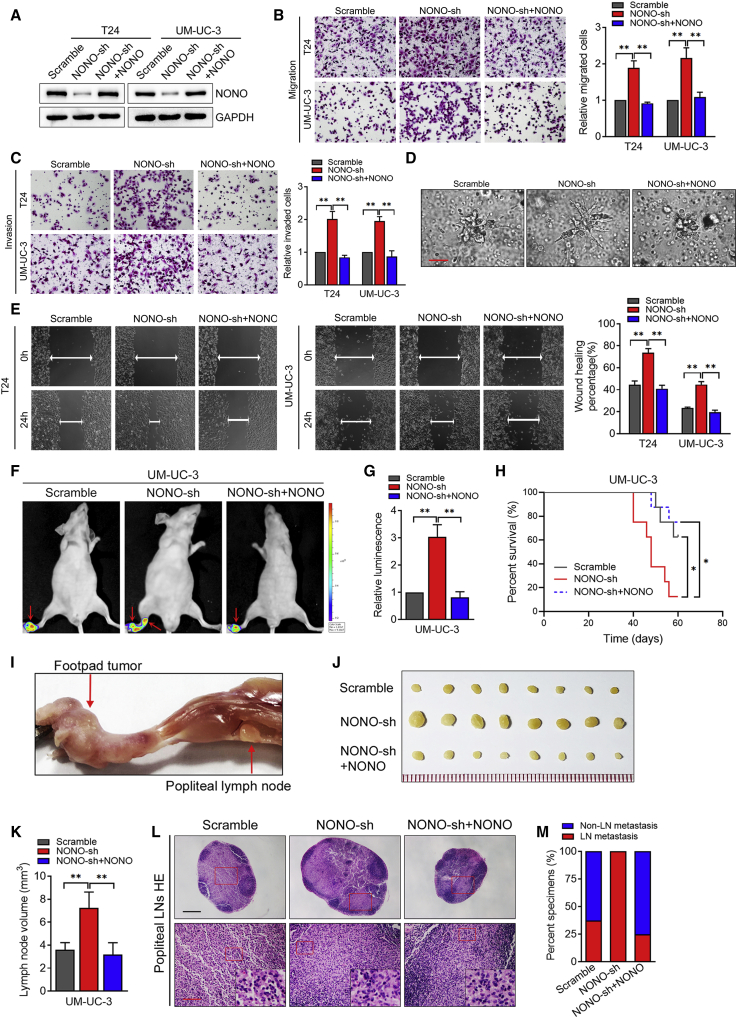
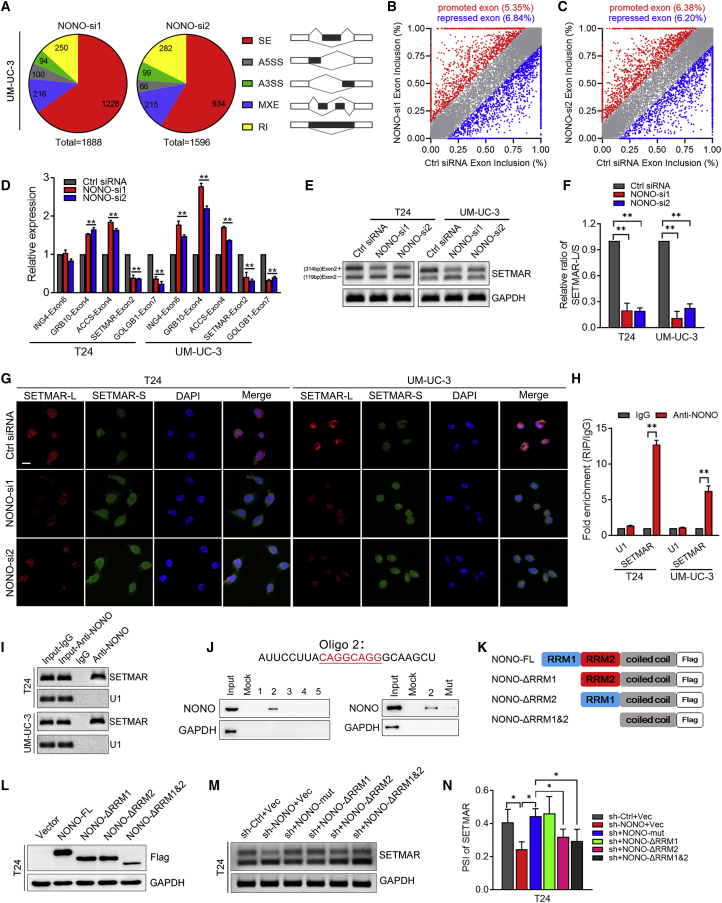
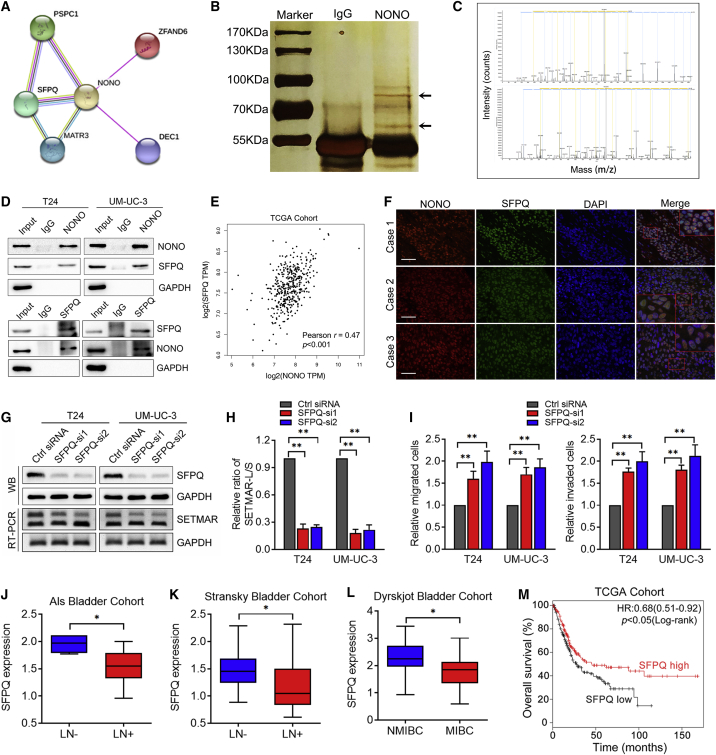
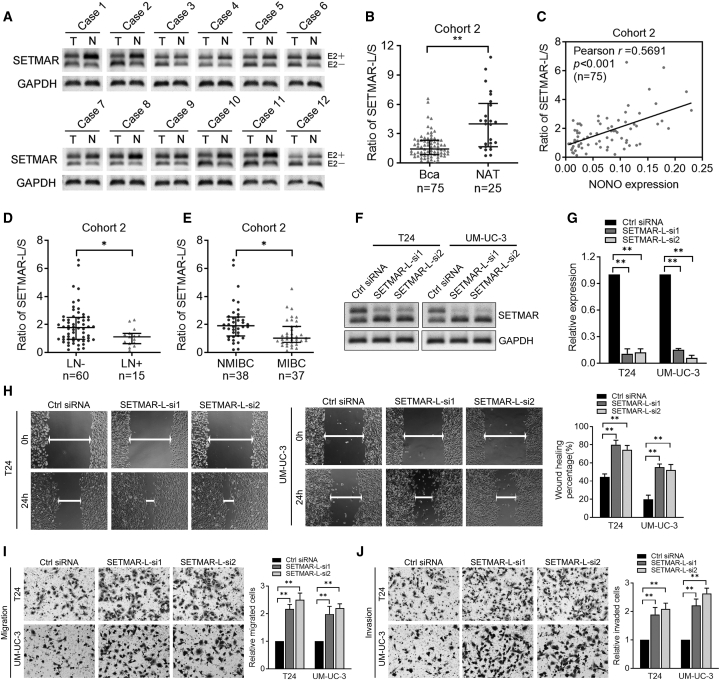
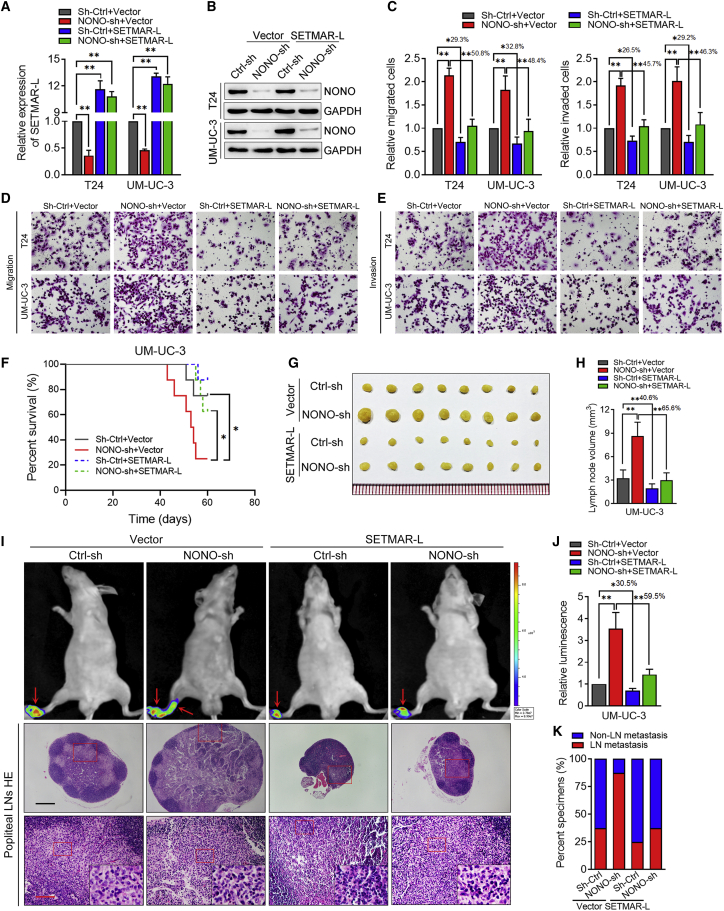
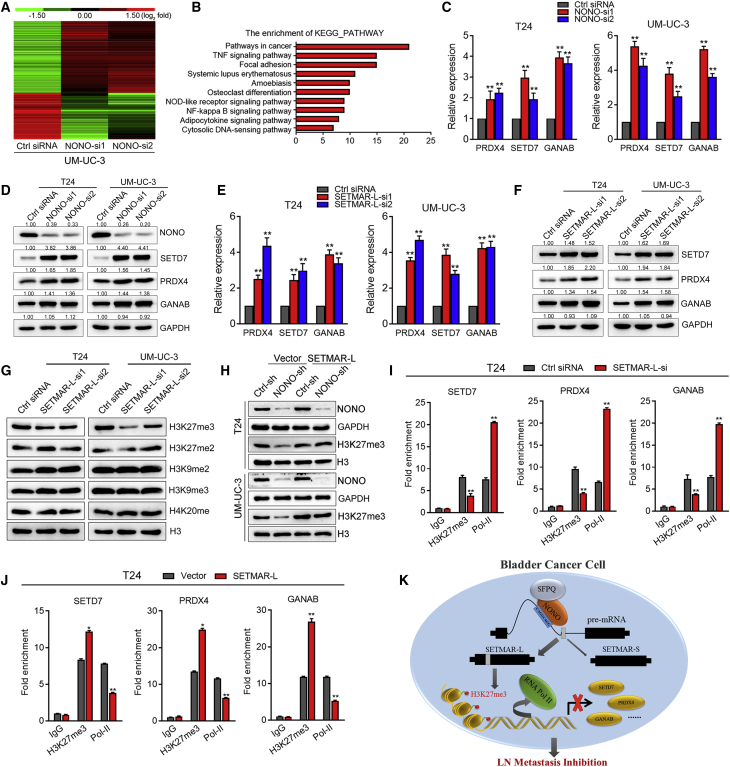
Bladder cancer patients with lymph node (LN) metastasis have an extremely poor prognosis and no effective treatment. The alternative splicing of precursor (pre-)mRNA participates in the progression of various tumors. However, the precise mechanisms of splicing factors and cancer-related variants in LN metastasis of bladder cancer remain largely unknown. The present study identified a splicing factor, non-POU domain-containing octamer-binding protein (NONO), that was significantly downregulated in bladder cancer tissues and correlated with LN metastasis status, tumor stage, and prognosis. Functionally, NONO markedly inhibited bladder cancer cell migration and invasion in vitro and LN metastasis in vivo. Mechanistically, NONO regulated the exon skipping of SETMAR by binding to its motif, mainly through the RRM2 domain. NONO directly interacted with splicing factor proline/glutamine rich (SFPQ) to regulate the splicing of SETMAR, and it induced metastasis suppression of bladder cancer cells. SETMAR-L overexpression significantly reversed the metastasis of NONO-knockdown bladder cancer cells, both in vitro and in vivo. The further analysis revealed that NONO-mediated SETMAR-L can induce H3K27me3 at the promotor of metastatic oncogenes and inhibit their transcription, ultimately resulting in metastasis suppression. Therefore, the present findings uncover the molecular mechanism of lymphatic metastasis in bladder cancer, which may provide novel clinical markers and therapeutic strategies for LN-metastatic bladder cancer.

Keywords: NONO; SETMAR; alternative splicing; bladder cancer; lymphatic metastasis.


Figures

None
Graphical abstract
Figure 1
Figure 1
NONO Correlates with LN Metastasis and Is a Prognostic Marker in BCa (A) NONO expression was analyzed in acute myeloid leukemia (AML) (n = 10), B cell acute lymphoblastic leukemia (BCALL) (n = 10), bladder cancer (BLCA) (n = 11), breast cancer (BRCA) (n = 12), colorectal adenocarcinoma (COAD) (n = 12), diffuse large B cell lymphoma (DLBC) (n = 11), endometrial adenocarcinoma (ENAD) (n = 10), follicular lymphoma (FOLY) (n = 11), glioblastoma (GBM) (n = 10), lung adenocarcinoma (LUAD) (n = 12), medulloblastoma (MBM) (n = 10), melanoma (MEM) (n = 10), ovarian cancer (OVCA) (n = 12), pancreatic adenocarcinoma (PAAD) (n = 11), pleural mesothelioma (PLMA) (n = 11), prostate cancer (PRCA) (n = 14), renal cell carcinoma (RCCA) (n = 11), and T cell acute lymphoblastic leukemia (TBALL) (n = 10). The red line represents the mean value of the NONO expression in BCa. (B) NONO expression was analyzed between BCa tissues (n = 11) and bladder normal tissues (BNTs, n = 7). (C) Representative IHC images of the NONO expression in the paraffin-embedded NAT and tumor sections of BCa, with or without LN metastasis. Scale bars: black, 200 μm; red, 50 μm. (D) IHC staining of cohort 1 shows the NONO expression among NAT (n = 35), LN-negative (n = 84), and LN-positive (n = 29) tumor tissues. (E) NONO expression was analyzed between NMIBC (n = 54) and MIBC (n = 59) tissues in cohort 1. (F–H) NONO mRNA expression was analyzed between LN-negative (n = 4) versus LN-positive (n = 13) tissues in the Als bladder cohort (F), NMIBC (n = 28) versus MIBC (n = 81) in the Sanchez-Carbayo cohort (G), and NMIBC (n = 28) versus MIBC (n = 13) in the Dyrskjot bladder cohort (H). (I and J) Kaplan-Meier curves for the OS (I) and DFS (J) of BCa patients with high versus low expression of NONO in cohort 1. Patients were divided into the NONO-low (n = 55) and NONO-high (n = 58) groups. (K) Kaplan-Meier curves for OS of BCa patients with high (n = 293) versus low (n = 111) expression of NONO in the TCGA cohort. Statistical significance was assessed using two-tailed t tests or one-way analysis of variance (ANOVA). ∗p < 0.05, ∗∗p < 0.01.
Figure 2
Figure 2
NONO Inhibits the Migration and Invasion of BCa Cells In Vitro and In Vitro (A) Western blot analysis of NONO expression levels in the scramble, NONO-sh, and NONO-sh+NONO re-expression groups. (B and C) Representative images and quantification of Transwell migration (B) and invasion (C) in T24 and UM-UC-3 cells. Cells were treated as indicated. (D) Representative images of the 3D culture of UM-UC-3 cells embedded in Matrigel for 4 days. Cells were treated as indicated. Scale bar, 50 μm. (E) Representative images and quantification of wound-healing assays using T24 and UM-UC-3 cells. Cells were treated as indicated. (F and G) Representative bioluminescence images (F) and histogram analysis (G) of the popliteal metastatic LNs from nude mice treated as indicated (n = 8 per group). The red arrow show the footpad tumor and metastatic popliteal LN. (H) Kaplan-Meier survival analysis of mice that were inoculated with the UM-UC-3 treatment as indicated. (I) Representative image of the popliteal LN metastasis model. (J and K) Representative images of the dissected popliteal LNs (J) and histogram analysis (K) of the LN volume. (L) Representative images of the H&E staining confirming the LN status. Scale bars: black, 500 μm; red, 100 μm. (M) Percentage of LN status in all groups (n = 8). Statistical significance was assessed using a two-tailed t test or one-way ANOVA. Error bars represent the standard deviations of three independent experiments. ∗p < 0.05, ∗∗p < 0.01.
Figure 3
Figure 3
The Validation of NONO-Mediated Splicing Events in BCa Cells (A) Quantification of AS events after UM-UC-3 cells were treated with two independent siRNAs that targeted NONO. AS events are classified into five categories: skipped exon (SE), alternative 5′ splice site (A5SS), alternative 3′ splice site (A3SS), mutually exclusive exon (MXE), and retained intron (RI). (B and C) Scatterplots show that the NONO knockdown affected the SE events (B, NONO-si1; C, NONO-si2). (D) Validation of candidate genes by qRT-PCR in T24 and UM-UC-3 cells. (E and F) Representative images (E) and quantification (F) of the SETMAR-L/SETMAR-S ratio in T24 and UM-UC-3 cells by RT-PCR. (G) Representative images of RNA-FISH assay. Scale bar, 20 μm. (H and I) Representative images (I) and quantification (H) of RT-PCR analysis of SETMAR from the RIP assay of T24 and UM-UC-3 cells using the anti-NONO antibody. RNA enrichment was determined relative to the non-targeting IgG control. U1 was used as a non-specific control. (J) RNA pull-down assay was performed using potential binding sequences in the intron segment of SETAMR pre-mRNA and the mutation of the potential binding sequence. NONO was detected by western blot. GAPDH was detected as a non-specific control. (K) Schematic diagram of NONO domains and constructions of three NONO mutants: ΔRRM1 (deleting RRM1), ΔRRM2 (deleting RRM2), and ΔRRM1&ΔRRM2 (deleting RRM1 and RRM2). All mutants were FLAG tagged. (L) Western blot of exogenous NONO and its mutants using the anti-FLAG antibody. (M and N) Representative images (M) and quantification (N) of RT-PCR analysis of SETMAR-L/SETMAR-S PSI in T24 cells with NONO knockdown, and re-overexpression of NONO deletion mutants. Statistical significance was assessed using a two-tailed t test or one-way ANOVA. Error bars represent the standard deviations of three independent experiments. ∗p < 0.05, ∗∗p < 0.01.
Figure 4
Figure 4
NONO Interacts with SFPQ to Regulate SETMAR Splicing in BCa (A) Predicted interacting proteins of NONO through GeneCards. (B) Co-immunoprecipitation using anti-NONO or control IgG antibody, followed by sliver staining. The black arrows show the position of SFPQ (above) and NONO (below). (C) Mass spectrometry (MS) identification of NONO-interacting proteins. (D) Co-immunoprecipitation analysis shows the interaction between endogenous NONO and SFPQ. (E) Pearson correlations between the expression of NONO and SFPQ in TCGA cohort. (F) Representative immunofluorescence images of NONO and SFPQ localization in BCa patient tissues. Scale bars, 100 μm. (G and H) Representative images (G) and quantification (H) of the SETMAR-L/SETMAR-S ratio after SFPQ knockdown in T24 and UM-UC-3 cells by RT-PCR. (I) Histogram analysis of migrated or invaded cells after SFPQ knockdown. (J–L) SFPQ expression analysis between LN-negative (n = 4) and LN-positive (n = 13) tissues in the Als bladder cohort (J), LN-negative (n = 38) and LN-positive (n = 12) tissues in the Stransky bladder cohort (K), and NMIBC (n = 30) and MIBC (n = 10) tissues in the Dyrskjot bladder cohort (L). (M) Kaplan-Meier curves for the OS of BCa patients with the high versus low expression of SFPQ in TCGA cohort. Patients were divided into SFPQ-low (n = 198) and SFPQ-high (n = 206) groups. Statistical significance was assessed using a two-tailed t test or one-way ANOVA. The error bars represent the standard deviations of three independent experiments. ∗p < 0.05, ∗∗p < 0.01.
Figure 5
Figure 5
SETMAR-L And SETMAR-S Were Associated with LN Metastasis of BCa (A) Representative images of SETMAR-L and SETMAR-S by RT-PCR in BCa tissues. (B) SETMAR-L/SETMAR-S expression analysis between NAT and BCa tissues in cohort 2. (C) Pearson correlations between mRNA expression of NONO and SETMAR-L/SETMAR-S in cohort 2. (D and E) SETMAR-L/SETMAR-S expression analysis in LN-positive versus LN-negative (D) and NMIBC versus MIBC (E) tissues in cohort 2. (F and G) Representative images (F) and quantification (G) of RT-PCR analysis of SETMAR isoform expression following SETMAR-L knockdown. (H) Representative images and quantification of wound-healing assays using T24 and UM-UC-3 cells after SETMAR-L knockdown. (I and J) Representative images and quantification of Transwell migration (I) and invasion (J) in T24 and UM-UC-3 cells after SETMAR-L knockdown. Statistical significance was assessed using a two-tailed t test or one-way ANOVA. Error bars represent the standard deviations of three independent experiments. ∗p < 0.05, ∗∗p < 0.01.
Figure 6
Figure 6
Restoration of SETMAR-L Reverses the Pro-metastasis Effects of the NONO Knockdown (A) Relative expression of SETMAR-L was detected by qPCR after T24 and UM-UC-3 cells were treated as indicated. (B) NONO expression was analyzed by western blot after T24 and UM-UC-3 cells were treated as indicated. (C–E) Representative images of migrated (D) and invaded (E) cells, and the quantification (C) after T24 and UM-UC-3 cells were treated as indicated. (F) Kaplan-Meier survival analysis of mice inoculated with UM-UC-3 cell treatment as indicated. (G and H) Representative images of dissected popliteal LNs (G) and histogram analysis of the LN volume (H). (I) Representative images of the bioluminescence and H&E staining, confirming the LN status. The red arrows show the footpad tumor and metastatic popliteal LN. Scale bars: black, 500 μm; red, 100 μm. (J) Histogram analysis of bioluminescence from the treated nude mice as indicated (n = 8 per group). (K) Percentage of LN status in all groups. Statistical significance was assessed using a one-way ANOVA, followed by a Dunnett’s test. Error bars represent the standard deviations of three independent experiments. ∗p < 0.05, ∗∗p < 0.01.
Figure 7
Figure 7
NONO Modulates the Gene Expression through SETMAR-L-Induced H3K27me3 (A) Heatmap representing the unsupervised hierarchical clustering of mRNA expression levels in UM-UC-3 cells transfected with control siRNA or NONO siRNAs. Red and green indicate high and low expression, respectively. (B) KEGG pathway analysis of expression-changed genes. (C and D) Expression of SETD7, PRDX4, and GANAB was detected after NONO knockdown by qPCR (C) and western blot (D). (E and F) Expression of SETD7, PRDX4, and GANAB was detected after SETMAR-L knockdown by qPCR (E) and western blot (F). (G) Histone methylation statuses were analyzed by western blot after SETMAR-L knockdown. (H) H3K27me3 expression was detected by western blot after cells were treated as indicated. (I and J) CHIP-qPCR of RNA polymerase II and H3K27me3 at the promotor region of SETD7, PRDX4, and GANAB following SETMAR-L knockdown (I) or overexpression (J). Two siRNAs in equal proportions were mixed when performing RNAi. (K) Schematic model of the mechanism underlying the role of NONO in BCa LN metastasis. Statistical significance was assessed using a two-tailed t test or one-way ANOVA. Error bars represent the standard deviations of three independent experiments. ∗p < 0.05, ∗∗p < 0.01.

References

    1. Torre L.A., Bray F., Siegel R.L., Ferlay J., Lortet-Tieulent J., Jemal A. Global cancer statistics, 2012. CA Cancer J. Clin. 2015;65:87–108. - PubMed
    1. Van Batavia J., Yamany T., Molotkov A., Dan H., Mansukhani M., Batourina E., Schneider K., Oyon D., Dunlop M., Wu X.-R. Bladder cancers arise from distinct urothelial sub-populations. Nat. Cell Biol. 2014;16:982–991. - PubMed
    1. Youssef R.F., Raj G.V. Lymphadenectomy in management of invasive bladder cancer. Int. J. Surg. Oncol. 2011;2011:758189. - PMC - PubMed
    1. Hautmann R.E., de Petriconi R.C., Pfeiffer C., Volkmer B.G. Radical cystectomy for urothelial carcinoma of the bladder without neoadjuvant or adjuvant therapy: long-term results in 1100 patients. Eur. Urol. 2012;61:1039–1047. - PubMed
    1. Zargar-Shoshtari K., Zargar H., Lotan Y., Shah J.B., van Rhijn B.W., Daneshmand S., Spiess P.E., Black P.C. A multi-institutional analysis of outcomes of patients with clinically node positive urothelial bladder cancer treated with induction chemotherapy and radical cystectomy. J. Urol. 2016;195:53–59. - PubMed

Publication types

MeSH terms