. 2021 Dec 15;90(12):829-842.
doi: 10.1016/j.biopsych.2020.06.030. Epub 2020 Jul 16.

Vulnerable and Resilient Phenotypes in a Mouse Model of Anorexia Nervosa

Affiliations

Vulnerable and Resilient Phenotypes in a Mouse Model of Anorexia Nervosa

Jeff A Beeler et al. Biol Psychiatry. .

Abstract

Background: Increased physical activity is a common feature of anorexia nervosa (AN). Although high activity levels are associated with greater risk of developing AN, particularly when combined with dieting, most individuals who diet and exercise maintain a healthy body weight. It is unclear why some individuals develop AN while most do not. A rodent model of resilience and vulnerability to AN would be valuable to research. Dopamine, which is believed to play a crucial role in AN, regulates both reward and activity and may modulate vulnerability.

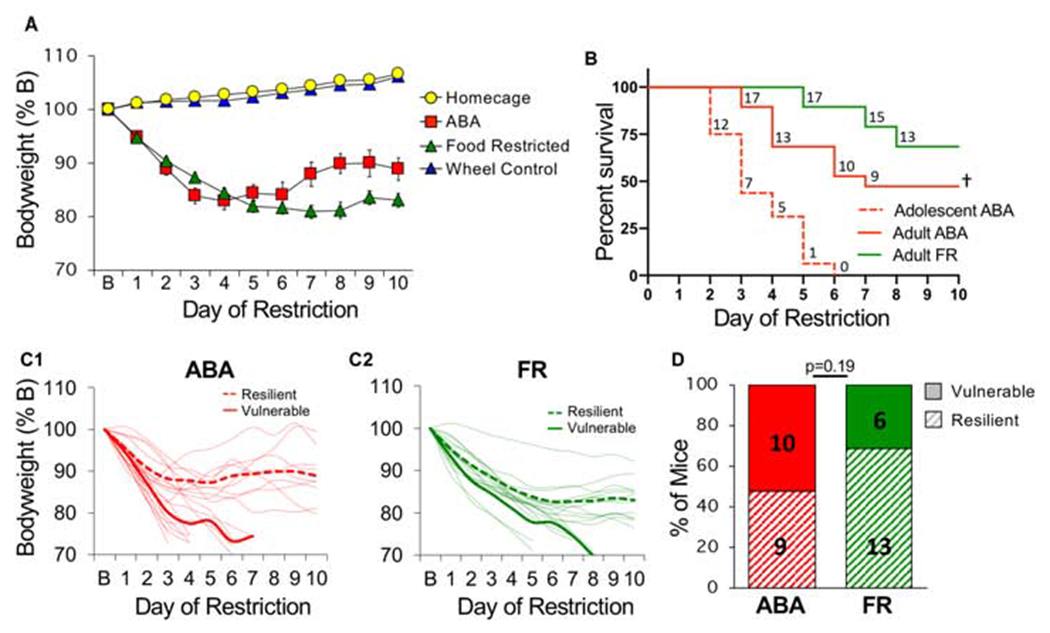
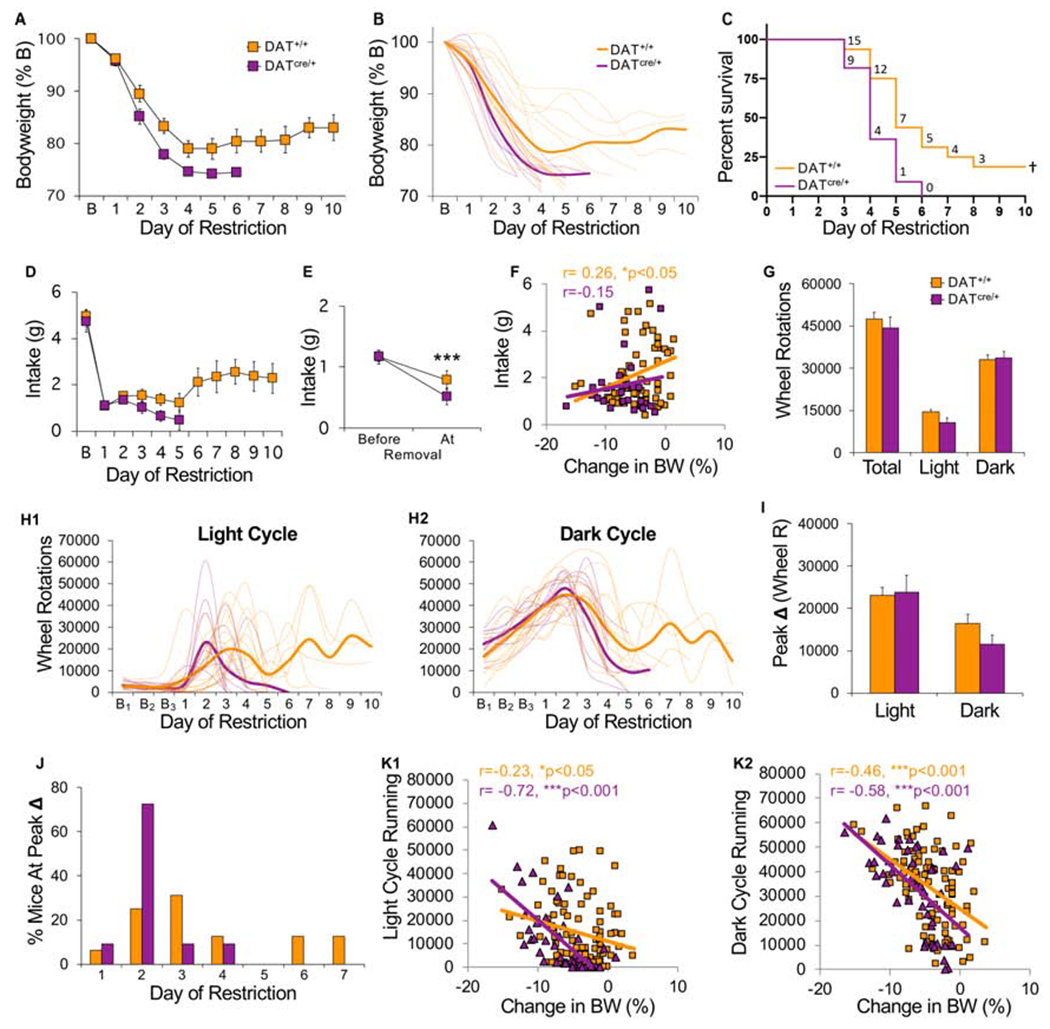
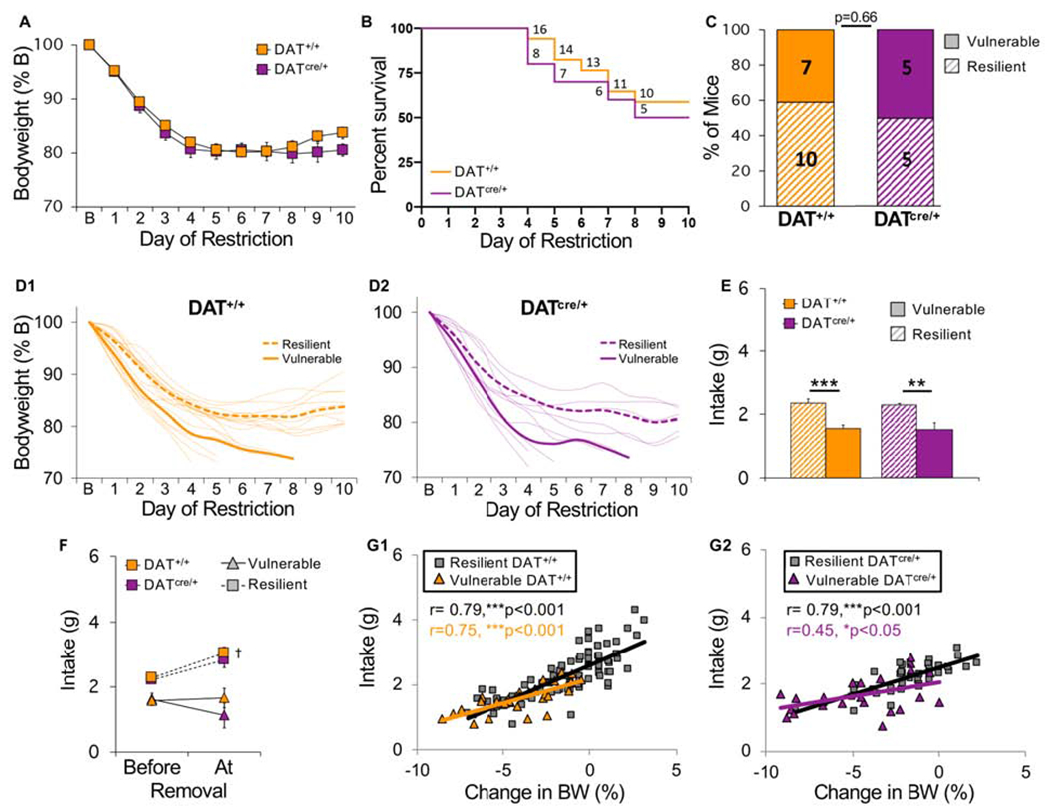
Methods: Adolescent and young adult female C57BL/6N mice were tested in the activity-based anorexia (ABA) model, with an extended period of food restriction in adult mice. ABA was also tested in dopamine transporter knockdown mice and wild-type littermates. Mice that adapted to conditions and maintained a stable body weight were characterized as resilient.

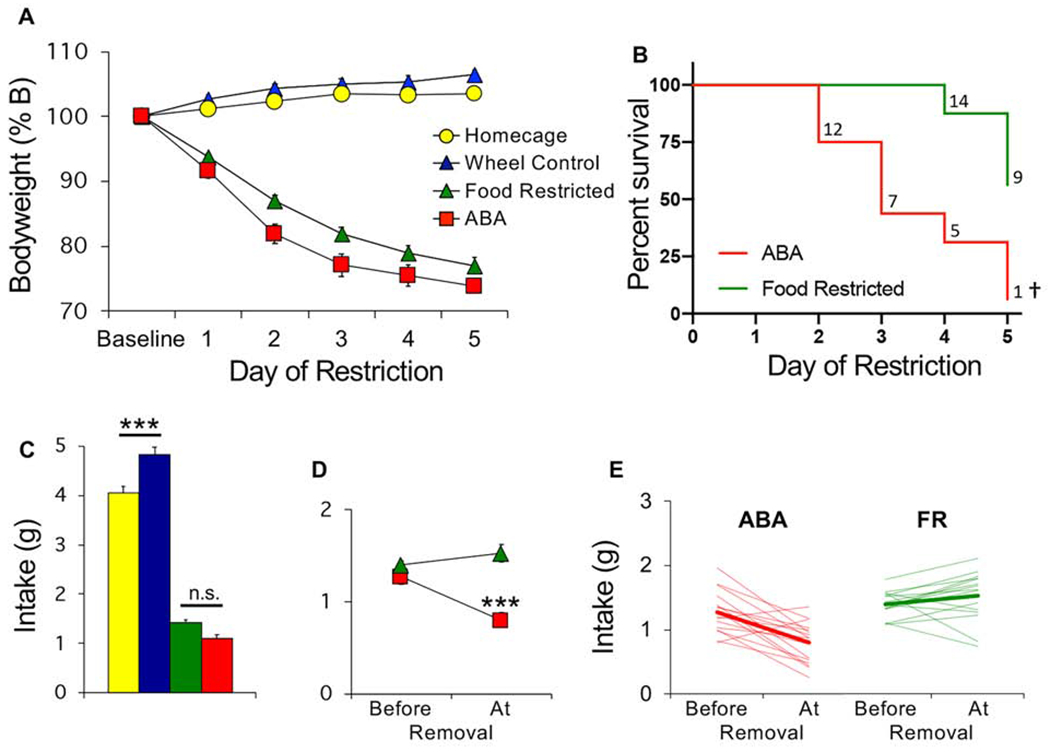
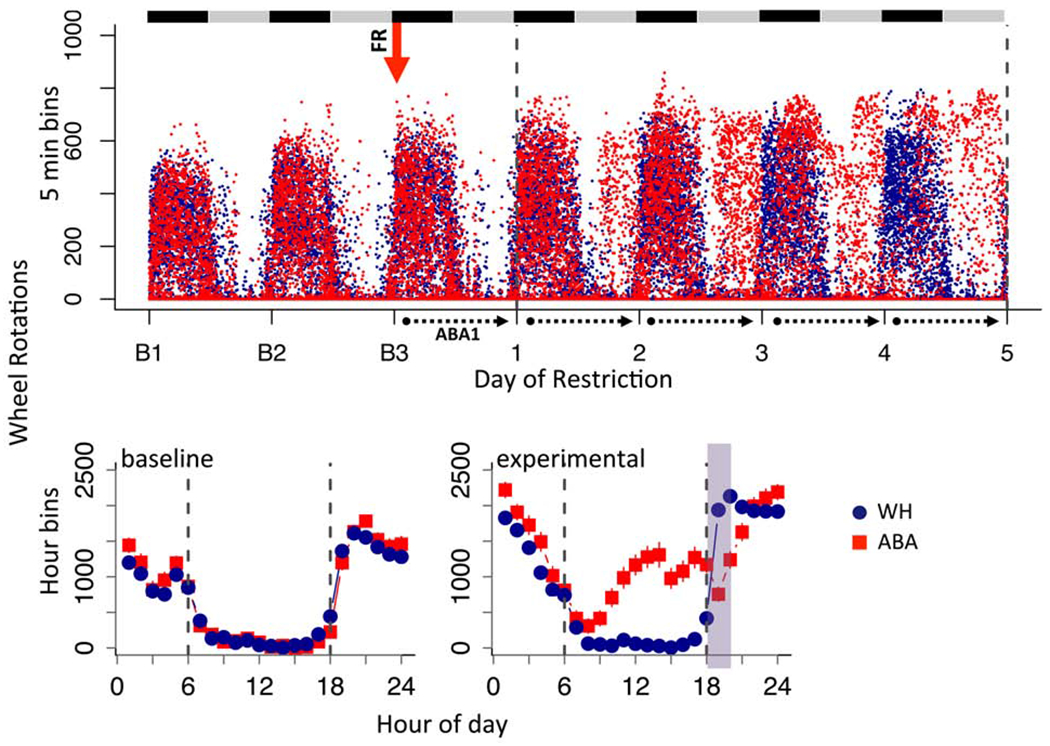
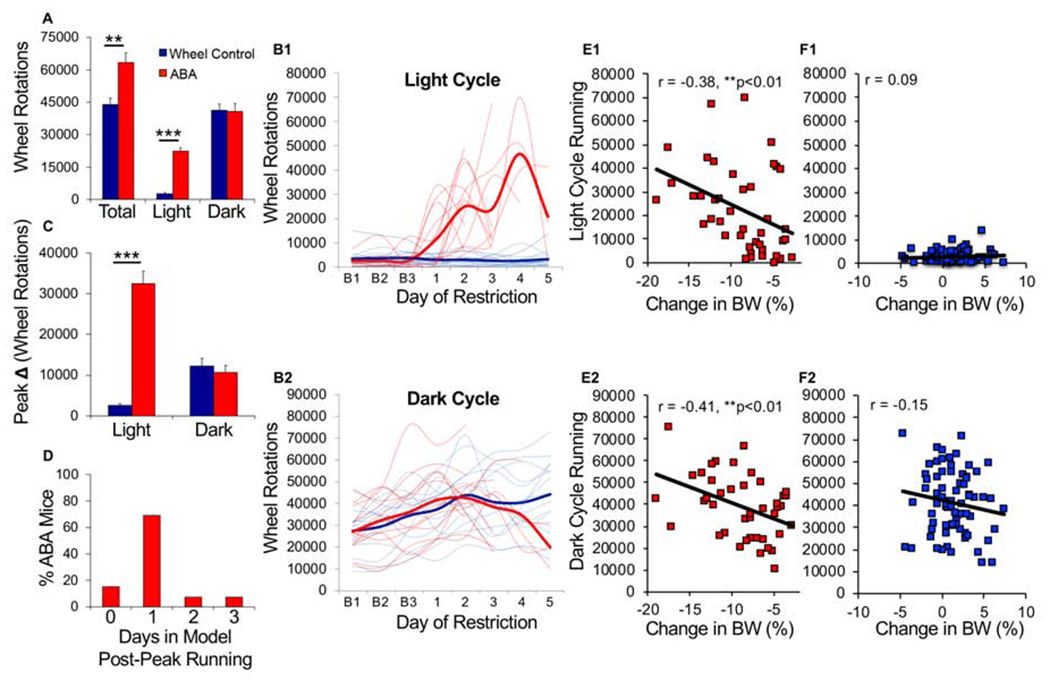
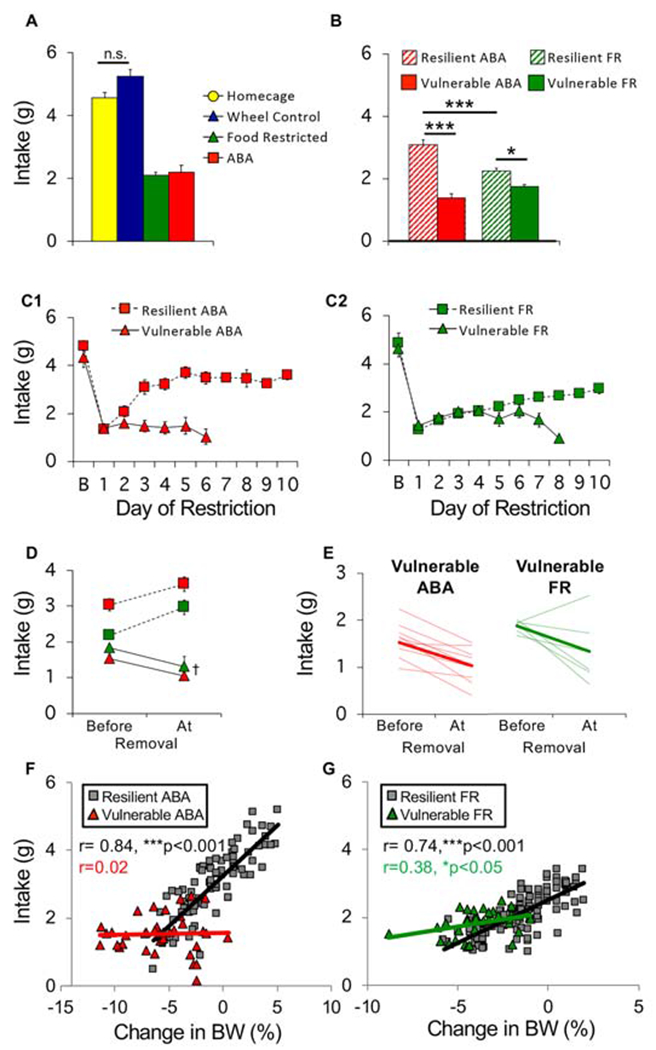
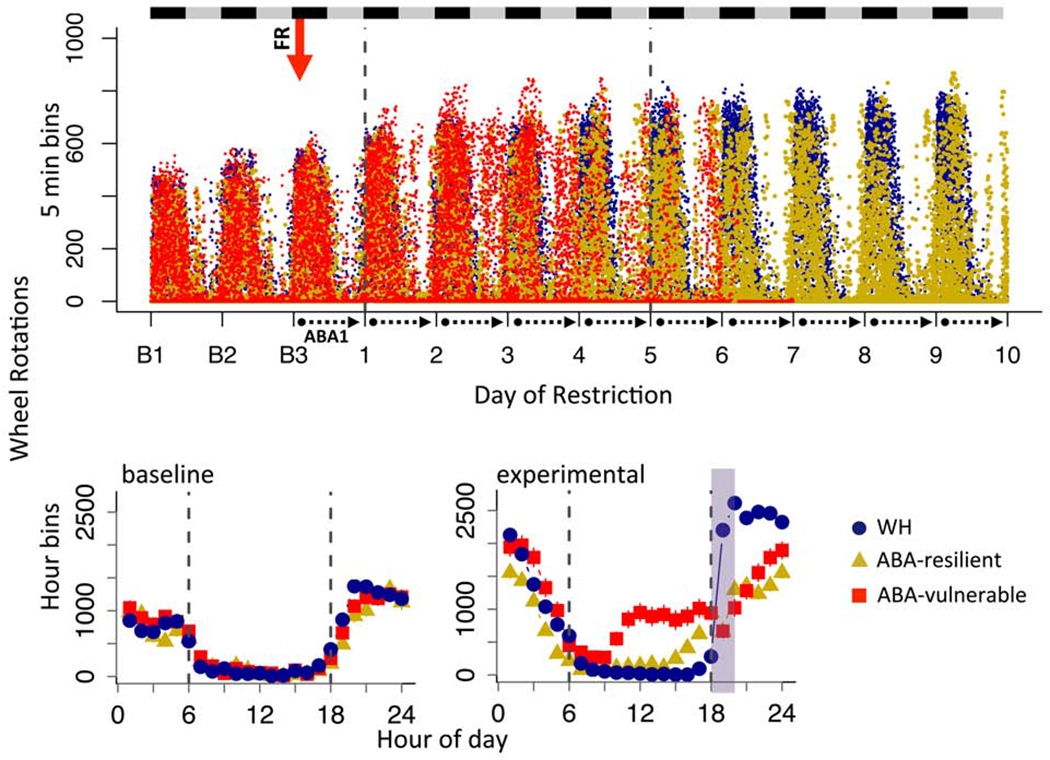
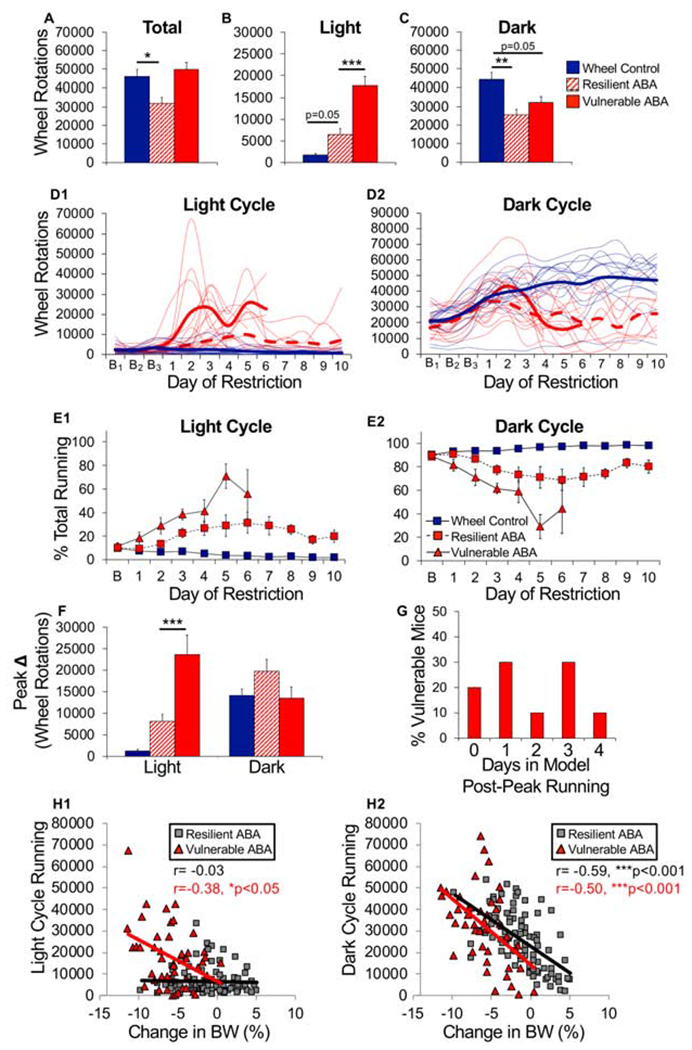
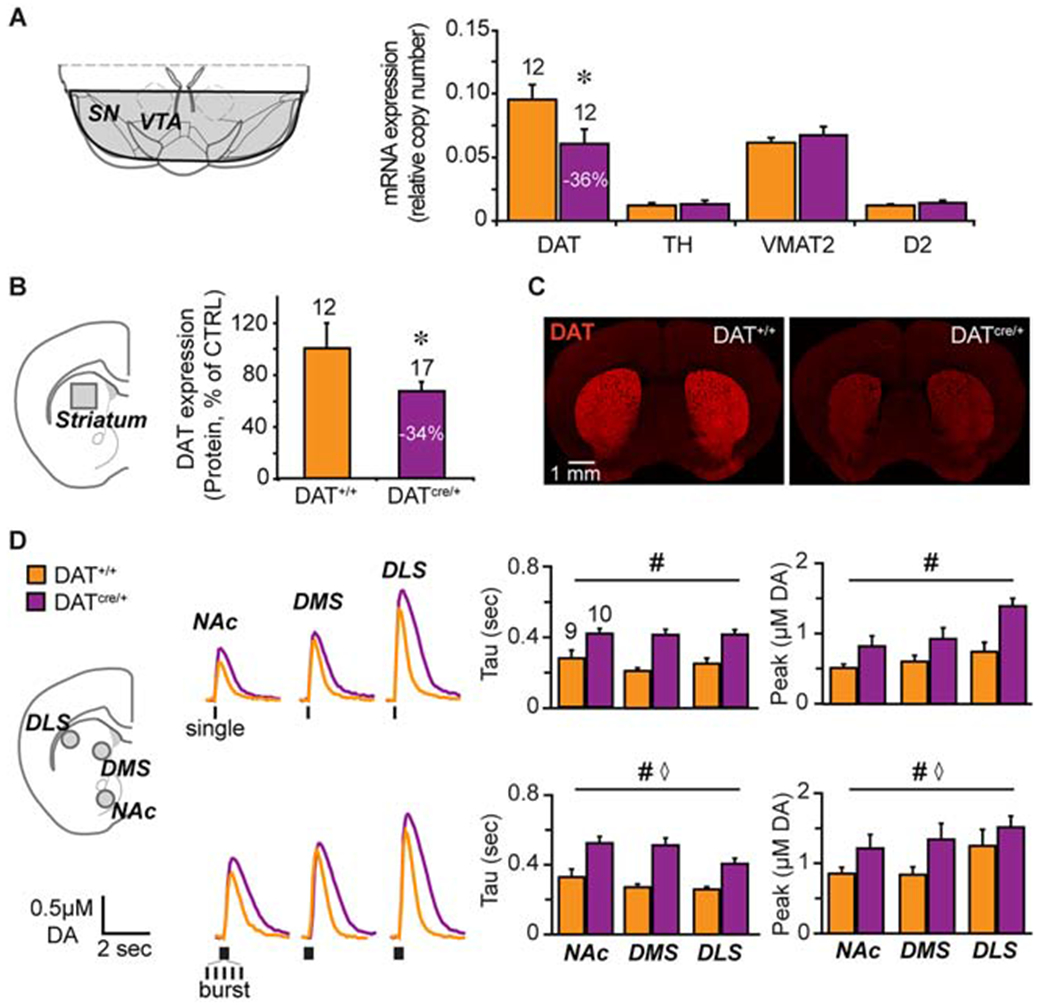
Results: In adults, vulnerable and resilient phenotypes emerged in both the ABA and food-restricted mice without wheels. Vulnerable mice exhibited a pronounced increase in running throughout the light cycle, which dramatically peaked prior to requiring removal from the experiment. Resilient mice exhibited an adaptive decrease in total running, appropriate food anticipatory activity, and increased consumption, thereby achieving stable body weight. Hyperdopaminergia accelerated progression of the vulnerable phenotype.

Conclusions: Our demonstration of distinct resilient and vulnerable phenotypes in mouse ABA significantly advances the utility of the model for identifying genes and neural substrates mediating AN risk and resilience. Modulation of dopamine may play a central role in the underlying circuit.

Keywords: Activity-based anorexia; Anorexia nervosa; Dopamine; Exercise; Food restriction; Hyperdopaminergic; Resilience; Starvation; Vulnerability.


Conflict of interest statement

FINANCIAL DISCLOSURES

All authors report no biomedical financial interests or potential conflicts of interest.

Figures

Figure 1.
Figure 1.
Adolescent female mice are vulnerable to activity-based anorexia. (A) Bodyweight across days of food restriction. (B) Survival curves for ABA and food restricted (FR) mice. Numbers indicate number of surviving mice that day. (C) Average food intake across 5 days of restriction. (D) Average and (E) individual (light traces) food intake of ABA and FR mice prior to removal versus the day of removal (bold lines in E show group average). n=16/group. ***p<0.001; Survival curves, p<0.001. Error bars, ±SEM.
Figure 2.
Figure 2.
ABA increases light cycle running in adolescent mice. (A) Dot plot of wheel running across days of experiment for all mice in 5 min bins. Black and gray bars indicate dark and light cycles, respectively. Red arrow indicates start of food restriction. Dotted lines demarcate data collection days under ABA. (B) Group averages in hour bins across 24 hour period averaged for (B1) baseline days and (B2) ABA experimental days. Dotted line marks light cycle between 6 (lights on) and 18 (lights off) hrs and green shading indicates when food was available. Error bars, ±SEM.
Figure 3.
Figure 3.
Abrupt increase in light cycle running precedes removal from model. (A) Average wheel activity across days of food restriction. (B) Wheel running of individual mice (light traces) and group mean (bold traces) across food restriction for (B1) light and (B2) dark cycle running. (C) Maximum increase in wheel running across two consecutive days (averaged by group) during the light cycle and dark cycle. (D) Histogram of number of days mice remained in model after maximum increase in light cycle running. (E-F) Correlation between light (top) or dark cycle running (bottom) and change in bodyweight the next day for ABA mice (E1-E2) and wheel control mice (F1-F2). Each symbol represents one animal on one experimental day. n=13 (ABA), n=15 (wheel controls); **p<0.01; ***p<0.001. Error bars, ± SEM.
Figure 4.
Figure 4.
Young adult female mice exhibit vulnerable and resilient phenotypes. (A) Bodyweight across days of food restriction. (B) Survival curves for each group. Dotted red is replot of adolescent survival from Fig. 1 for reference. Numbers indicate number of surviving mice that day. (C) Body weight of individual mice (light traces) across days of food restriction in (C1) ABA and (C2) FR groups. Group averages for resilient (dashed line) and vulnerable (solid line) mice are shown in bold. (D) Percent of vulnerable (solid) and resilient (hatched) mice within ABA and FR groups (number of animals is indicated inside bars). n=19 (ABA), n=19 (FR), n=12 (homecage), n=14 (wheel controls). Survival curves, difference between adolescent and adult ABA, p<0.0001. Error bars, ± SEM.
Figure 5.
Figure 5.
Resilient mice adapt food intake. (A) Average food intake across 10 days of restriction. (B) Average food intake of vulnerable (solid) and resilient (hatched) mice in ABA and food restricted (FR) groups. (C) Daily food intake of (C1) ABA and (C2) FR mice across days of restriction. (D) Average and (E) individual (light traces) food intake of ABA and FR mice prior to removal versus the day of removal (bold lines in E show group average). Correlation between consumption during restricted access to food and changes in body weight the next day for (F) ABA and (G) FR mice. Each symbol represents one animal on one experimental day. n=9 (resilient ABA), n=10 (vulnerable ABA), n=13 (resilient FR), n=6 (vulnerable FR), n=12 (homecage), n=14 (wheel controls). *p<0.05, ***p<0.001, p<0.01. Error bars, ± SEM.
Figure 6.
Figure 6.
Vulnerable but not resilient ABA mice exhibit altered distribution of circadian running activity. (A) Dot plot of wheel running across days of experiment for all mice in 5 min bins. Black and gray bars indicate dark and light cycles, respectively. Red arrow indicates start of food restriction. Dotted lines demarcate data collection days under ABA. (B) Group averages in hour bins across 24 hour period averaged for (B1) baseline days and (B2) ABA experimental days. Dotted line marks light cycle between 6 (lights on) and 18 (lights off) hrs and green shading indicates when food was available. Error bars, ±SEM.
Figure 7.
Figure 7.
Vulnerable ABA mice exhibit maladaptive running behavior. (A) Total, (B) light cycle and (C) dark cycle wheel running averaged across days of food restriction. (D) Wheel running of individual running (light traces) and group mean (bold traces) across food restriction for (D1) light and (D2) dark cycle running (ABA-V, solid red; ABA-R, dashed red; WH, solid blue). (E) Percentage of total running during the (E1) light or (E2) dark cycle. (F) Maximum increase in wheel running across two consecutive days (averaged by group) during the light and dark cycle. (G) Histogram of number of days mice remained in model after maximum increase in light cycle running. Correlation between light (H1) or dark cycle running (H2) and change in bodyweight for ABA-V and ABA-R mice. Each symbol represents one animal on one experimental day. n=9 (resilient ABA), n=10 (vulnerable ABA), n=14 (wheel controls). *p<0.05; **p<0.01; ***p<0.001. Error bars, ±SEM.
Figure 8.
Figure 8.
Characterizing hyperdopaminergic DATcre/+ knockdown mice. (A) Schematic - of a coronal brain slice showing the ventral midbrain dissection (shaded area) used for mRNA determinations (left). Relative mRNA expression (right) of dopamine transporter (DAT), tyrosine hydroxylase (TH), vesicular monoamine transporter 2 (VMAT2) and dopamine D2 receptor (D2R) in DATcre/+ and control DAT+/+ littermates. n= 5 (female DAT+/+), n=7 (male DAT+/+), n=5 (female DATcre/+), n=7 (male DATcre/+). (B) Schematic of a coronal brain slice showing the striatal dissection (left, grey square) used for protein determination (left). Relative DAT expression in DATcre/+ compared to DAT+/+ control mice (right). n= 6 (female DAT+/+), n= 6 (male DAT+/+), n=7 (female DATcre/+), n=10 (male DATcre/+). (C) Photomicrographs of coronal slices showing that DAT immunofluorescence in the striatum is diminished in the DATcre/+ mice. (D) Schematic of a coronal slice (left) showing the FSCV recordings sites: NAc core, dorsomedial- and dorsolateral- striatum (grey circles). Representative recordings (middle) of evoked DA release following single (top) or burst (20 Hz, bottom) stimulation (traces) and respective average DA clearance (Tau) and peak DA release (right). Number of animals is indicated above the bars. n=3 (female DAT+/+), n=6 (male DAT+/+), n=4 (female DATcre/+), n=6 (male DATcre/+). *p<0.05, # genotype effect p< 0.001, ⋄ region effect p<0.05. Error bars, ±SEM.
Figure 9.
Figure 9.
Hyperdopaminergic mice show increased vulnerability to ABA. All mice were tested in the ABA condition. (A) Bodyweight across days of food restriction. (B) Bodyweight of individual mice (light traces) across days of food restriction (bold lines indicate group average). (C) Survival curves for each group. Numbers indicate number of surviving mice that day. (D) Daily food intake across days of restriction. (E) Average food intake prior to removal versus the day of removal. (F) Correlation between consumption during restricted access to food and changes in body weight the next day. Each symbol represents one animal on one experimental day. (G) Average wheel activity across days of food restriction. (H) Wheel running of individual mice (light traces) and group mean (bold traces) across food restriction for (H1) light and (H2) dark cycle running. (I) Maximum increase in wheel running across two consecutive days (averaged by group) during the light and dark cycle. (J) Histogram of the percentage of mice that exhibited peak increase in light cycle running on each day of food restriction. (K) Correlation between light (left) or dark cycle running (right) and change in bodyweight the next day. Each symbol represents one animal on one experimental day. Food intake data: n=12 (DAT+/+), n=8 (DATcre/+); All other data: n=16 (DAT+/+), n=11 (DATcre/+). Survival curves, p<0.05; ***p<0.001. Error bars, ±SEM.
Figure 10.
Figure 10.
Hyperdopaminergic mice do not show increased vulnerability to food restriction in the absence of a running wheel. All mice were tested in the FR condition. (A) Bodyweight across days of food restriction. (B) Survival curves for each group. Numbers indicate number of surviving mice that day. (C) Percent of vulnerable (solid) and resilient (hatched) mice of each genotype (number of animals is indicated inside bars). (D) Bodyweight of individual (D1) control and (D2) hyperdopaminergic mice (light traces) across days of food restriction. Group averages for resilient (dashed line) and vulnerable (solid line) mice are shown in bold. (E) Average food intake of vulnerable (solid) and resilient (hatched) mice of each genotype. (F) Average food intake prior to removal versus the day of removal. (G) Correlation between consumption during restricted access to food and changes in bodyweight the next day for (G1) control and (G2) hyperdopaminergic mice. Each symbol represents one animal on one experimental day. n=10 (resilient DAT+/+), n=7 (vulnerable DAT+/+), n=5 (resilient DATcre/+), n=5 (vulnerable DATcre/+). ***p<0.001, **p<0.01, p<0.05 . Error bars, ±SEM.

Comment in

Similar articles

Cited by

References

    1. Steinhausen H-C (2002): The Outcome of Anorexia Nervosa in the 20th Century. Am J Psychiatry 159: 1284–1293. - PubMed
    1. Khalsa SS, Portnoff LC, McCurdy-McKinnon D, Feusner JD (2017): What happens after treatment? A systematic review of relapse, remission, and recovery in anorexia nervosa. J Eat Disord 5: 20. - PMC - PubMed
    1. Hay P, Mitchison D, Collado AEL, González-Chica DA, Stocks N, Touyz S (2017): Burden and health-related quality of life of eating disorders, including Avoidant/Restrictive Food Intake Disorder (ARFID), in the Australian population. J Eat Disord 5: 21. - PMC - PubMed
    1. Fichter MM, Quadflieg N, Crosby RD, Koch S (2017): Long-term outcome of anorexia nervosa: Results from a large clinical longitudinal study: FICHTER et al. Int J Eat Disord 50: 1018–1030. - PubMed
    1. Frank GKW, Shott ME (2016): The Role of Psychotropic Medications in the Management of Anorexia Nervosa: Rationale, Evidence and Future Prospects. CNS Drugs 30: 419–442. - PMC - PubMed

Publication types

LinkOut - more resources