

Neural anomalies during vigilance in schizophrenia: Diagnostic specificity and genetic associations
- PMID: 32950905
- PMCID: PMC7502576
- DOI: 10.1016/j.nicl.2020.102414
Neural anomalies during vigilance in schizophrenia: Diagnostic specificity and genetic associations
Abstract
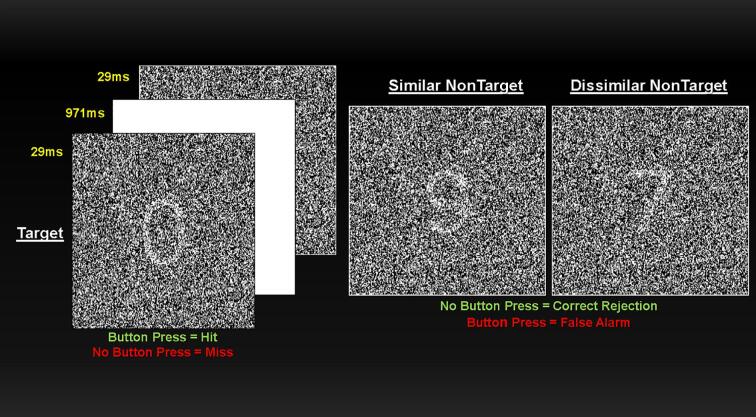
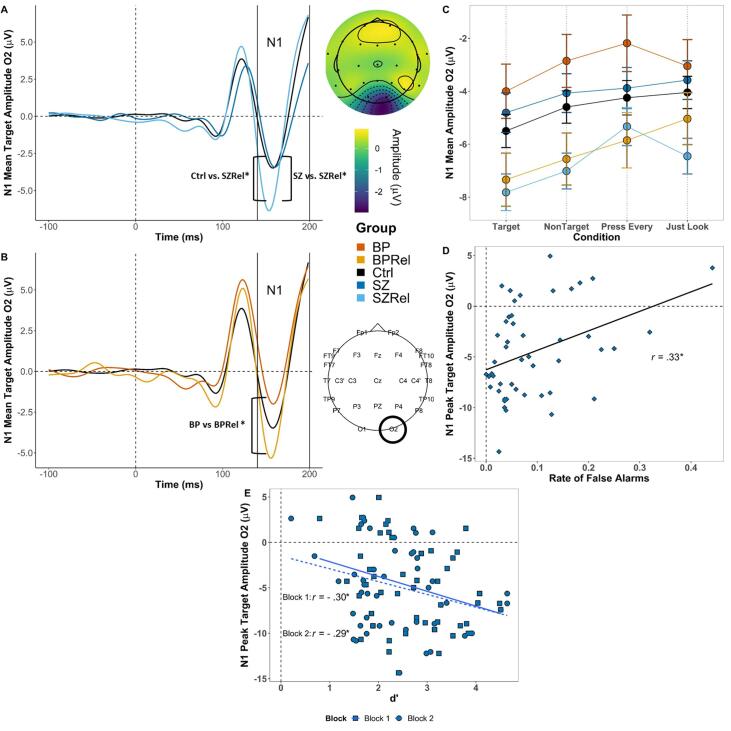
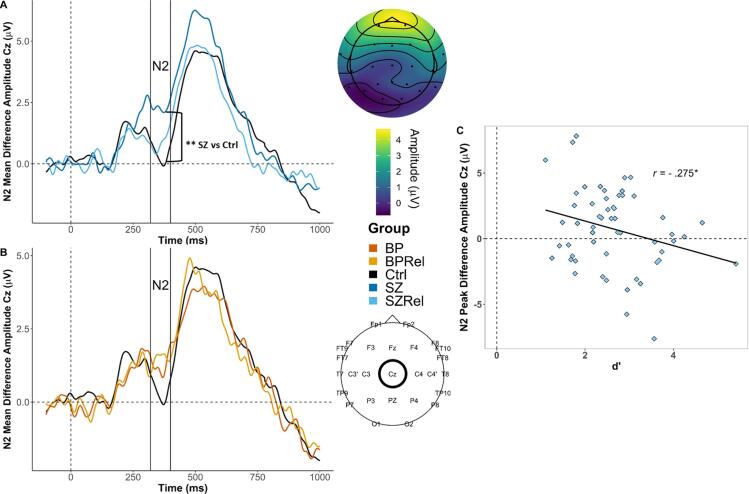
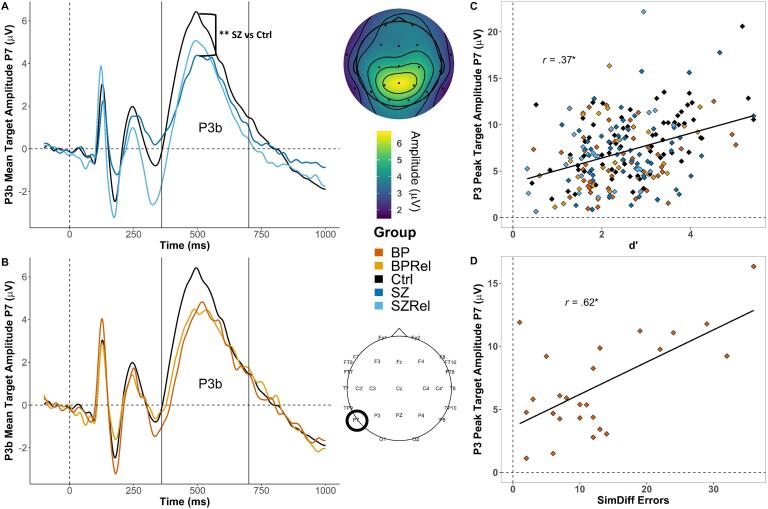
Impaired vigilance is a core cognitive deficit in schizophrenia and may serve as an endophenotype (i.e., mark genetic liability). We used a continuous performance task with perceptually degraded stimuli in schizophrenia patients (N = 48), bipolar disorder patients (N = 26), first-degree biological relatives of schizophrenia patients (N = 55) and bipolar disorder patients (N = 28), as well as healthy controls (N = 68) to clarify whether previously reported vigilance deficits and abnormal neural functions were indicative of genetic liability for schizophrenia as opposed to a generalized liability for severe psychopathology. We also examined variation in the Catechol-O-methyltransferase gene to evaluate whether brain responses were related to genetic variation associated with higher-order cognition. Relatives of schizophrenia patients had an increased rate of misidentification of nontarget stimuli as targets when they were perceptually similar, suggestive of difficulties with contour perception. Larger early visual responses (i.e., N1) were associated with better task performance in patients with schizophrenia consistent with enhanced N1 responses reflecting beneficial neural compensation. Additionally, reduced N2 augmentation to target stimuli was specific to schizophrenia. Both patients with schizophrenia and first-degree relatives displayed reduced late cognitive responses (P3b) that predicted worse performance. First-degree relatives of bipolar patients exhibited performance deficits, and displayed aberrant neural responses that were milder than individuals with liability for schizophrenia and dependent on sex. Variation in the Catechol-O-methyltransferase gene was differentially associated with P3b in schizophrenia and bipolar groups. Poor vigilance in schizophrenia is specifically predicted by a failure to enhance early visual responses, weak augmentation of mid-latency brain responses to targets, and limited engagement of late cognitive responses that may be tied to genetic variation associated with prefrontal dopaminergic availability. Experimental results illustrate specific neural functions that distinguish schizophrenia from bipolar disorder and provides evidence for a putative endophenotype that differentiates genetic liability for schizophrenia from severe mental illness more broadly.
Keywords: Bipolar disorder; Electrophysiology; Endophenotype; Evoked potential; Genetic liability; Schizophrenia; Vigilance.
Published by Elsevier Inc.
Conflict of interest statement
The authors declare that they have no known competing financial interests or personal relationships that could have appeared to influence the work reported in this paper.
Figures
Similar articles
-
Fragile early visual percepts mark genetic liability specific to schizophrenia.Schizophr Bull. 2013 Jul;39(4):839-47. doi: 10.1093/schbul/sbs041. Epub 2012 Mar 23. Schizophr Bull. 2013. PMID: 22446567 Free PMC article.
-
Abnormal early brain responses during visual search are evident in schizophrenia but not bipolar affective disorder.Schizophr Res. 2016 Jan;170(1):102-8. doi: 10.1016/j.schres.2015.11.007. Epub 2015 Nov 18. Schizophr Res. 2016. PMID: 26603466
-
An auditory processing abnormality specific to liability for schizophrenia.Schizophr Res. 2008 Aug;103(1-3):298-310. doi: 10.1016/j.schres.2008.04.038. Epub 2008 Jun 20. Schizophr Res. 2008. PMID: 18571375 Free PMC article.
-
[Schizophrenia and/or bipolar disorder: neurobiological endophenotypes].Encephale. 2012 Dec;38 Suppl 3:S98-102. doi: 10.1016/S0013-7006(12)70086-6. Encephale. 2012. PMID: 23279996 Review. French.
-
Cognitive deficits in bipolar disorders: Implications for emotion.Clin Psychol Rev. 2018 Feb;59:126-136. doi: 10.1016/j.cpr.2017.11.006. Epub 2017 Nov 21. Clin Psychol Rev. 2018. PMID: 29195773 Free PMC article. Review.
Cited by
-
The psychosis human connectome project: Design and rationale for studies of visual neurophysiology.Neuroimage. 2023 May 15;272:120060. doi: 10.1016/j.neuroimage.2023.120060. Epub 2023 Mar 30. Neuroimage. 2023. PMID: 36997137 Free PMC article.
-
Limited Consistency and Strength of Neural Oscillations During Sustained Visual Attention in Schizophrenia.Biol Psychiatry Cogn Neurosci Neuroimaging. 2024 Mar;9(3):337-345. doi: 10.1016/j.bpsc.2023.02.001. Epub 2023 Feb 10. Biol Psychiatry Cogn Neurosci Neuroimaging. 2024. PMID: 36775194 Free PMC article.
-
Altered Use of Context During Visual Perception in Psychotic Psychopathology: A Neurophysiological Investigation of Tuned and Untuned Suppression During Contrast Perception.Schizophr Bull. 2024 Dec 20;51(1):170-185. doi: 10.1093/schbul/sbae103. Schizophr Bull. 2024. PMID: 39148463 Free PMC article.
-
Neural Indicator of Altered Mismatch Detection Predicts Atypical Cognitive-Perceptual Experiences in Psychotic Psychopathology.Schizophr Bull. 2022 Mar 1;48(2):371-381. doi: 10.1093/schbul/sbab127. Schizophr Bull. 2022. PMID: 34665861 Free PMC article.
-
Impact of reduced-dimensionality independent components analysis on event-related potential measurements.Psychophysiology. 2023 May;60(5):e14223. doi: 10.1111/psyp.14223. Epub 2022 Nov 23. Psychophysiology. 2023. PMID: 36416715 Free PMC article.
References
-
- Aguinis H., Petersen S.A., Pierce C.A. Appraisal of the Homogeneity of Error Variance Assumption and Alternatives to Multiple Regression for Estimating Moderating Effects of Categorical Variables. Organizational Research Methods. 1999;2(4):315–339. doi: 10.1177/109442819924001. - DOI
-
- American Psychiatric Association . 4th ed. Text RevisionAuthor; Washington, DC: 2000. Diagnostic and Statistical Manual of Mental Disorders.
-
- Andreasen N.C. University of Iowa; 1984. Scale for the Assessment of Positive Symptoms:(SAPS)
