. 2020 Sep 20;17(1):277.
doi: 10.1186/s12974-020-01947-6.

GM2 ganglioside accumulation causes neuroinflammation and behavioral alterations in a mouse model of early onset Tay-Sachs disease

Affiliations

GM2 ganglioside accumulation causes neuroinflammation and behavioral alterations in a mouse model of early onset Tay-Sachs disease

Seçil Akyıldız Demir et al. J Neuroinflammation. .

Abstract

Background: Tay-Sachs disease (TSD), a type of GM2-gangliosidosis, is a progressive neurodegenerative lysosomal storage disorder caused by mutations in the α subunit of the lysosomal β-hexosaminidase enzyme. This disease is characterized by excessive accumulation of GM2 ganglioside, predominantly in the central nervous system. Although Tay-Sachs patients appear normal at birth, the progressive accumulation of undegraded GM2 gangliosides in neurons leads to death. Recently, an early onset Tay-Sachs disease mouse model, with genotype Hexa-/-Neu3-/-, was generated. Progressive accumulation of GM2 led to premature death of the double KO mice. Importantly, this double-deficient mouse model displays typical features of Tay-Sachs patients, such as cytoplasmic vacuolization of nerve cells, deterioration of Purkinje cells, neuronal death, deceleration in movement, ataxia, and tremors. GM2-gangliosidosis is characterized by acute neurodegeneration preceded by activated microglia expansion, macrophage, and astrocyte activation, along with the production of inflammatory mediators. However, the mechanism of disease progression in Hexa-/-Neu3-/- mice, relevant to neuroinflammation is poorly understood.

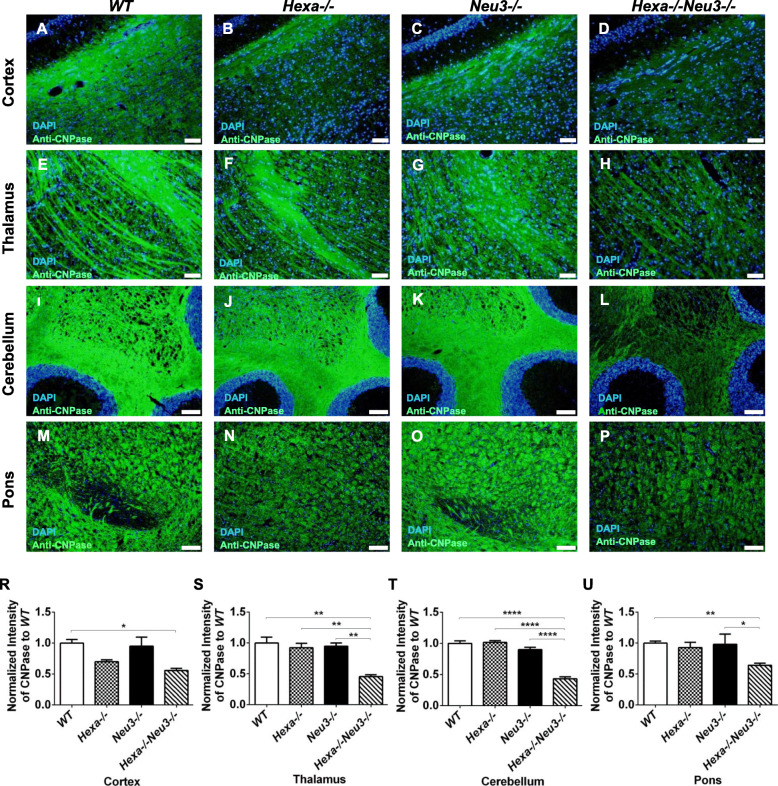
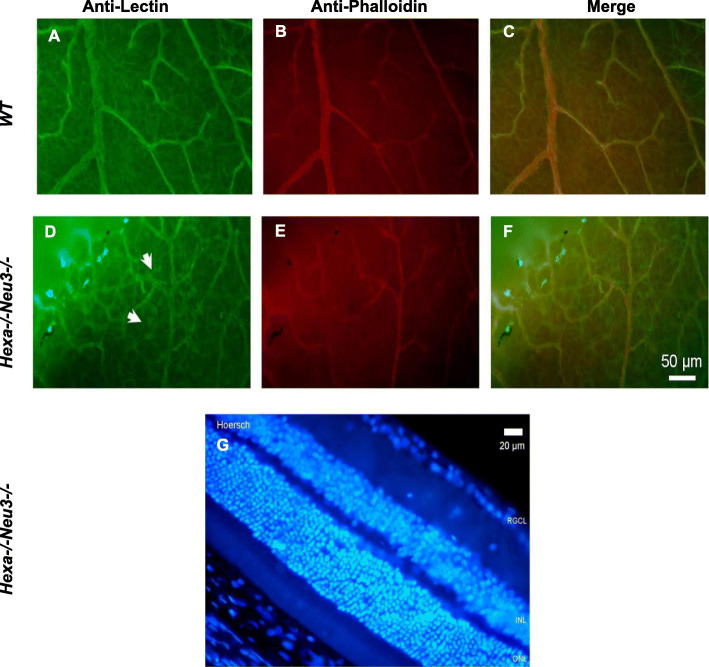
Method: In this study, we investigated the onset and progression of neuroinflammatory changes in the cortex, cerebellum, and retina of Hexa-/-Neu3-/- mice and control littermates by using a combination of molecular genetics and immunochemical procedures.

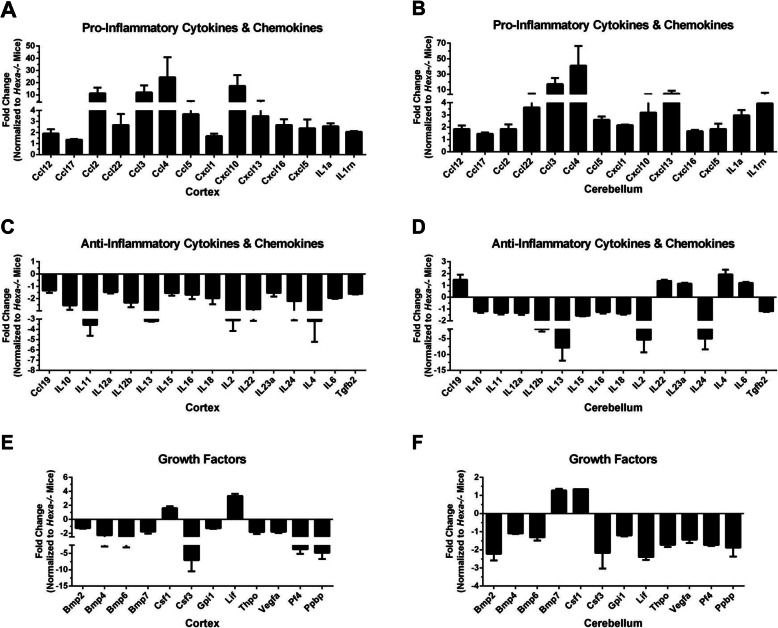
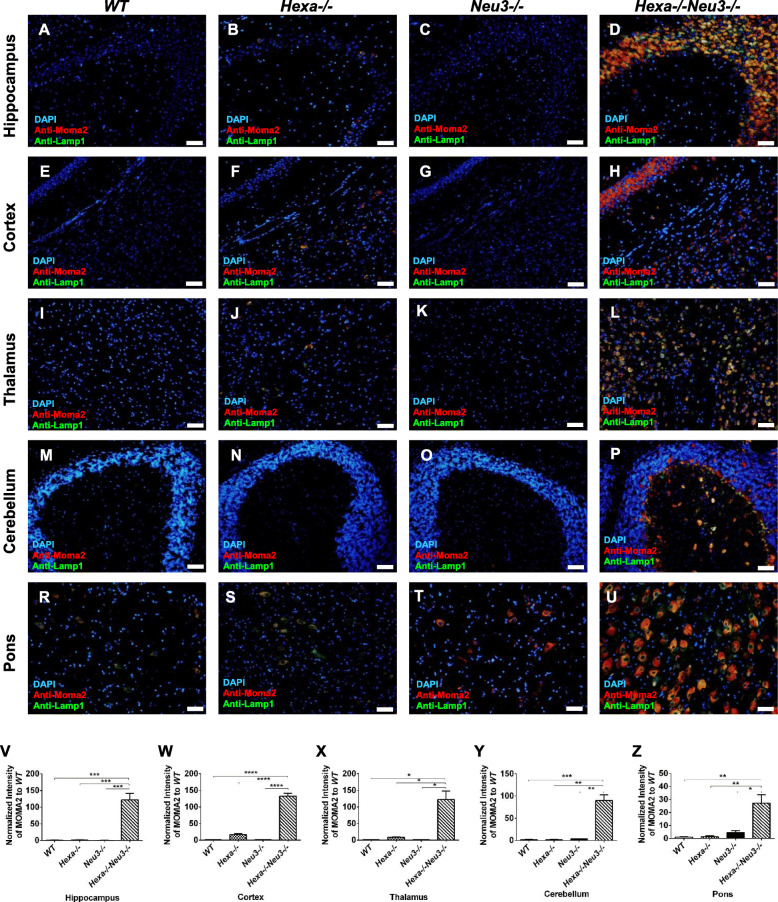
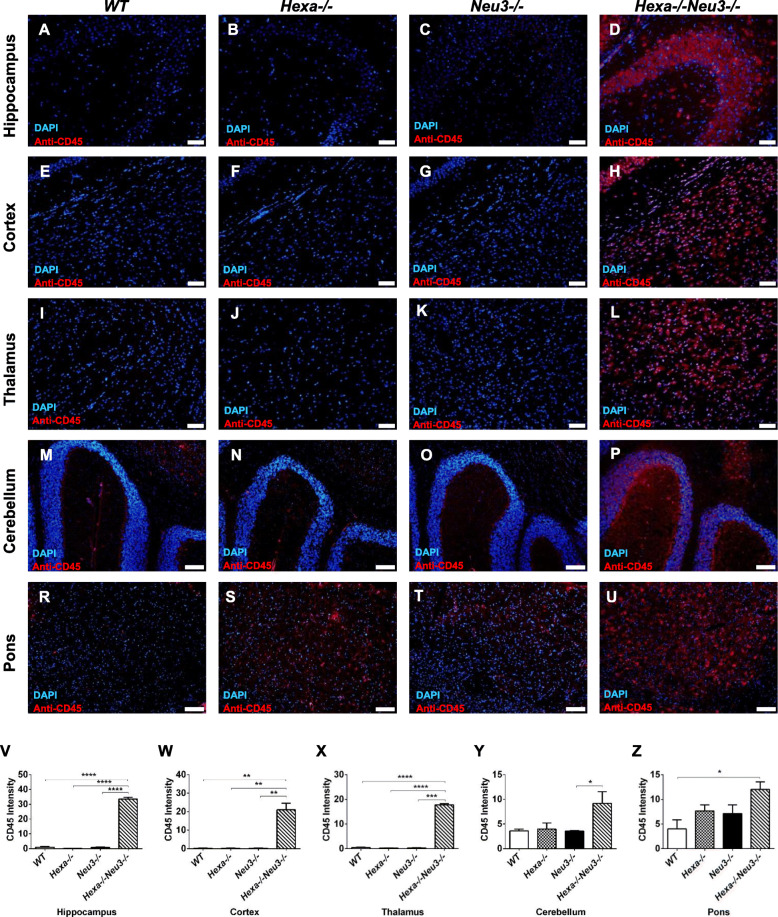
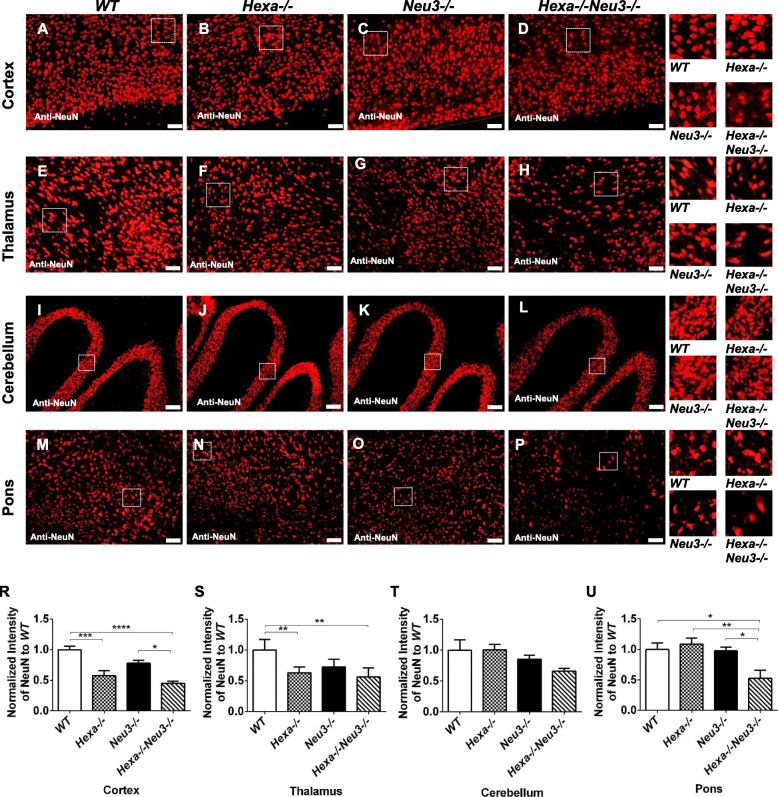
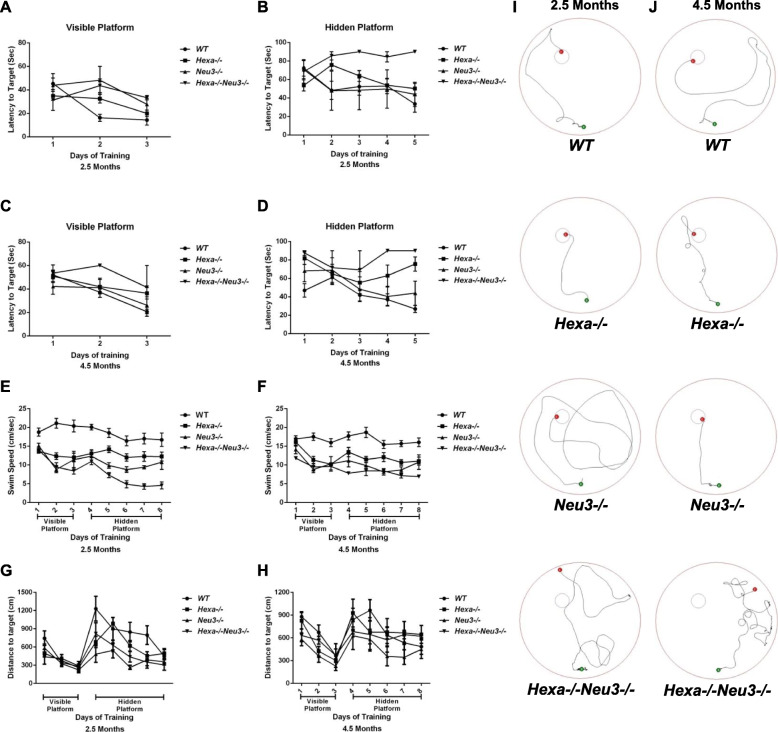
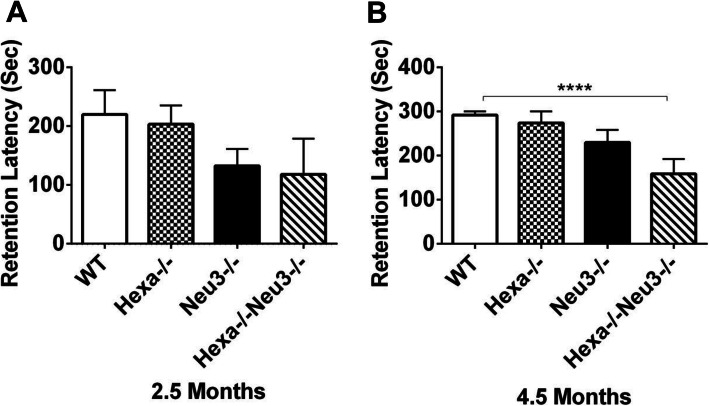
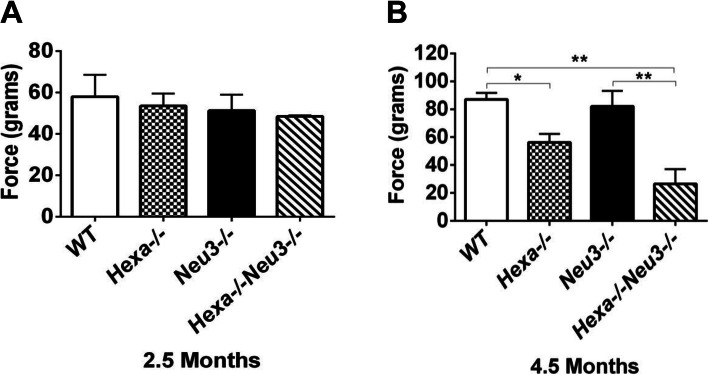
Results: We found elevated levels of pro-inflammatory cytokine and chemokine transcripts, such as Ccl2, Ccl3, Ccl4, and Cxcl10 and also extensive microglial and astrocyte activation and proliferation, accompanied by peripheral blood mononuclear cell infiltration in the vicinity of neurons and oligodendrocytes. Behavioral tests demonstrated a high level of anxiety, and age-dependent loss in both spatial learning and fear memory in Hexa-/-Neu3-/- mice compared with that in the controls.

Conclusion: Altogether, our data suggest that Hexa-/-Neu3-/- mice display a phenotype similar to Tay-Sachs patients suffering from chronic neuroinflammation triggered by GM2 accumulation. Furthermore, our work contributes to better understanding of the neuropathology in a mouse model of early onset Tay-Sachs disease.

Keywords: Behavior; GM2; Mouse model; Neuroinflammation; Tay-Sachs disease.


Conflict of interest statement

The authors declare that the research was conducted in the absence of any commercial or financial relationships that could be construed as a potential conflict of interest.

Figures

Fig. 1
Fig. 1
Relative expression levels of inflammatory cytokines and chemokines (a and b), anti-inflammatory cytokines and chemokines (c and d), and growth factors (e and f) in the cortex and cerebellum of 4.5-month-old Hexa−/−Neu3−/− mice (n = 2) normalized to Hexa/− mice (n = 2)
Fig. 2
Fig. 2
Immunohistochemical analysis to detect microglial activation. The sections from the hippocampus (a, b, c, and d, respectively), cortex (e, f, g, and h, respectively), thalamus (i, j, k, and l, respectively), cerebellum (m, n, o, and p, respectively), and pons (r, s, t, and u, respectively) of 4.5-month-old WT, Hexa−/−, Neu3−/−, and Hexa−/−Neu3−/− mice were stained with anti-Moma2 antibody (red), anti-lamp1 (green), and DAPI (blue). A yellow signal signifies the colocalization of Moma2 and lamp1 as an activated microglial cell. The histograms represent the quantification of activated microglial cells in the hippocampus (v), cortex (w) thalamus (x), cerebellum (y), and pons (z). Scale bar = 50 μm. The data are represented as the mean ± SEM. One-way ANOVA was used for statistical analysis (*p < 0.05, **p < 0.025, ***p < 0.01, and ****p < 0.001)
Fig. 3
Fig. 3
Immunohistochemical analysis of activated PBMC. The sections from the hippocampus (a, b, c, and d, respectively), cortex (e, f, g, and h, respectively), thalamus (i, j, k, and l, respectively), cerebellum (m, n, o, and p, respectively), and pons (r, s, t, and u, respectively) of 4.5-month-old WT, Hexa−/−, Neu3−/−, and Hexa−/−Neu3−/− mice were stained with anti-CD45 antibody (red) and DAPI (blue). The histograms represent the quantification of CD45(+) cell number in the hippocampus (v), cortex (w), thalamus (x), cerebellum (y), and pons (z). Scale bar = 50 μm for the hippocampus, cortex, and thalamus; 100 μm for cerebellum and pons. The data are represented as the mean ± SEM. One-way ANOVA was used for statistical analysis (*p < 0.05, **p < 0.025, ***p < 0.01, and ****p < 0.001)
Fig. 4
Fig. 4
Neuronal density detection in cortex (a, b, c, and d, respectively), thalamus (e, f, g, and h, respectively), cerebellum (i, j, k, and l, respectively), and pons (m, n, o, and p, respectively) of 4.5-month-old WT, Hexa−/−, Neu3−/−, and Hexa−/−Neu3−/− mice. They were stained with anti-NeuN antibody (red) and DAPI (blue). The histograms represent quantification of neuronal density in the cortex (R), thalamus (S), cerebellum (T), pons (U). Scale bar = 50 μm for cortex and thalamus; 100 μm for cerebellum and pons. The data are represented as the mean ± SEM. One-way ANOVA was used for statistical analysis (*p < 0.05, **p < 0.025, ***p < 0.01, and ****p < 0.001)
Fig. 5
Fig. 5
Immunohistochemical staining for oligodendrocytes. The sections from the cortex (a, b, c, and d, respectively), thalamus (e, f, g, and h, respectively), cerebellum (i, j, k, and l, respectively), and pons (m, n, o, and p, respectively) of 4.5-month-old WT, Hexa−/−, Neu3−/−, and Hexa−/−Neu3−/− mice were stained with anti-CNPase (red) and DAPI (blue). The histograms represent the quantification of oligodendrocytes in the cortex (R), thalamus (S), cerebellum (T), pons (U). Scale bar = 50 μm for cortex and thalamus; 100 μm for cerebellum and pons. The data are represented as the mean ± SEM. One-way ANOVA was used for statistical analysis (*p < 0.05, **p < 0.025, and ****p < 0.001)
Fig. 6
Fig. 6
Immunohistochemical analysis to detect glial activation in the retina. The retinas of 4.5-month-old WT (a, b, and c) and Hexa−/−Neu3−/− (d, e, and f) mice were stained with anti-lectin (green) and anti-phalloidin (red) antibody. The white arrow indicates the glial cells. The sagittal sections of Hexa−/−Neu3−/− mice retina (G) were stained with Hoechst (blue). Scale bar = 50 μm in a, b, c, d, e, and f; 20 μm in g
Fig. 7
Fig. 7
Morris water maze test. Latency to target for the visible platform (a and c) and hidden platform (b and d), swim speed (e and f), and distance to the target (g and h) were analyzed. Typical swim patterns of 2.5- and 4.5-month-old mice on day 8 were shown (i and j, respectively). The data are presented as means + SEM. A 2.5-month-old WT (n = 4), Hexa−/− (n = 8), Neu3−/− (n = 3), and Hexa−/−Neu3−/− (n = 3) mice; 4.5-month-old WT (n = 6), Hexa−/− (n = 3), Neu3−/− (n = 3), and Hexa−/−Neu3−/− (n = 3)
Fig. 8
Fig. 8
The passive-avoidance test. Latencies to enter the dark compartment on the 3rd day were shown for 2.5- (a) and 4.5-month-old (b) mice group. If mice did not enter the dark compartment within 300 s, retention latency time was recorded as 300 s. The data are presented as the mean ± SEM. One-way ANOVA was used for statistical analysis (****p < 0.001). A 2.5-month-old WT (n = 4), Hexa−/− (n = 6), Neu3−/− (n = 15), and Hexa−/−Neu3−/− (n = 6) mice; and 4.5-month-old WT (n = 10), Hexa−/− (n = 6), Neu3−/− (n = 10), and Hexa−/−Neu3−/− (n = 6)
Fig. 9
Fig. 9
Forelimb grip strength measurement of 2.5- (a) and 4.5-month-old (b) mice group. The data are presented as the mean ± SEM. One-way ANOVA was used for statistical analysis (*p < 0.05, **p < 0.025). A 2.5-month-old WT (n = 5), Hexa−/− (n = 5), Neu3−/− (n = 4), and Hexa−/−Neu3−/− (n = 4) mice; 4.5-month-old WT (n = 4), Hexa−/− (n = 4), Neu3−/− (n = 4), and Hexa−/−Neu3−/− (n = 4) mice

References

    1. Yamanaka S, Johnson MD, Grinberg A, Westphal H, Crawley JN, Taniike M, et al. Targeted disruption of the Hexa gene results in mice with biochemical and pathologic features of Tay-Sachs disease. Proc Natl Acad Sci U S A. 1994;91:9975–9979. doi: 10.1073/pnas.91.21.9975. - DOI - PMC - PubMed
    1. Sango K, Yamanaka S, Hoffmann A, Okuda Y, Grinberg A, Westphal H, et al. Mouse models of Tay–Sachs and Sandhoff diseases differ in neurologic phenotype and ganglioside metabolism. Nat Genet. 1995;11:170–176. doi: 10.1038/ng1095-170. - DOI - PubMed
    1. Phaneuf D, Wakamatsu N, Huang J, Borowski A, Peterson AC, Fortunato SR, et al. Dramatically different phenotypes in mouse models of human Tay-Sachs and Sandhoff diseases. Hum Mol Genet. 1996;5:1–14. doi: 10.1093/hmg/5.1.1. - DOI - PubMed
    1. Yuziuk JA, Bertoni C, Beccari T, Orlacchio A, Wu Y-Y, Li S-C, et al. Specificity of mouse G M2 activator protein and β-N-acetylhexosaminidases A and B. J Biol Chem. 1998;273:66–72. - PubMed
    1. Seyrantepe V, Demir SA, Timur ZK, Von Gerichten J, Marsching C, Erdemli E, et al. Murine sialidase Neu3 facilitates GM2 degradation and bypass in mouse model of Tay-Sachs disease. Exp Neurol. 2017;2018(299):26–41. - PubMed

MeSH terms