

Modeling and forecasting the spread tendency of the COVID-19 in China
- PMID: 32952537
- PMCID: PMC7487449
- DOI: 10.1186/s13662-020-02940-2
Modeling and forecasting the spread tendency of the COVID-19 in China
Abstract
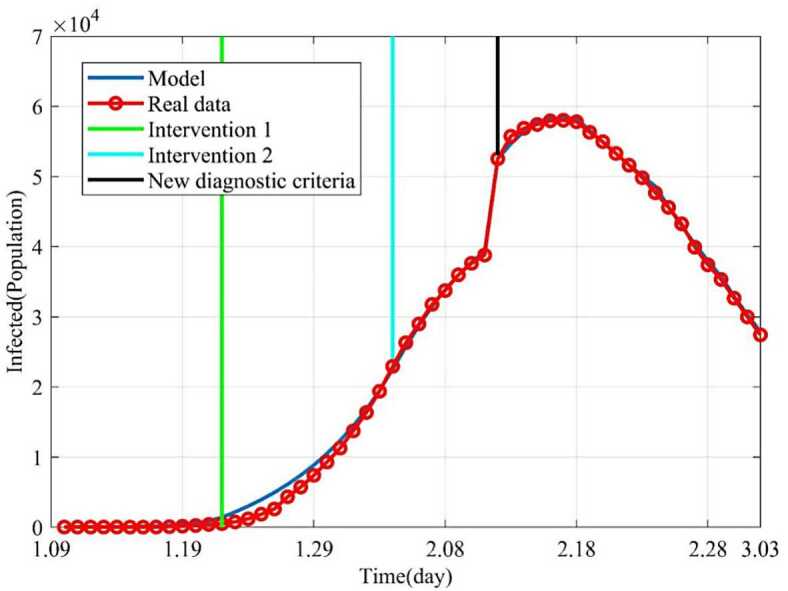
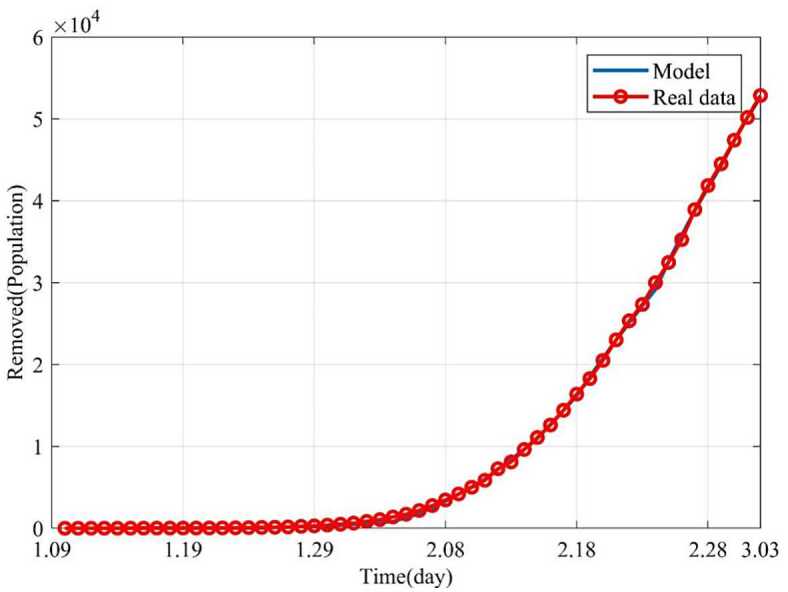
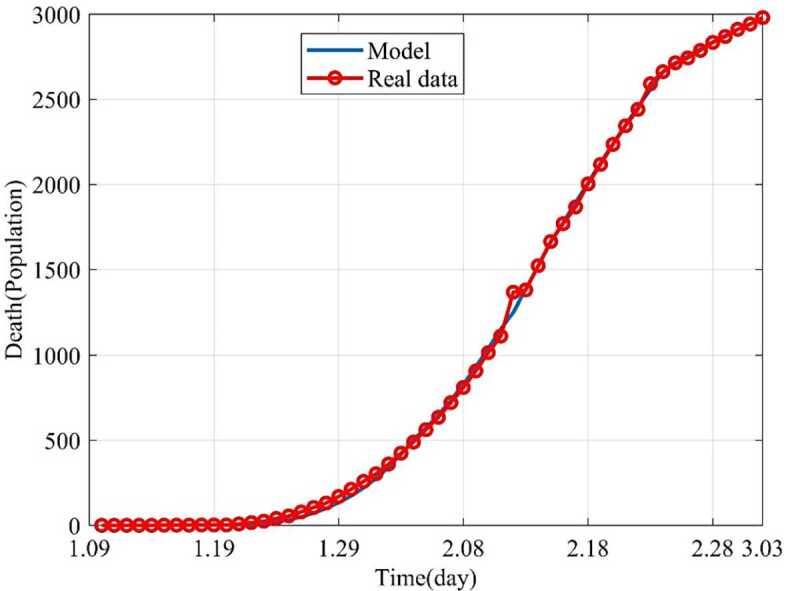
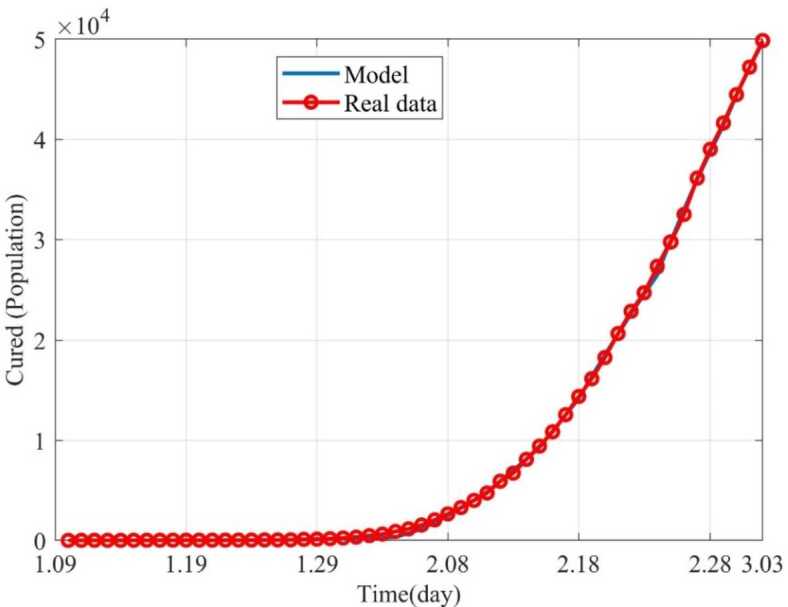
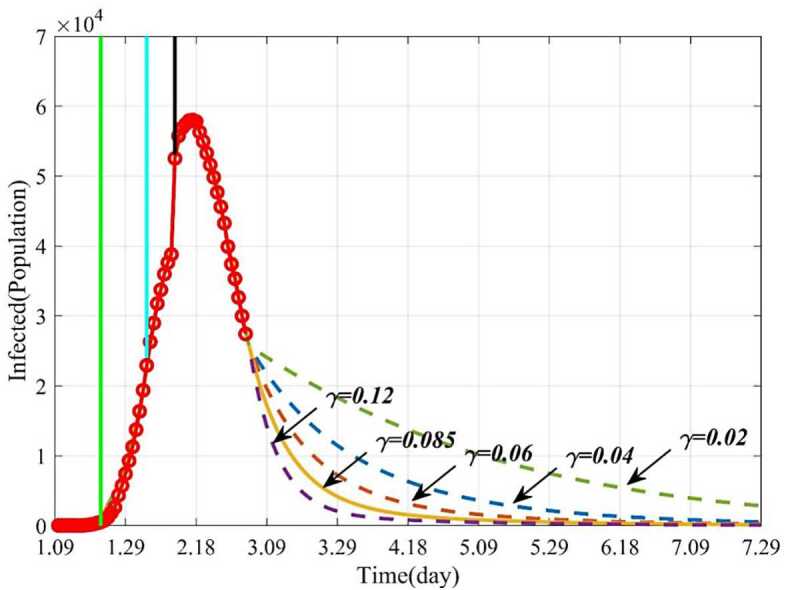
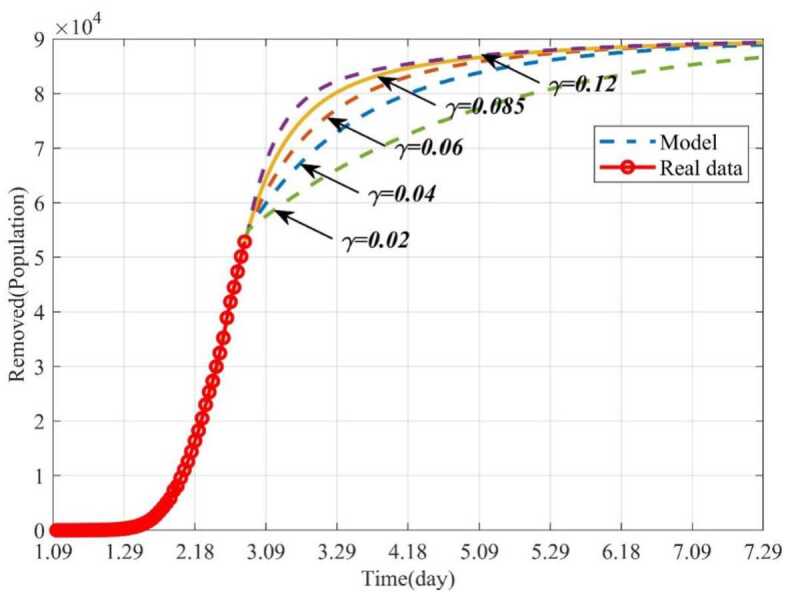
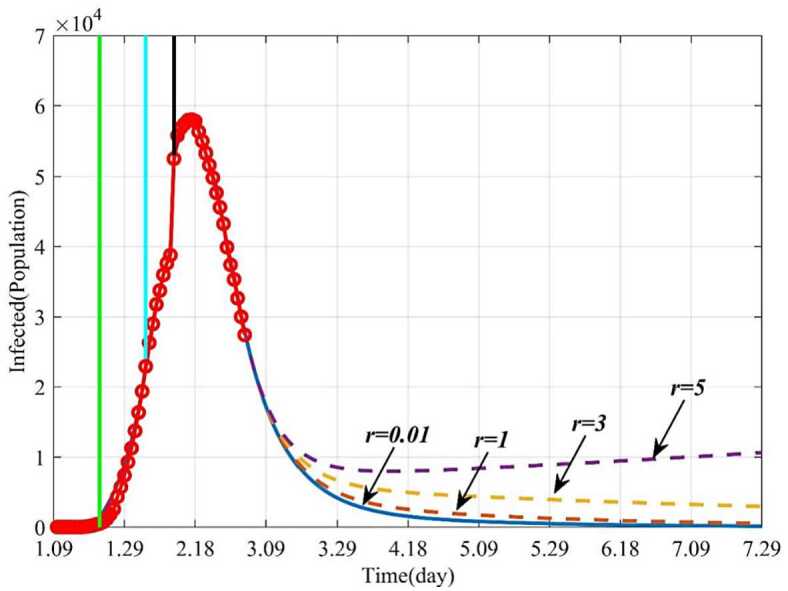
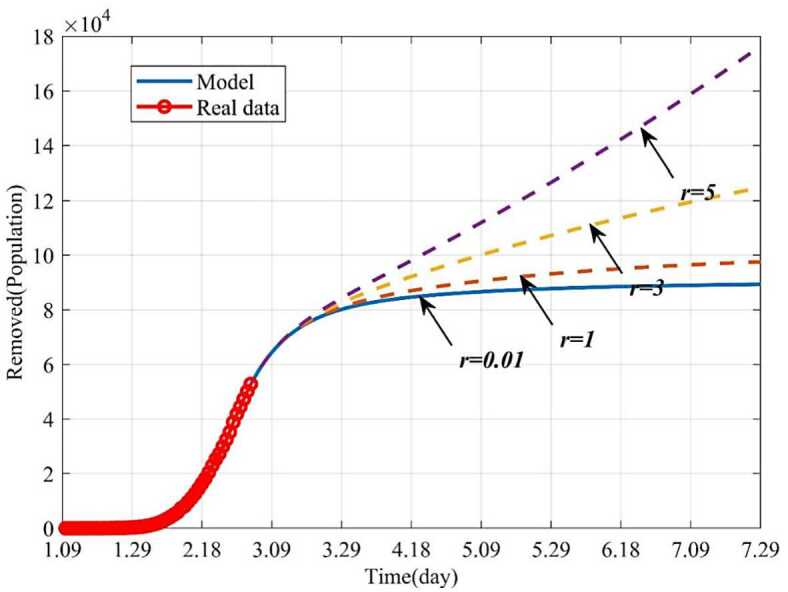
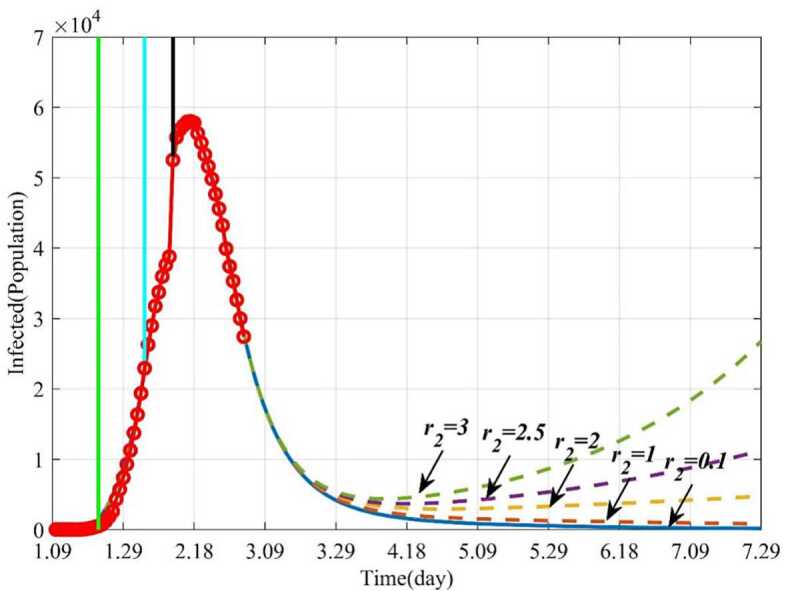
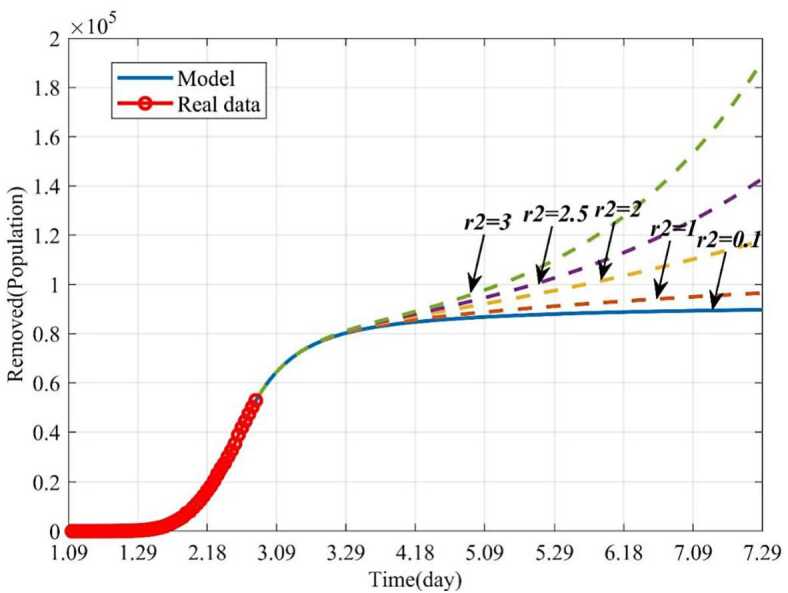
To forecast the spread tendency of the COVID-19 in China and provide effective strategies to prevent the disease, an improved SEIR model was established. The parameters of our model were estimated based on collected data that were issued by the National Health Commission of China (NHCC) from January 10 to March 3. The model was used to forecast the spread tendency of the disease. The key factors influencing the epidemic were explored through modulation of the parameters, including the removal rate, the average number of the infected contacting the susceptible per day and the average number of the exposed contacting the susceptible per day. The correlation of the infected is 99.9% between established model data in this study and issued data by NHCC from January 10 to February 15. The correlation of the removed, the death and the cured are 99.8%, 99.8% and 99.6%, respectively. The average forecasting error rates of the infected, the removed, the death and the cured are 0.78%, 0.75%, 0.35% and 0.83%, respectively, from February 16 to March 3. The peak time of the epidemic forecast by our established model coincided with the issued data by NHCC. Therefore, our study established a mathematical model with high accuracy. The aforementioned parameters significantly affected the trend of the epidemic, suggesting that the exposed and the infected population should be strictly isolated. If the removal rate increases to 0.12, the epidemic will come to an end on May 25. In conclusion, the proposed mathematical model accurately forecast the spread tendency of COVID-19 in China and the model can be applied for other countries with appropriate modifications.
Keywords: COVID-19; Control strategy; Forecasting; Mathematical modeling; Parameter estimation.
© The Author(s) 2020.
Conflict of interest statement
Competing interestsThe authors declare there are no conflicts of interest regarding the publication of this paper.
Figures
Similar articles
-
Forecasting the long-term trend of COVID-19 epidemic using a dynamic model.Sci Rep. 2020 Dec 3;10(1):21122. doi: 10.1038/s41598-020-78084-w. Sci Rep. 2020. PMID: 33273592 Free PMC article.
-
Modified SEIR and AI prediction of the epidemics trend of COVID-19 in China under public health interventions.J Thorac Dis. 2020 Mar;12(3):165-174. doi: 10.21037/jtd.2020.02.64. J Thorac Dis. 2020. PMID: 32274081 Free PMC article.
-
Transmission patterns of COVID-19 in the mainland of China and the efficacy of different control strategies: a data- and model-driven study.Infect Dis Poverty. 2020 Jul 6;9(1):83. doi: 10.1186/s40249-020-00709-z. Infect Dis Poverty. 2020. PMID: 32631426 Free PMC article.
-
Strong policies control the spread of COVID-19 in China.J Med Virol. 2020 Oct;92(10):1980-1987. doi: 10.1002/jmv.25934. Epub 2020 Jul 28. J Med Virol. 2020. PMID: 32330295 Free PMC article.
-
Uncertainty Modeling of a Modified SEIR Epidemic Model for COVID-19.Biology (Basel). 2022 Aug 2;11(8):1157. doi: 10.3390/biology11081157. Biology (Basel). 2022. PMID: 36009784 Free PMC article.
Cited by
-
SARS-CoV-2 transmission dynamics in Mozambique and Zimbabwe during the first 3 years of the pandemic.R Soc Open Sci. 2025 Jan 22;12(1):241275. doi: 10.1098/rsos.241275. eCollection 2025 Jan. R Soc Open Sci. 2025. PMID: 39845719 Free PMC article.
-
Comparative study of artificial neural network versus parametric method in COVID-19 data analysis.Results Phys. 2022 Jul;38:105613. doi: 10.1016/j.rinp.2022.105613. Epub 2022 May 16. Results Phys. 2022. PMID: 35600673 Free PMC article.
-
Mathematical Modeling to Determine the Fifth Wave of COVID-19 in South Africa.Biomed Res Int. 2022 Aug 24;2022:9932483. doi: 10.1155/2022/9932483. eCollection 2022. Biomed Res Int. 2022. PMID: 36060131 Free PMC article.
-
Mathematical modeling and optimal control of the COVID-19 dynamics.Results Phys. 2021 Dec;31:105028. doi: 10.1016/j.rinp.2021.105028. Epub 2021 Nov 27. Results Phys. 2021. PMID: 34868832 Free PMC article.
-
Stability and numerical analysis via non-standard finite difference scheme of a nonlinear classical and fractional order model.Results Phys. 2023 Jun;49:106536. doi: 10.1016/j.rinp.2023.106536. Epub 2023 May 15. Results Phys. 2023. PMID: 37214757 Free PMC article.
References
-
- China, New coronavirus pneumonia diagnosis and treatment plan (trial version 7) (2020)
-
- Yang, Y., et al.: Epidemiological and clinical features of the 2019 novel coronavirus outbreak in China (2020). 10.1101/2020.02.10.20021675
LinkOut - more resources
Full Text Sources