

Interannual variations in meltwater input to the Southern Ocean from Antarctic ice shelves
- PMID: 32952606
- PMCID: PMC7500482
- DOI: 10.1038/s41561-020-0616-z
Interannual variations in meltwater input to the Southern Ocean from Antarctic ice shelves
Abstract
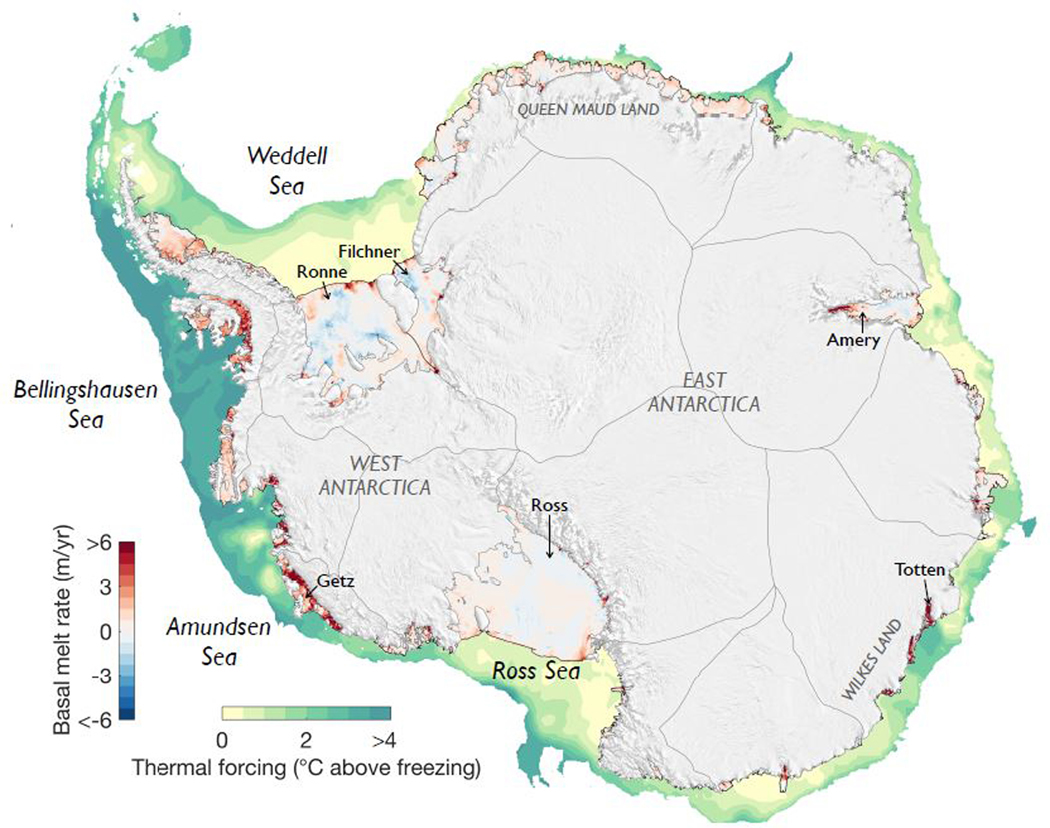
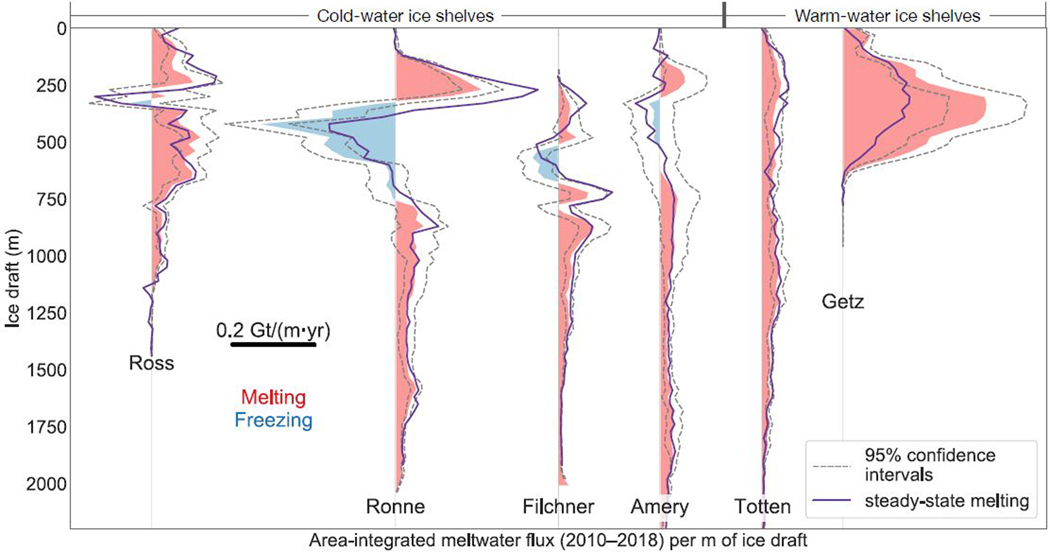
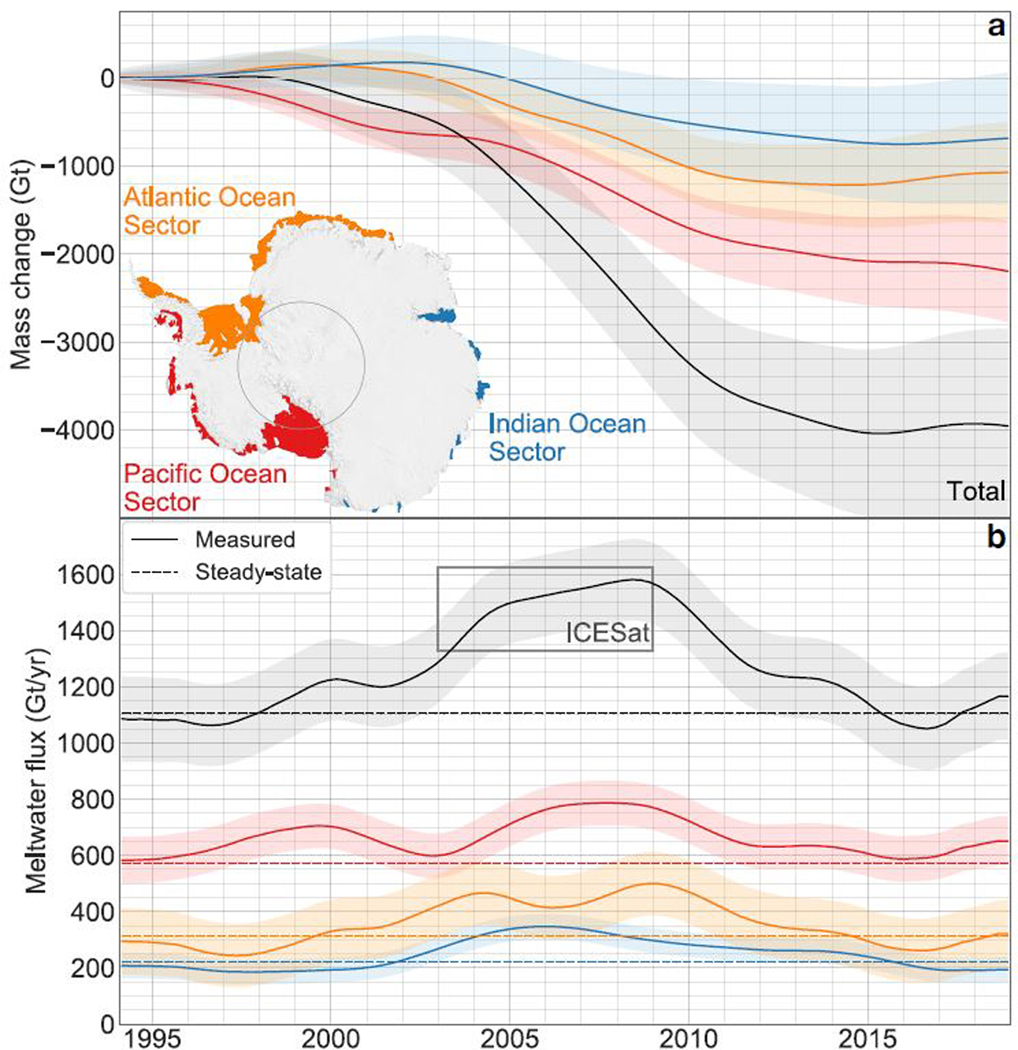
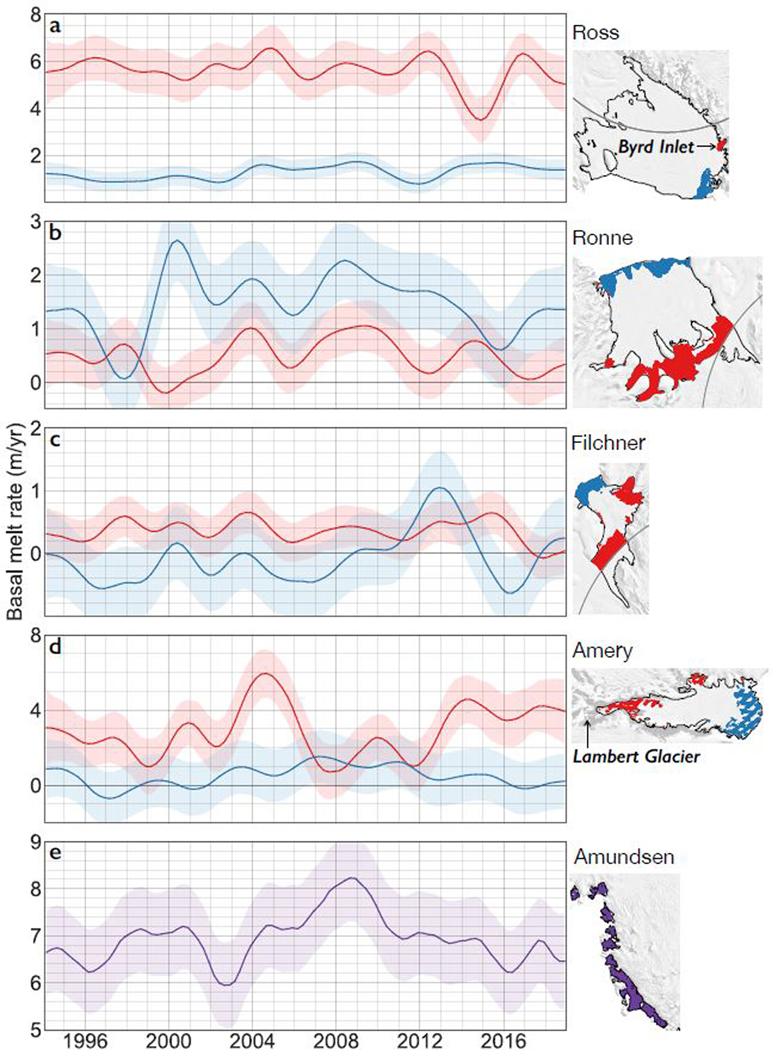
Ocean-driven basal melting of Antarctica's floating ice shelves accounts for about half of their mass loss in steady-state, where gains in ice shelf mass are balanced by losses. Ice shelf thickness changes driven by varying basal melt rates modulate mass loss from the grounded ice sheet and its contribution to sea level, and the changing meltwater fluxes influence climate processes in the Southern Ocean. Existing continent-wide melt rate datasets have no temporal variability, introducing uncertainties in sea level and climate projections. Here, we combine surface height data from satellite radar altimeters with satellite-derived ice velocities and a new model of firn-layer evolution to generate a high-resolution map of time-averaged (2010-2018) basal melt rates, and time series (1994-2018) of meltwater fluxes for most ice shelves. Total basal meltwater flux in 1994 (1090±150 Gt/yr) was not significantly different from the steady-state value (1100±60 Gt/yr), but increased to 1570±140 Gt/yr in 2009, followed by a decline to 1160±150 Gt/yr in 2018. For the four largest "cold-water" ice shelves we partition meltwater fluxes into deep and shallow sources to reveal distinct signatures of temporal variability, providing insights into climate forcing of basal melting and the impact of this melting on the Southern Ocean.
Conflict of interest statement
The authors declare no competing interests.
Figures
References
-
- Pritchard HD et al. Antarctic ice-sheet loss driven by basal melting of ice shelves. Nature 484, 502–505 (2012). - PubMed
-
- Paolo FS, Fricker HA & Padman L Volume loss from Antarctic ice shelves is accelerating. Science 348, 327–331 (2015). - PubMed
-
- Thomas RH, Sanderson TJO & Rose KE Effect of climatic warming on the West Antarctic ice sheet. Nature 277, 355–358 (1979).
-
- Jenkins A et al. West Antarctic Ice Sheet retreat in the Amundsen Sea driven by decadal oceanic variability. Nature Geosci 11, 733–738 (2018).
References only in Methods
-
- Moholdt G, Padman L & Fricker HA Basal mass budget of Ross and Filchner-Ronne ice shelves, Antarctica, derived from Lagrangian analysis of ICESat altimetry. Journal of Geophysical Research: Earth Surface 119, 2361–2380 (2014).
-
- Förste C et al. EIGEN-6C4-The latest combined global gravity field model including GOCE data up to degree and order 1949 of GFZ Potsdam and GRGS Toulouse. in EGU general assembly conference abstracts vol. 16 (2014).
-
- Andersen O, Knudsen P & Stenseng L The DTU13 MSS (Mean Sea Surface) and MDT (Mean Dynamic Topography) from 20 Years of Satellite Altimetry in IGFS 2014 (eds. Jin S & Barzaghi R) 111–121 (Springer International Publishing, 2016).
-
- Howard SL, Padman L & Erofeeva SY CATS2008: Circum-Antarctic Tidal Simulation version 2008. (2019) doi:10.15784/601235. - DOI
-
- Padman L, Fricker HA, Coleman R, Howard S & Erofeeva L A new tide model for the Antarctic ice shelves and seas. Annals of Glaciology 34, 247–254 (2002).
Grants and funding
LinkOut - more resources
Full Text Sources
Miscellaneous