. 2021;14(2):217-233.
doi: 10.1007/s11869-020-00927-2. Epub 2020 Sep 15.

Inactivation times from 290 to 315 nm UVB in sunlight for SARS coronaviruses CoV and CoV-2 using OMI satellite data for the sunlit Earth

Affiliations

Inactivation times from 290 to 315 nm UVB in sunlight for SARS coronaviruses CoV and CoV-2 using OMI satellite data for the sunlit Earth

Jay Herman et al. Air Qual Atmos Health. 2021.

Abstract

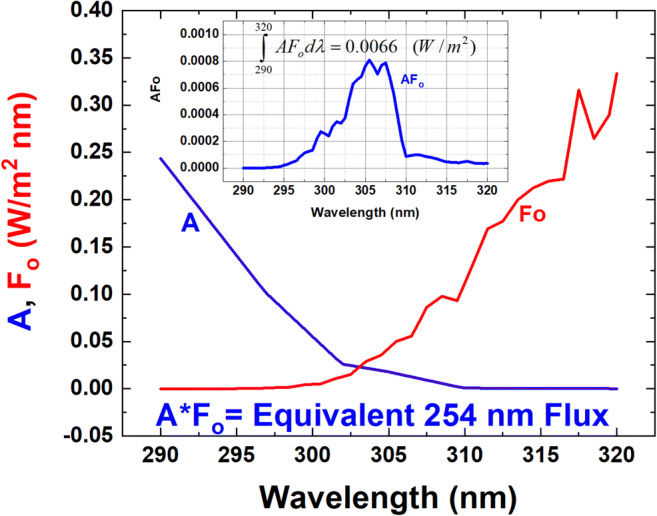
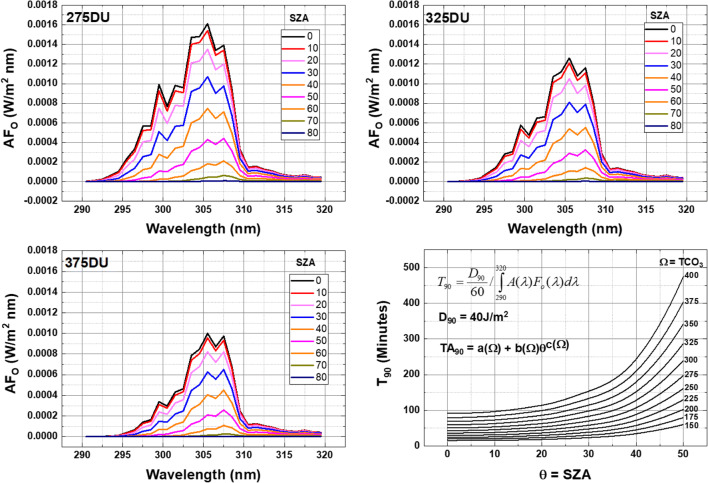
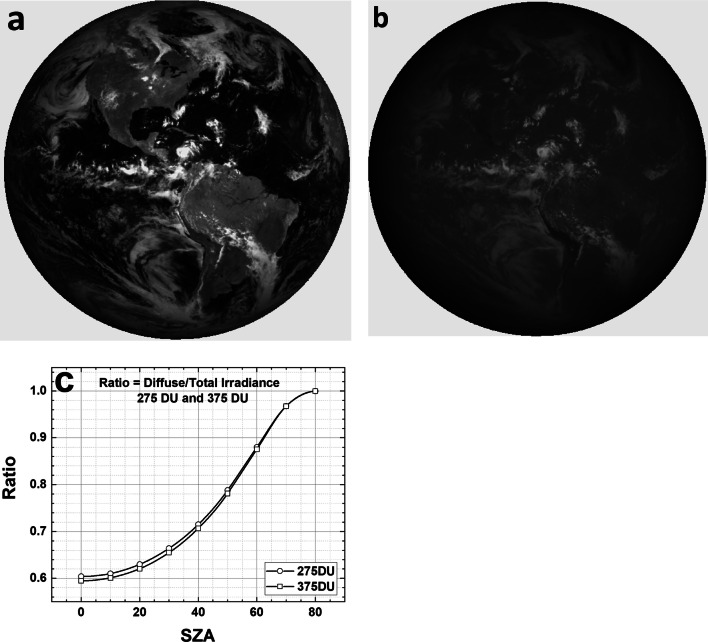
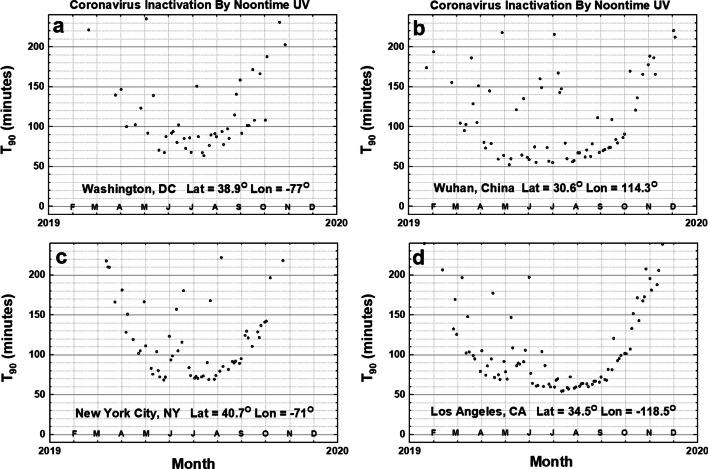
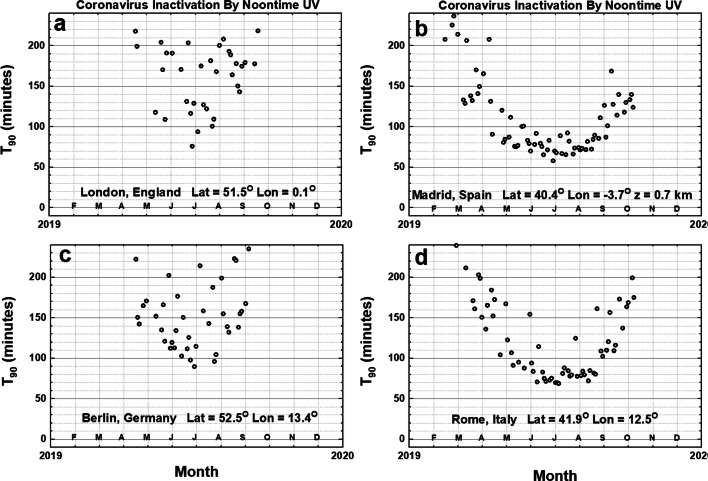
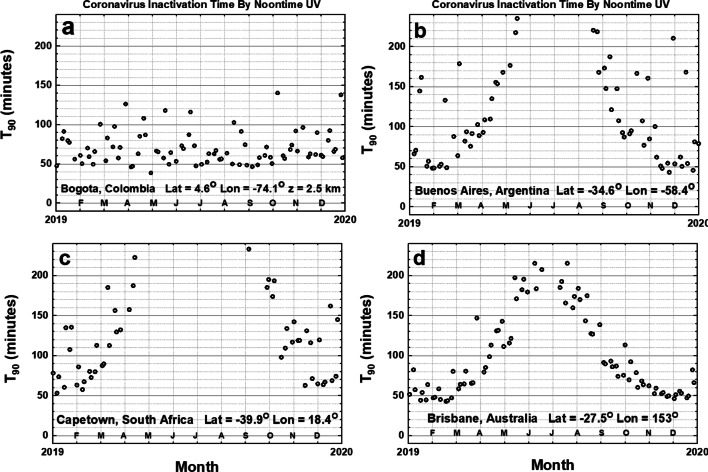
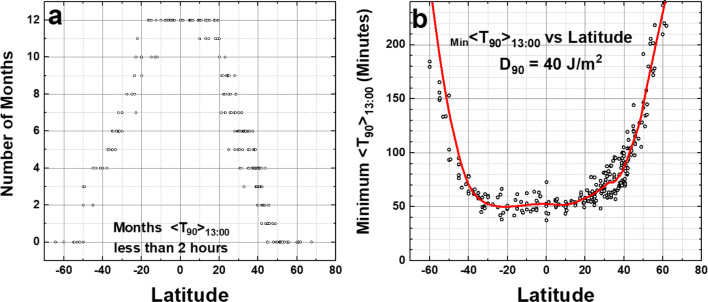
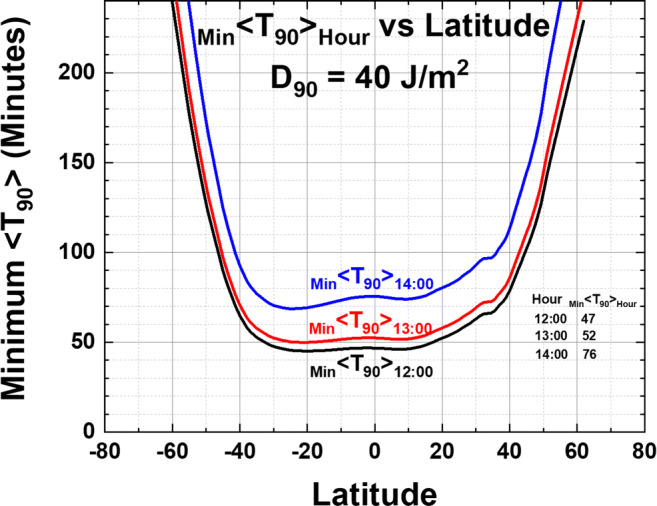
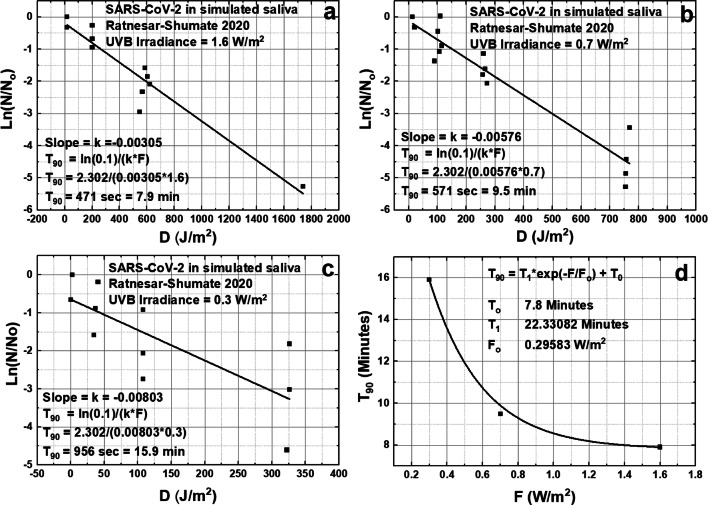
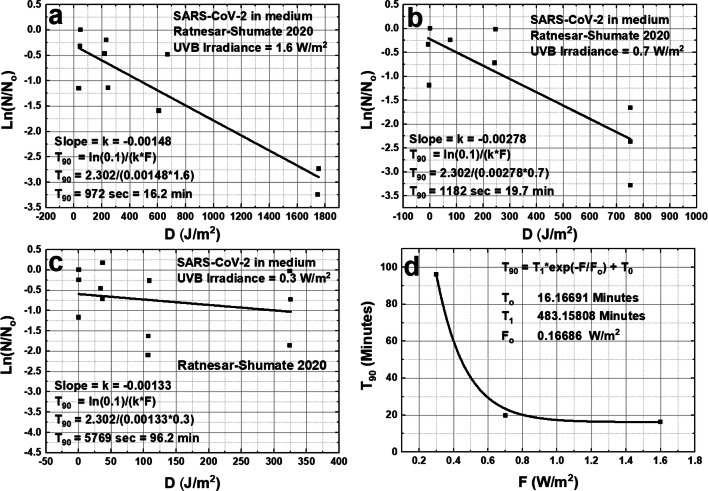
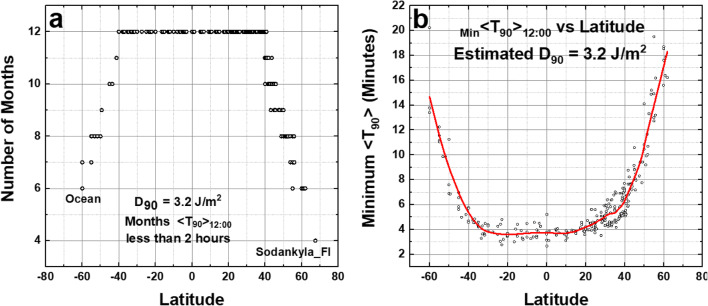
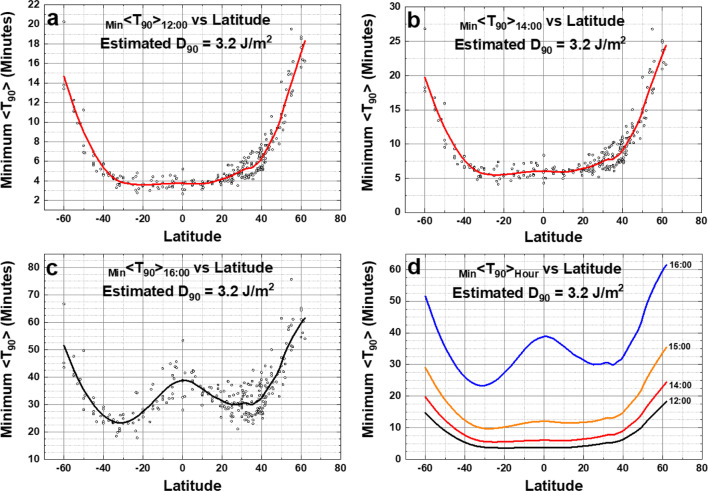
UVB in sunlight, 290-315 nm, can inactivate SARS CoV and SARS CoV-2 viruses on surfaces and in the air. Laboratory exposure to ultraviolet irradiance in the UVC range inactivates many viruses and bacteria in times less than 30 min. Estimated UVB inactivation doses from sunlight in J/m2 are obtained from UVC measurements and radiative transfer calculations, weighted by a virus inactivation action spectrum, using OMI satellite atmospheric data for ozone, clouds, and aerosols. For SARS CoV, using an assumed UVC dose near the mid-range of measured values, D 90 = 40 J/m2, 90% inactivation times T 90 are estimated for exposure to midday 10:00-14:00 direct plus diffuse sunlight and for nearby locations in the shade (diffuse UVB only). For the assumed D 90 = 40 J/m2 model applicable to SARS CoV viruses, calculated estimates show that near noon 11:00-13:00 clear-sky direct sunlight gives values of T 90 < 90 min for mid-latitude sites between March and September and less than 60 min for many equatorial sites for 12 months of the year. Recent direct measurements of UVB sunlight inactivation of the SARS CoV-2 virus that causes COVID-19 show shorter T 90 inactivation times less than 10 min depending on latitude, season, and hour. The equivalent UVC 254 nm D 90 dose for SARS CoV-2 is estimated as 3.2 ± 0.7 J/m2 for viruses on a steel mesh surface and 6.5 ± 1.4 J/m2 for viruses in a growth medium. For SARS CoV-2 clear-sky T 90 on a surface ranges from 4 min in the equatorial zone to less than 30 min in a geographic area forming a near circle with solar zenith angle < 60O centered on the subsolar point for local solar times from 09:00 to 15:00 h.

Keywords: COVID-19; Inactivation; Ozone; Radiative transfer; SARS CoV; UVB; UVC.


Conflict of interest statement

Conflict of interestThe authors have no conflicts or of interest or competing interests

Figures

Fig. 1
Fig. 1
The viral inactivation spectrum A(λ) normalized to 1 at 254 nm (blue), solar irradiance (red) at the Earth’s surface FO(W/m2 nm), and the product AFO(λ) (inset) for θ = 30O and Ω = 325 DU
Fig. 2
Fig. 2
A sample calculation of AFO for clear-sky conditions for Ω = 150 - 400 DU, and the 90% inactivation time T90 as a function of SZA using Eqs. 1, 2, and 4. TA90 is a polynomial approximate fit to T90
Fig. 3
Fig. 3
a The Earth as viewed by DSCOVR EPIC at 317 nm showing the effect of Rayleigh scattering. b the same scene but at 780 nm. c the calculated ratio of P(λ) diffuse divided by diffuse plus direct sunlight as a function of SZA for TCO3 = 275 DU and 375 DU
Fig 4
Fig 4
a The fitting function U(θ) in Eq. 5. b The fitting function R(θ) in Eq. 5
Fig. 5
Fig. 5
Noontime T90 inactivation times for coronavirus in minutes for Washington DC, US; Wuhan, CN; New York City, US; and Los Angeles, US; and using D90 = 40 J/m2. For the calculated Ratnesar-Shumate et al. (2020) SARS CoV-2 D90 = 3.2 J/m2, T90 in June would be about 4.8 for Washington, 4.4 for Wuhan, 5.6 New York City, and 4.8 min for Los Angeles. Figures are truncated at 240 min
Fig. 6
Fig. 6
Noontime T90 coronavirus inactivation times for four Cities in Europe, London, UK; Madrid, ES; Berlin, DE; and Rome, IT, using D90 = 40 J/m2. For the calculated RS SARS CoV-2 D90 = 3.2 J/m2, T90 in June would about 8 min for London, 5 min for Madrid, 8 min for Berlin, and 5 min for Rome. Figures are truncated at 240 min
Fig. 7
Fig. 7
Noontime T90 for an equatorial region city, Bogota, CO, and three cities in the Southern Hemisphere: Buenos Aires, AR; Cape Town, ZA; and Brisbane, AU using D90 = 40 J/m2. For the calculated RS SARS CoV-2 D90 = 3.2 J/m2, T90 in June would about 4 min for Bogota, in January 4 min Buenos Aires, Capetown, and Brisbane. Figures are truncated at 240 min
Fig. 8
Fig. 8
a Number of months <T90> 12:00 ≤ 120 min from column 6 in Table s1. b Minimum Min <T90> 12:00 vs. latitude from the data from column 5 in Table s1 as a function of latitude. The smoothed curve is a Loess(0.3) fit to the data. Loess(f) is locally weighted least squares fit to a fraction f of the data points, (Cleveland 1979, 1981). Figure is truncated at 240 min
Fig. 9
Fig. 9
a Number of months <T90> 13:00 ≤ 120 min. b 13:00 h minimum Min <T90> 13:00 vs. latitude. The smoothed curve is a Loess(0.3) fit to the data. Figure is truncated at 240 min
Fig. 10
Fig. 10
Comparison of Loess Min <T90> Hour for 12:00, 13:00, and 14:00 h. The values at θ = 0O are Min <T90> Hour = 47, 52, 76 min at 12:00, 13:00, 14:00 h, respectively. Figure is truncated at 240 min
Fig. 11
Fig. 11
Earth images from DSCOVR/EPIC for April 9, 2020 showing the superimposed outer circle (white) of clear-sky Min <T90> less than 65 min and the inner circle (white) for Min <T90> less than 50 min when D90 = 40 J/m2. Sunrise is on the left (west) and sunset is on the right (east). The subsolar point is approximately in the center of the circle slightly offset by the small DSCOVR/EPIC orbital view angle. For the calculated RS SARS CoV-2 D90 = 3.2 J/m2, a near-circle (dark-line) with solar zenith angle < 60O centered on the subsolar point would have Min <T90> less than 20 min
Fig. 12
Fig. 12
Earth images from DSCOVR/EPIC for January 2, 2019 and June 2, 2019 showing the superimposed outer circle (white) of clear-sky Min <T90> less than 65 min and the inner circle (white) for Min <T90> less than 50 min when D90 = 40 J/m2. Sunrise is on the left (west) and sunset is on the right (east). The subsolar point is approximately in the center of the circle slightly offset by the small DSCOVR/EPIC orbital view angle. For the calculated RS SARS CoV-2 D90 = 3.2 J/m2, a near-circle (dark-line) with solar zenith angle < 60O centered on the subsolar point would have Min <T90> less than 20 min
Fig. 13
Fig. 13
Inactivation of the SARS-CoV-2 virus at three different irradiances of simulated solar UVB, panels a, b, and c, 1.6, 0.7, and 0.3 W/m2 for the CoV-2 virus on a stainless-steel mesh surface based on the data from Fig. 4 of RS. Panel d is a summary of T90 from a, b, and c
Fig. 14
Fig. 14
Inactivation of the SARS-CoV-2 virus at three different irradiances of simulated solar UVB, panels a, b, and c, 1.6, 0.7, and 0.3 W/m2 for CoV-2 virus suspended in a growth medium based on the data from Fig. 5 of RS. Panel d is a summary of T90 from a, b, and c
Fig. 15
Fig. 15
a Number of months Min <T90> 12:00 ≤ 120 min (column 8 Table s1). b Minimum Min <T90> 12:00 vs. latitude as a function of latitude (column 7 Table s1). The smoothed curve is a Loess(0.3) fit to the data. For the estimated RS SARS CoV-2 D90 = 3.2 J/m2, T90 values at all latitudes − 60O to 60O are less than 18 min and the minimum values at the equator are T90 = 4 min
Fig. 16
Fig. 16
Estimated inactivation times for SARS Cov-2 virus dried on surfaces as a function of latitude at 12:00, 14:00, and 16:00 local solar time for the calculated RS D90 = 3.2 J/m2. a 12:00, b 14:00, c 16:00, d compare four different hours

References

    1. Anderson DJ, Gergen MF, Smathers E, Sexton DJ, Chen LF, Weber DJ, Rutala WA. Decontamination of targeted pathogens from patient rooms using an automated ultraviolet-C-emitting device. Infect Cont Hosp Ep. 2013;34(5):466–471. doi: 10.1086/670215. - DOI - PMC - PubMed
    1. Bedell K, Buchaklian A, Perlman S. Efficacy of an automated multiple emitter whole-room ultraviolet-C disinfection system against coronaviruses MHV and MERS-CoV. Infect Cont Hosp Ep. 2016;37(5):598–599. doi: 10.1017/ice2015348. - DOI - PMC - PubMed
    1. Cleveland WS. Robust locally weighted regression and smoothing scatter plots. J Am Stat Assoc. 1979;74:829–836. doi: 10.1080/01621459197910481038. - DOI
    1. Cleveland WS. A program for smoothing scatterplots by robust locally weighted regression. Am Stat. 1981;35(1):54. doi: 10.2307/2683591. - DOI
    1. Darnell MER, Subbarao K, Feinstone SM, Taylor DR. Inactivation of the coronavirus that induces severe acute respiratory syndrome, SARS-CoV. J Virol Methods. 2004;121:85–91. doi: 10.1016/jjviromet200406006. - DOI - PMC - PubMed

LinkOut - more resources