. 2020 Sep 4;9(10):6.
doi: 10.1167/tvst.9.10.6. eCollection 2020 Sep.

Dynamics of Contrast Decrement and Increment Responses in Human Visual Cortex

Affiliations

Dynamics of Contrast Decrement and Increment Responses in Human Visual Cortex

Anthony M Norcia et al. Transl Vis Sci Technol. .

Abstract

Purpose: The goal of the present experiments was to determine whether electrophysiologic response properties of the ON and OFF visual pathways observed in animal experimental models can be observed in humans.

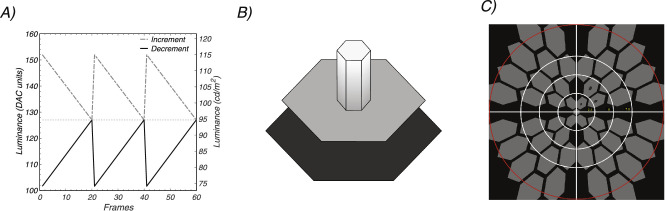
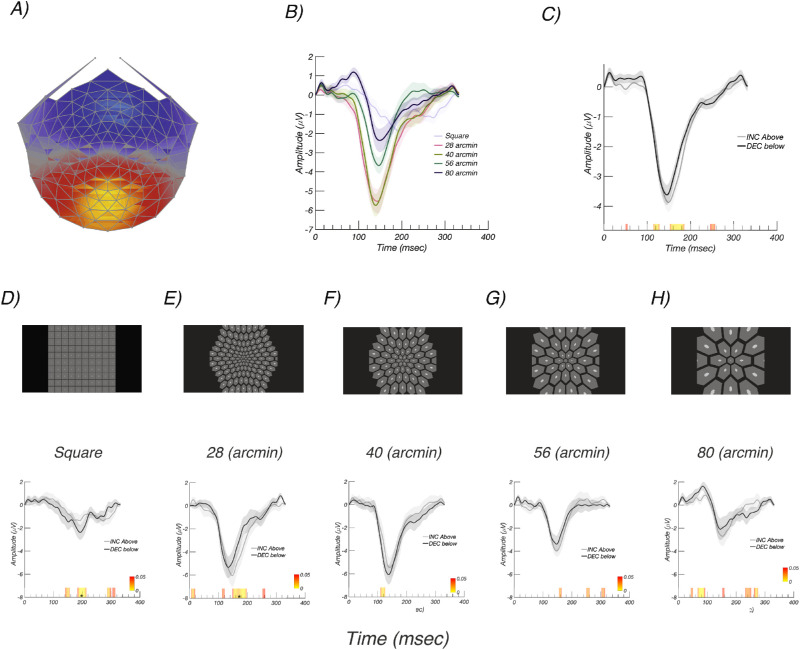
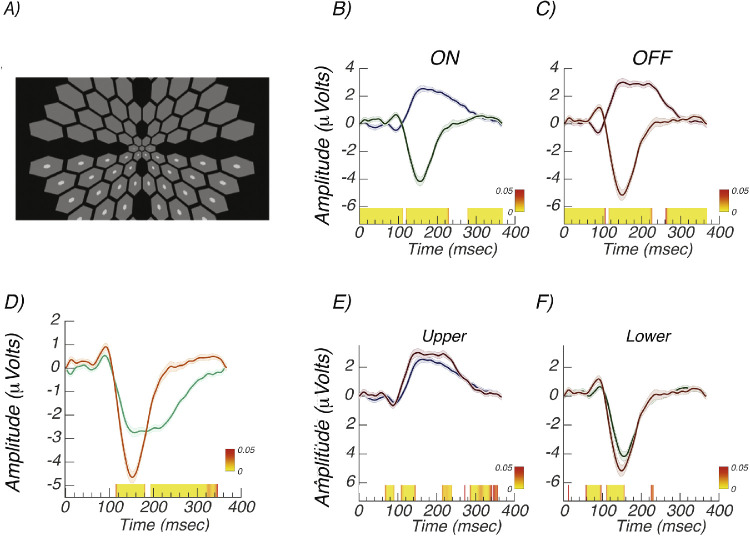
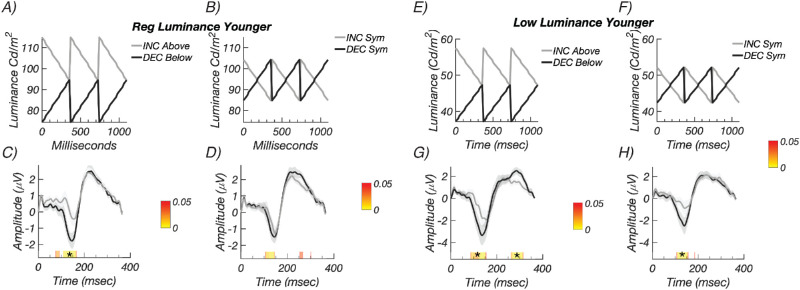
Methods: Steady-state visual evoked potentials (SSVEPs) were recorded in response to equivalent magnitude contrast increments and decrements presented within a probe-on-pedestal Westheimer sensitization paradigm. The probes were modulated with sawtooth temporal waveforms at a temporal frequency of 3 or 2.73 Hz. SSVEP response waveforms and response spectra for incremental and decremental stimuli were analyzed as a function of stimulus size and visual field location in 67 healthy adult participants.

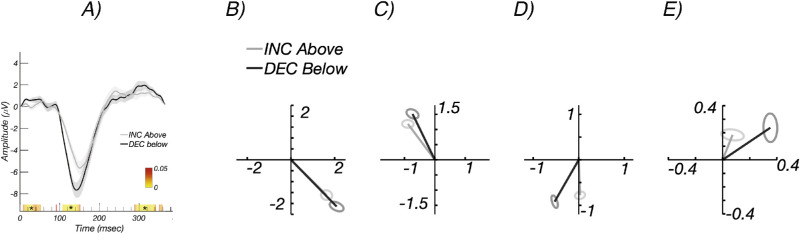
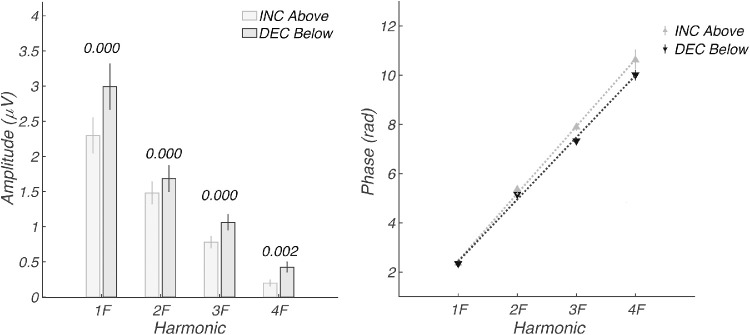
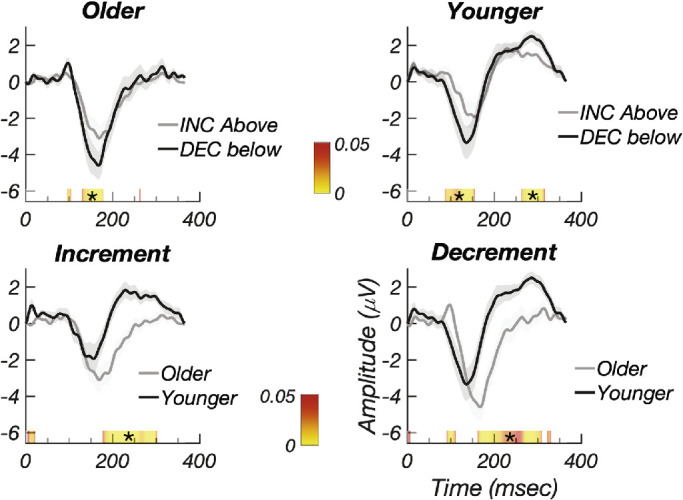
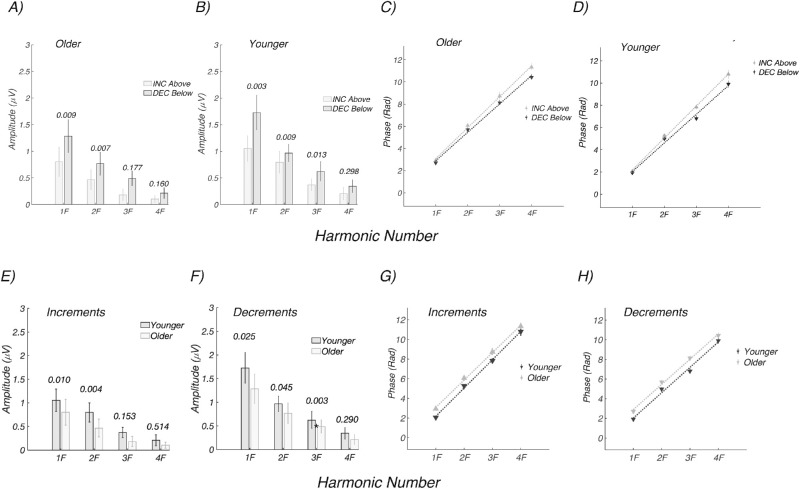
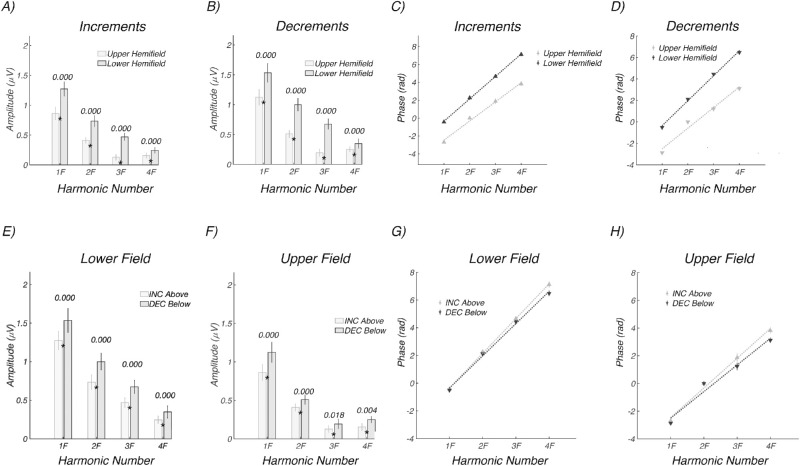
Results: SSVEPs recorded at the scalp differ between contrast decrements and increments of equal Weber contrast: SSVEP responses were larger in amplitude and shorter in latency for contrast decrements than for contrast increments. Both increment and decrement responses were larger for displays that were scaled for cortical magnification.

Conclusions: In a fashion that parallels results from the early visual system of cats and monkeys, two key properties of ON versus OFF pathways found in single-unit recordings are recapitulated at the population level of activity that can be observed with scalp electrodes, allowing differential assessment of ON and OFF pathway activity in human.

Translational relevance: As data from preclinical models of visual pathway dysfunction point to differential damage to subtypes of retinal ganglion cells, this approach may be useful in future work on disease detection and treatment monitoring.

Keywords: OFF pathway; ON pathway; latency; luminance contrast; visual evoked potentials.


Conflict of interest statement

Disclosure: A.M. Norcia, None; A. Yakovleva, None; B. Hung, None; J.L. Goldberg, None

Figures

Figure 1.
Figure 1.
(A) Probe waveforms. Incremental (gray) and decremental (black) sawtooth waveforms designed to favor ON versus OFF pathway responses, respectively. A stimulus frequency of 3 Hz is illustrated. Frame rate was 60 Hz. Dashed line indicates pedestal luminance. The left ordinate plots the digital to analog converter values (DAC) used. (B) Probe on pedestal display element. The sawtooth-modulated probes (small white hexagon) were presented on a mid-gray pedestal (medium size hexagon). An incremental pedestal is illustrated. The probe was 20% the size of the pedestal. The pedestal was surrounded by a black background region (largest hexagon). Weber contrast was 20% for both increments and decrements. (C) Scaled stimulus array. The visual field was tiled with a set of probe/pedestal elements. The size of the elements was scaled over eccentricity according to the cortical magnification factor to optimize responses from the periphery. Typical field size was ∼12 degrees in radius (rings indicate 2.5-degree eccentricity radii from central fixation).
Figure 2.
Figure 2.
Experiment 1: Array scale tuning. (A) Response topography of the RC1 component learned over all array sizes. Response is maximal over Oz. (B) Responses to different array sizes pooled over contrast polarity (see legend for condition labels). Responses are largest for the 40-arcmin array. (C) Responses to increments/ON (gray) and decrements/OFF (black) pooled over array size. Responses to increments and decrements are comparable. (D–H) Top panels present schematic illustrations of the stimulus arrays. (D–H) Bottom panels show corresponding RC1 evoked responses with increments/ON in gray and decrements/OFF in black. See text for details. Color bar indicates P values for the difference between conditions, starting at P < 0.05 in red. Asterisks indicate runs that pass the run correction criterion at P < 0.05.
Figure 3.
Figure 3.
Experiment 2: Estimation of delay in the frequency domain. (A) Time-domain waveform for ON/increment (gray) and OFF/decrement (black) responses in the younger participant group. (B–E) Nyquist diagrams for 1F, 2F, 3F, and 4F, respectively, showing magnitude and phase of the evoked response for ON/increments (gray) and OFF/decrements (black). Responses to decrements are larger than for increments and are phase advanced relative to responses to increments. Phase origin is at 3 o'clock; increasing delay is in the counterclockwise direction. Color bar in (A) indicates P values for the difference between groups or conditions, with starting at P < 0.05 in red. Asterisks indicate runs that pass the run correction criterion at P < 0.05. Error ellipses are ±1 SEM.
Figure 4.
Figure 4.
Experiment 2: Response amplitude and delay estimation in frequency domain. (A) Amplitudes at the first four harmonics of the stimulus frequency (1F, 2F, 3F, 4F) for the time-domain data shown in Figure 3. Values above the bars indicate the significance level of the within-participant difference. (B) Response phase in radians as a function of response harmonic. A shallower slope indicates less delay. The estimated delays for increment/ON and decrement/OFF responses are 159.2 ± 1.8 ms and 146.8 ± 2.4 ms, respectively. Error bars are ±1 SEM.
Figure 5.
Figure 5.
Experiment 3: (Top left) Increment/ON (gray) versus decrement/OFF (black) responses for older participants. (Top right) Increment/ON (gray) versus decrement/OFF (black) responses for younger participants. Responses to decrements are larger for decrements in both groups. (Bottom left) Increment/ON responses for older (gray) and younger (black) participants. (Bottom right) Decrement/OFF responses for older (gray) and younger (black) participants. The trailing edge of the negative peak cuts off sooner for younger participants. Error bands plot ±1 SEM. Color bar indicates P values for the difference between the contrast polarity conditions or age conditions, starting at P < 0.05 in red. Asterisks indicate runs that pass the run correction criterion at P < 0.05.
Figure 6.
Figure 6.
Experiment 3: Amplitude and delay estimates for older (n = 19) and younger (n = 12) participants. (A) Response amplitudes for decrements (dark bars) are larger than for increments (light bars) in the older participants. (B) Response amplitude for decrements (dark) are larger than for increments (light) in the younger participants. (C) Responses are faster for decrements than for increments in the older participants (149.3 ± 3.2 vs. 162.4 ± 2.5 ms, respectively). (D) Responses are faster for decrements than for increments in the younger participants (150.3 ± 5.0 vs. 167.7 ± 2.4 ms, respectively). (E) Response amplitudes are larger for increments in the younger participants (dark bars) than older participants (light bars). (F) Response amplitudes are larger for increments in the younger participants (dark bars) than older participant (light bars). (G) Response phase versus harmonic number functions for increments are shifted vertically for older participants. (G) Response phase versus harmonic number functions for increments are shifted vertically for older participants and have a slope difference. (H) Response phase versus harmonic number functions for decrements are shifted vertically for older participants with no change in slope.
Figure 7.
Figure 7.
Experiment 4: Upper versus lower field responses. (A) Schematic illustration of lower field increment test configuration. The pedestals were always presented in both hemifields, but probes were presented in only one. Both increments and decrements were tested. (B) Increment/ON responses from upper (gray) and lower (black) visual fields are polarity inverted. (C) Decrement/OFF responses from upper (gray) and lower (black) visual fields are polarity inverted. (D) Comparison of upper (green) and lower field (orange) responses, pooled over contrast polarity. The polarity of the upper field responses has been inverted. (E) Comparison of increment/ON (gray) versus decrement/OFF (black) responses in the upper visual field. (F) Comparison of increment/ON (gray) versus decrement/OFF (black) responses in the lower visual field. Error bands are ±1 SEM.
Figure 8.
Figure 8.
Experiment 4: Hemifield response amplitude and phase as a function of frequency (harmonic number). (A) Upper field (light gray) versus lower field (dark gray) response amplitudes for increments. (B) Upper field (light gray) versus lower field (dark gray) response amplitudes for decrements. (C, D) Corresponding delay estimates. Responses are larger and slower for the lower visual field; see text for details. (E) Lower field responses for increments (light gray) and decrements (dark gray). (F) Upper field responses for increments (light gray) and decrements (dark gray). (G, H) Corresponding latency estimates. Responses are larger and faster for decrements in both visual hemifields. See text for details.
Figure 9.
Figure 9.
Experiment 5: Control recordings with constant Michelson contrast. (A) Schematic illustration of the biased, higher luminance decremental (black) and incremental (gray) conditions. (B) Illustration of the symmetric, equal Michelson contrast conditions using the same convention. (C) Responses for biased decremental (black) and incremental conditions (gray) are larger for decrements than increments. (D) Responses for symmetric decremental (black) and incremental conditions (gray). Response amplitudes do not differ after run correction. See text for latency estimates. The lower-luminance biased condition luminance profiles are shown schematically in panel E and the symmetric conditions in panel F. (G) Responses are larger for biased decrements than biased increments. (G) Response amplitudes are larger for symmetric decrements than for symmetric increments. See text for latency estimates. Color bars indicate times of significant difference (P < 0.05, stars indicate significant runs).

Similar articles

Cited by

References

    1. Dowling JE, Werblin FS. Synaptic organization of the vertebrate retina. Vision Res. 1971;(suppl 3): 1–15. - PubMed
    1. Famiglietti EV Jr, Kolb H. Structural basis for ON-and OFF-center responses in retinal ganglion cells. Science. 1976; 194: 193–195. - PubMed
    1. Wassle H. Parallel processing in the mammalian retina. Nat Rev Neurosci. 2004; 5: 747–757. - PubMed
    1. LeVay S, McConnell SK. ON and OFF layers in the lateral geniculate nucleus of the mink. Nature. 1982; 300: 350–351. - PubMed
    1. Stryker MP, Zahs KR. On and off sublaminae in the lateral geniculate nucleus of the ferret. J Neurosci. 1983; 3: 1943–1951. - PMC - PubMed

Publication types