

High-resolution microscopy for imaging cancer pathobiology
- PMID: 32953251
- PMCID: PMC7500261
- DOI: 10.1007/s40139-019-00201-w
High-resolution microscopy for imaging cancer pathobiology
Abstract
Purpose of review: Light microscopy plays an essential role in clinical diagnosis and understanding the pathogenesis of cancer. Conventional bright-field microscope is used to visualize abnormality in tissue architecture and nuclear morphology, but often suffers from many limitations. This review focuses on the potential of new imaging techniques to improve basic and clinical research in pathobiology.
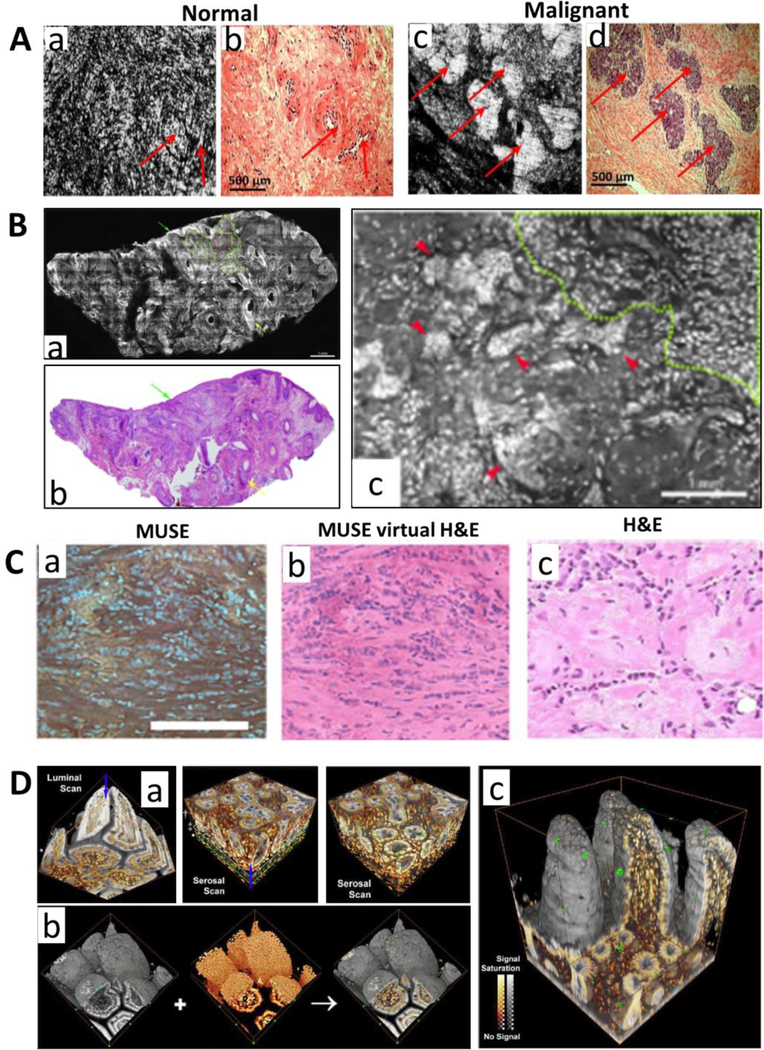
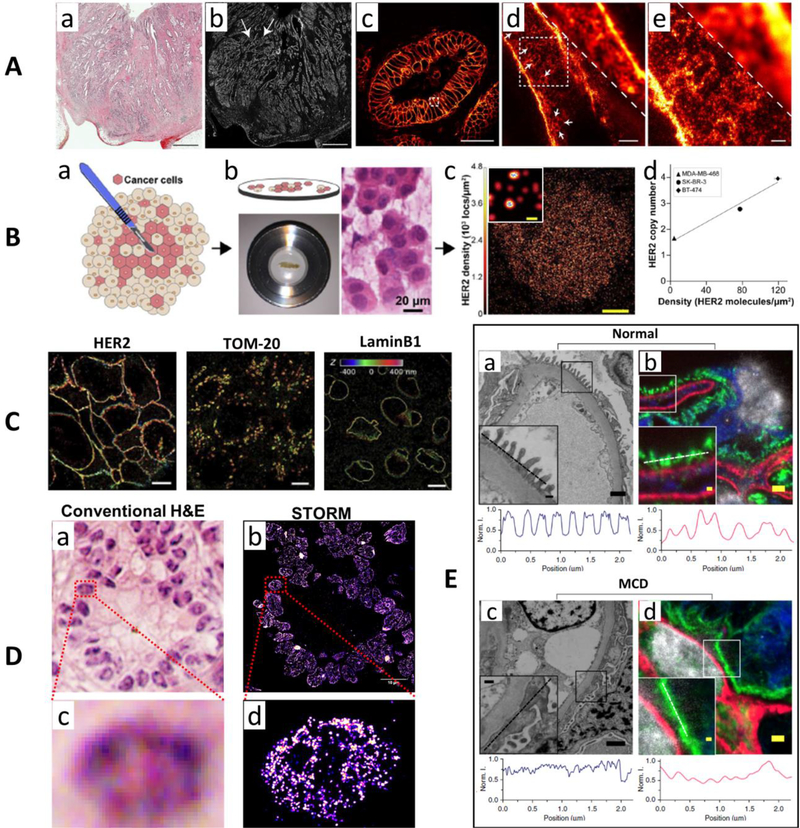
Recent findings: Light microscopy has significantly expanded its ability in resolution, imaging volume, speed and contrast. It now allows 3D high-resolution volumetric imaging of tissue architecture from large tissue and molecular structures at nanometer resolution.
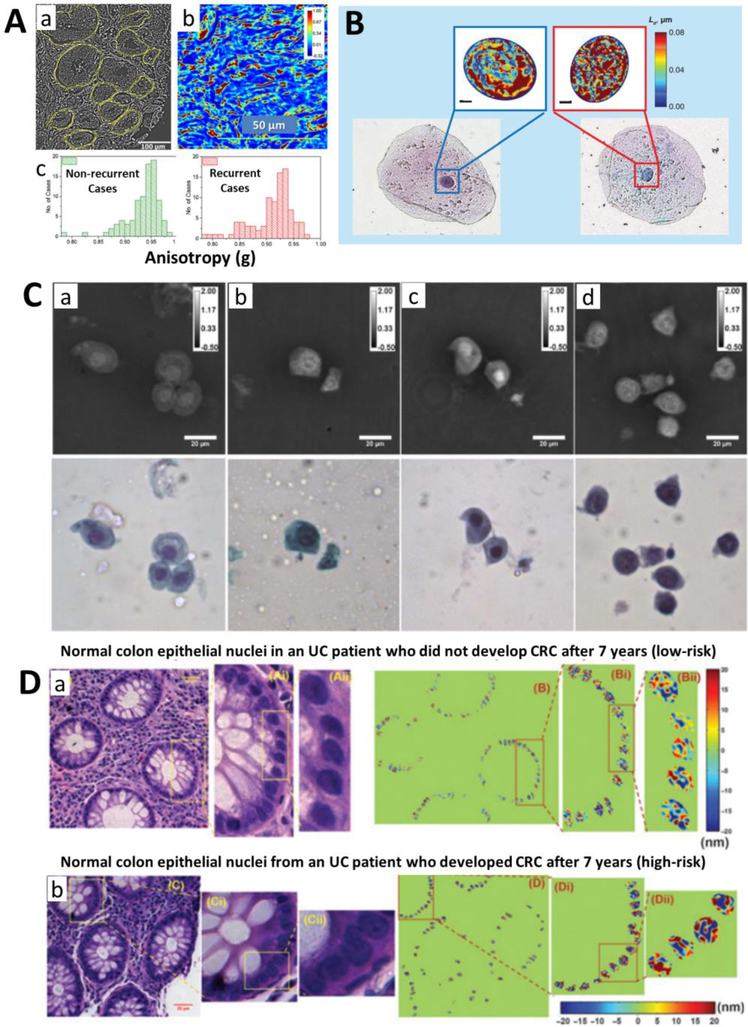
Summary: Pathologists and researchers now have access to various imaging tools to study cancer pathobiology in both breadth and depth. Although clinical adoption of a new technique is slow, the new imaging tools will provide significant new insights and open new avenues for improving early cancer detection, personalized risk assessment and identifying the best treatment strategies.
Keywords: 3D volumetric imaging; label-free imaging; light microscopy; super-resolution microscopy.
Conflict of interest statement
Compliance with Ethics Guidelines Conflict of Interest Jianquan Xu declares no conflict of interest. Yang Liu is the co-inventor for several US patents on light microscopy techniques to analyze nanoscale nuclear architecture for cancer diagnosis and other applications, owned by University of Pittsburgh.
Figures
Similar articles
-
A workflow for 3D-CLEM investigating liver tissue.J Microsc. 2021 Mar;281(3):231-242. doi: 10.1111/jmi.12967. Epub 2020 Oct 27. J Microsc. 2021. PMID: 33034376
-
Light-sheet fluorescence expansion microscopy: fast mapping of neural circuits at super resolution.Neurophotonics. 2019 Jan;6(1):015005. doi: 10.1117/1.NPh.6.1.015005. Epub 2019 Feb 8. Neurophotonics. 2019. PMID: 30796881 Free PMC article.
-
Application of Super-resolution SPEED Microscopy in the Study of Cellular Dynamics.Chem Biomed Imaging. 2023 Jun 24;1(4):356-371. doi: 10.1021/cbmi.3c00036. eCollection 2023 Jul 24. Chem Biomed Imaging. 2023. PMID: 37501792 Free PMC article. Review.
-
Single-molecule super-resolution light-sheet microscopy.Chemphyschem. 2014 Mar 17;15(4):577-86. doi: 10.1002/cphc.201300732. Epub 2014 Feb 25. Chemphyschem. 2014. PMID: 24615819 Review.
-
[Comparison and progress review of various super-resolution fluorescence imaging techniques].Se Pu. 2021 Oct;39(10):1055-1064. doi: 10.3724/SP.J.1123.2021.06015. Se Pu. 2021. PMID: 34505427 Free PMC article. Review. Chinese.
Cited by
-
Advancements and Practical Considerations for Biophysical Research: Navigating the Challenges and Future of Super-resolution Microscopy.Chem Biomed Imaging. 2024 Apr 19;2(5):331-344. doi: 10.1021/cbmi.4c00019. eCollection 2024 May 27. Chem Biomed Imaging. 2024. PMID: 38817319 Free PMC article. Review.
-
Super-Resolution Microscopy: Shedding New Light on In Vivo Imaging.Front Chem. 2021 Sep 14;9:746900. doi: 10.3389/fchem.2021.746900. eCollection 2021. Front Chem. 2021. PMID: 34595156 Free PMC article. Review.
-
Battlegrounds of treatment resistance: decoding the tumor microenvironment.Naunyn Schmiedebergs Arch Pharmacol. 2025 Mar 25. doi: 10.1007/s00210-025-04055-5. Online ahead of print. Naunyn Schmiedebergs Arch Pharmacol. 2025. PMID: 40131387 Review.
-
Cancer Cell Culture: The Basics and Two-Dimensional Cultures.Methods Mol Biol. 2023;2645:3-40. doi: 10.1007/978-1-0716-3056-3_1. Methods Mol Biol. 2023. PMID: 37202610
-
The Tissue Architecture of Oral Squamous Cell Carcinoma Visualized by Staining Patterns of Wheat Germ Agglutinin and Structural Proteins Using Confocal Microscopy.Cells. 2021 Sep 18;10(9):2466. doi: 10.3390/cells10092466. Cells. 2021. PMID: 34572115 Free PMC article.
References
-
- Vennalaganti P, Kanakadandi V, Goldblum JR, Mathur SC, Patil DT, Offerhaus GJ et al. Discordance Among Pathologists in the United States and Europe in Diagnosis of Low-Grade Dysplasia for Patients With Barrett’s Esophagus. Gastroenterology. 2017;152(3):564–70 e4. doi:10.1053/j.gastro.2016.10.041. - DOI - PubMed
-
- Kose K, Gou M, Yelamos O, Cordova M, Rossi AM, Nehal KS et al. Automated video-mosaicking approach for confocal microscopic imaging in vivo: an approach to address challenges in imaging living tissue and extend field of view. Sci Rep. 2017;7(1):10759. doi:10.1038/s41598-017-11072-9. - DOI - PMC - PubMed
Grants and funding
LinkOut - more resources
Full Text Sources
Research Materials